gdp Maps
48 geographic visualizations tagged with "gdp"
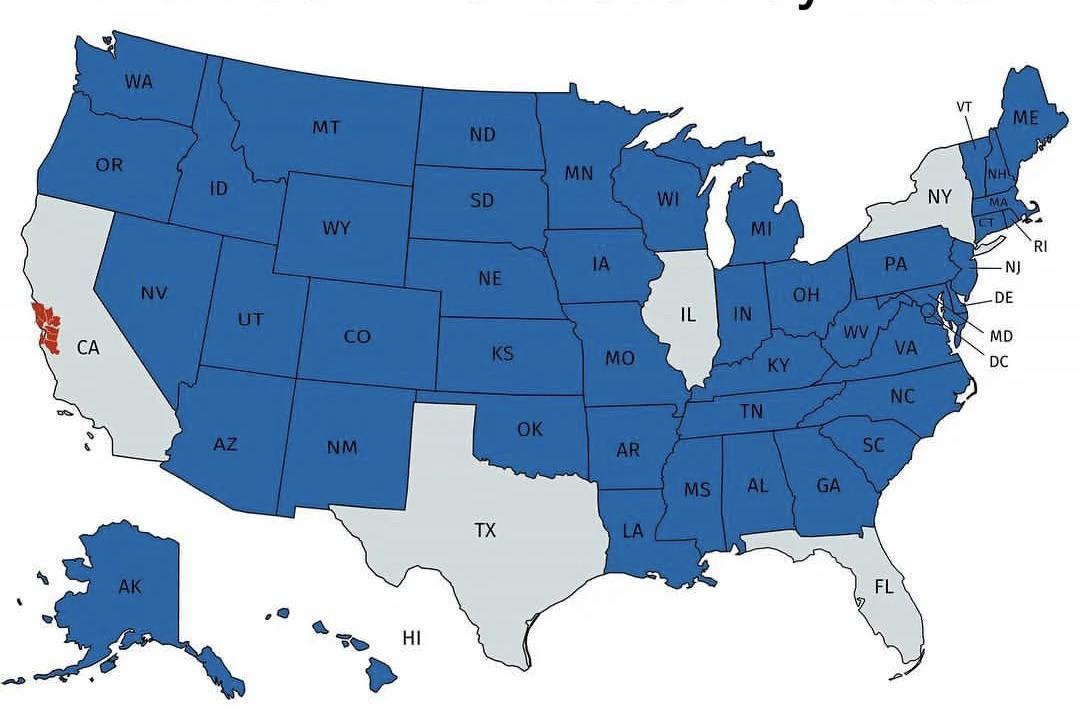
U.S. States with Smaller Economies than San Francisco Bay Area Map
This map provides a striking visualization of U.S. states whose economies are smaller than that of the San Francisco Bay...
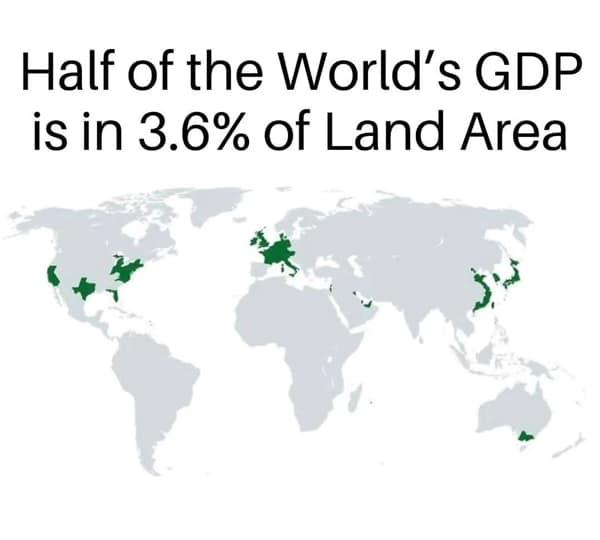
Global Economic Concentration Map
The "Global Economic Concentration Map" illustrates the distribution of economic activity across the globe, highlighting...
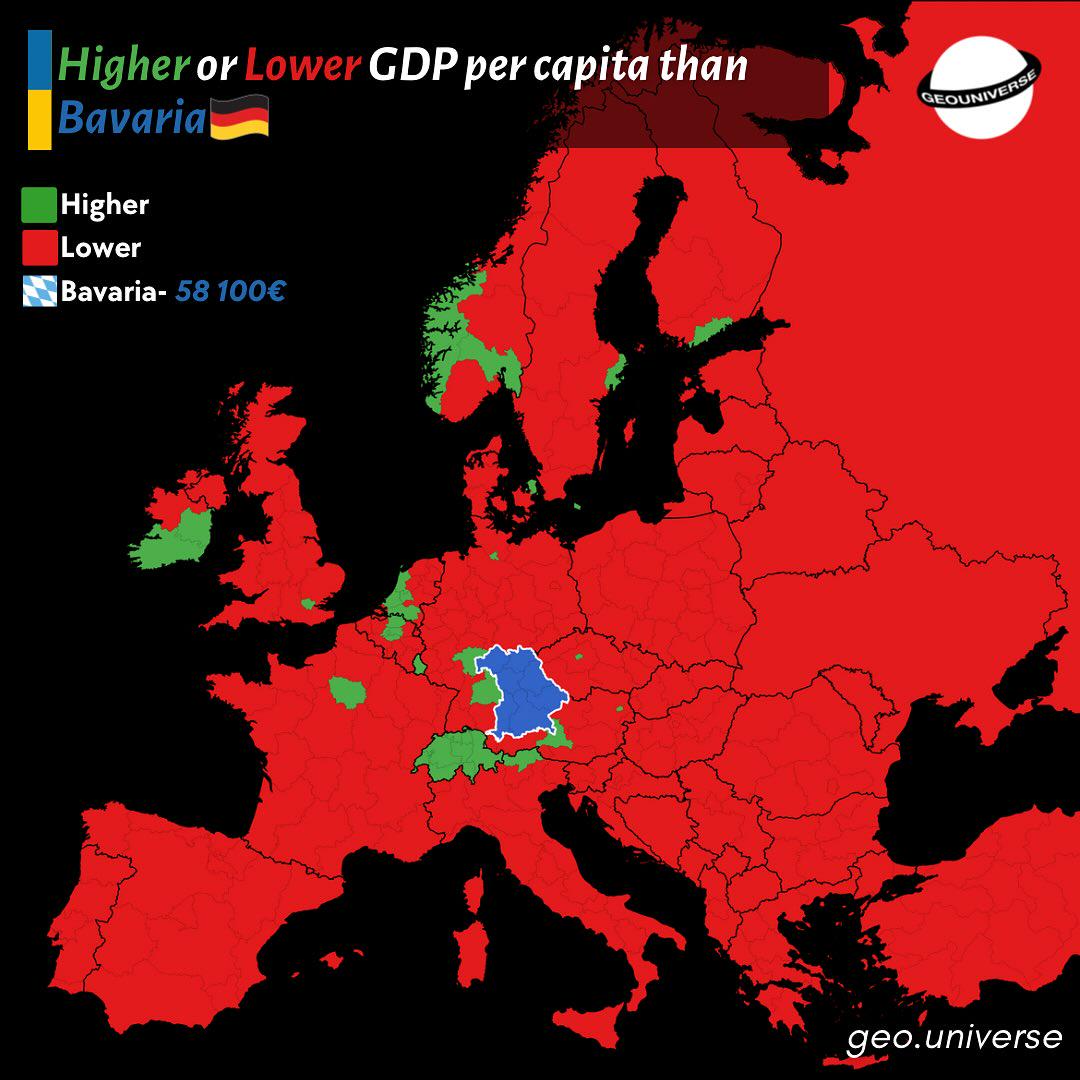
Bavaria Wealth Comparison Map to Europe
The "How Rich is Bavaria Compared to the Rest of Europe?" map provides a visual representation of the economic status of...
Global GDP Per Capita Map
This map provides a visual representation of Gross Domestic Product (GDP) per capita across countries worldwide. GDP per...
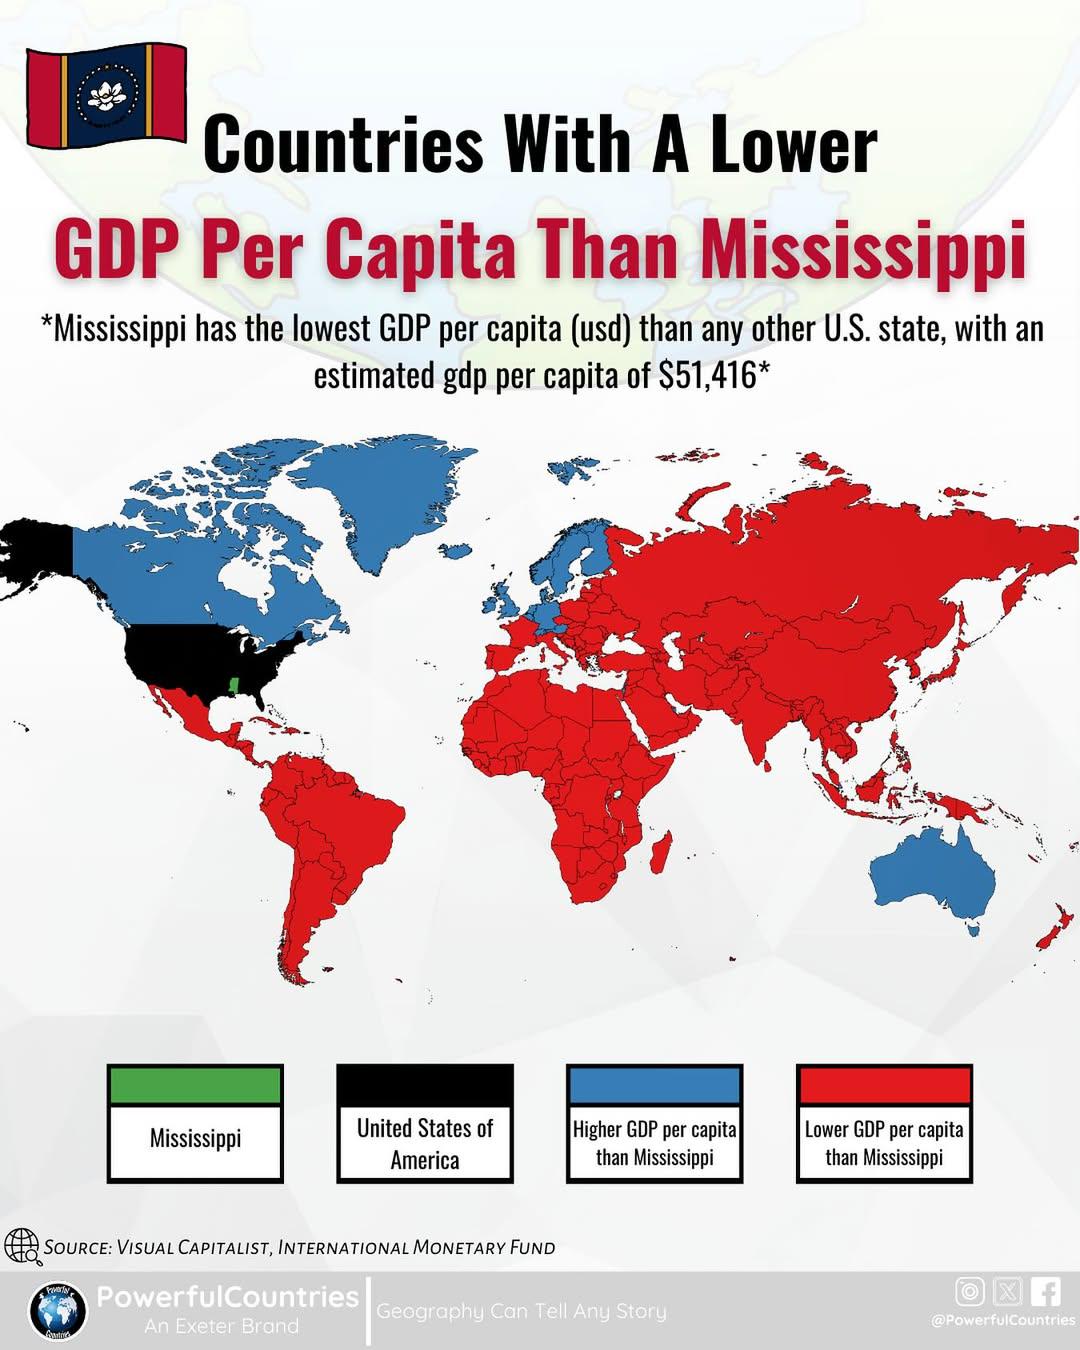
Map of Countries with Lower GDP Per Capita than Mississippi
This map provides a striking visual representation of countries whose GDP per capita falls below that of Mississippi, wh...
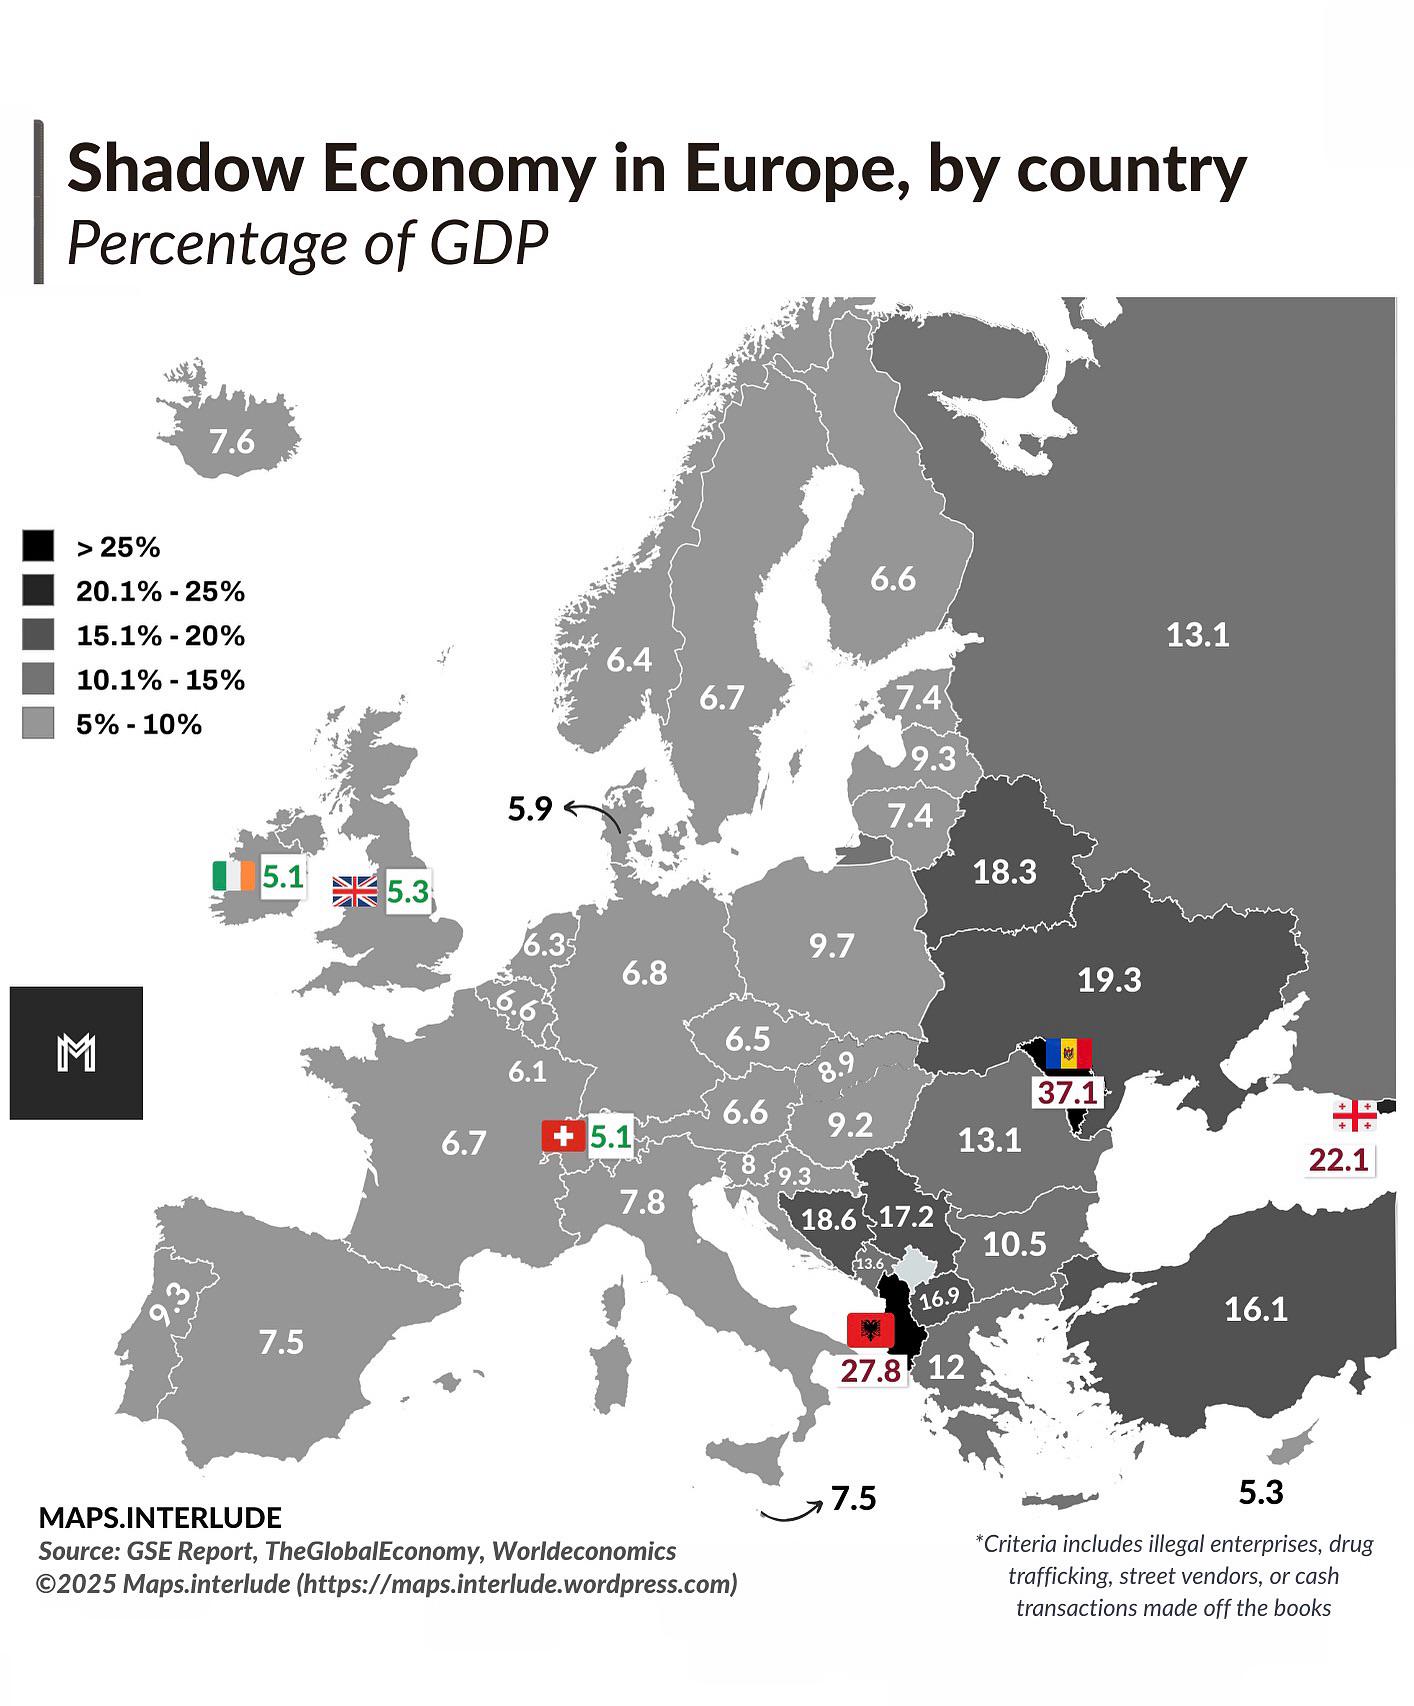
Shadow Economy in Europe by Country Map
The "Shadow Economy in Europe, by Country" map provides a revealing snapshot of the informal economy across various Euro...
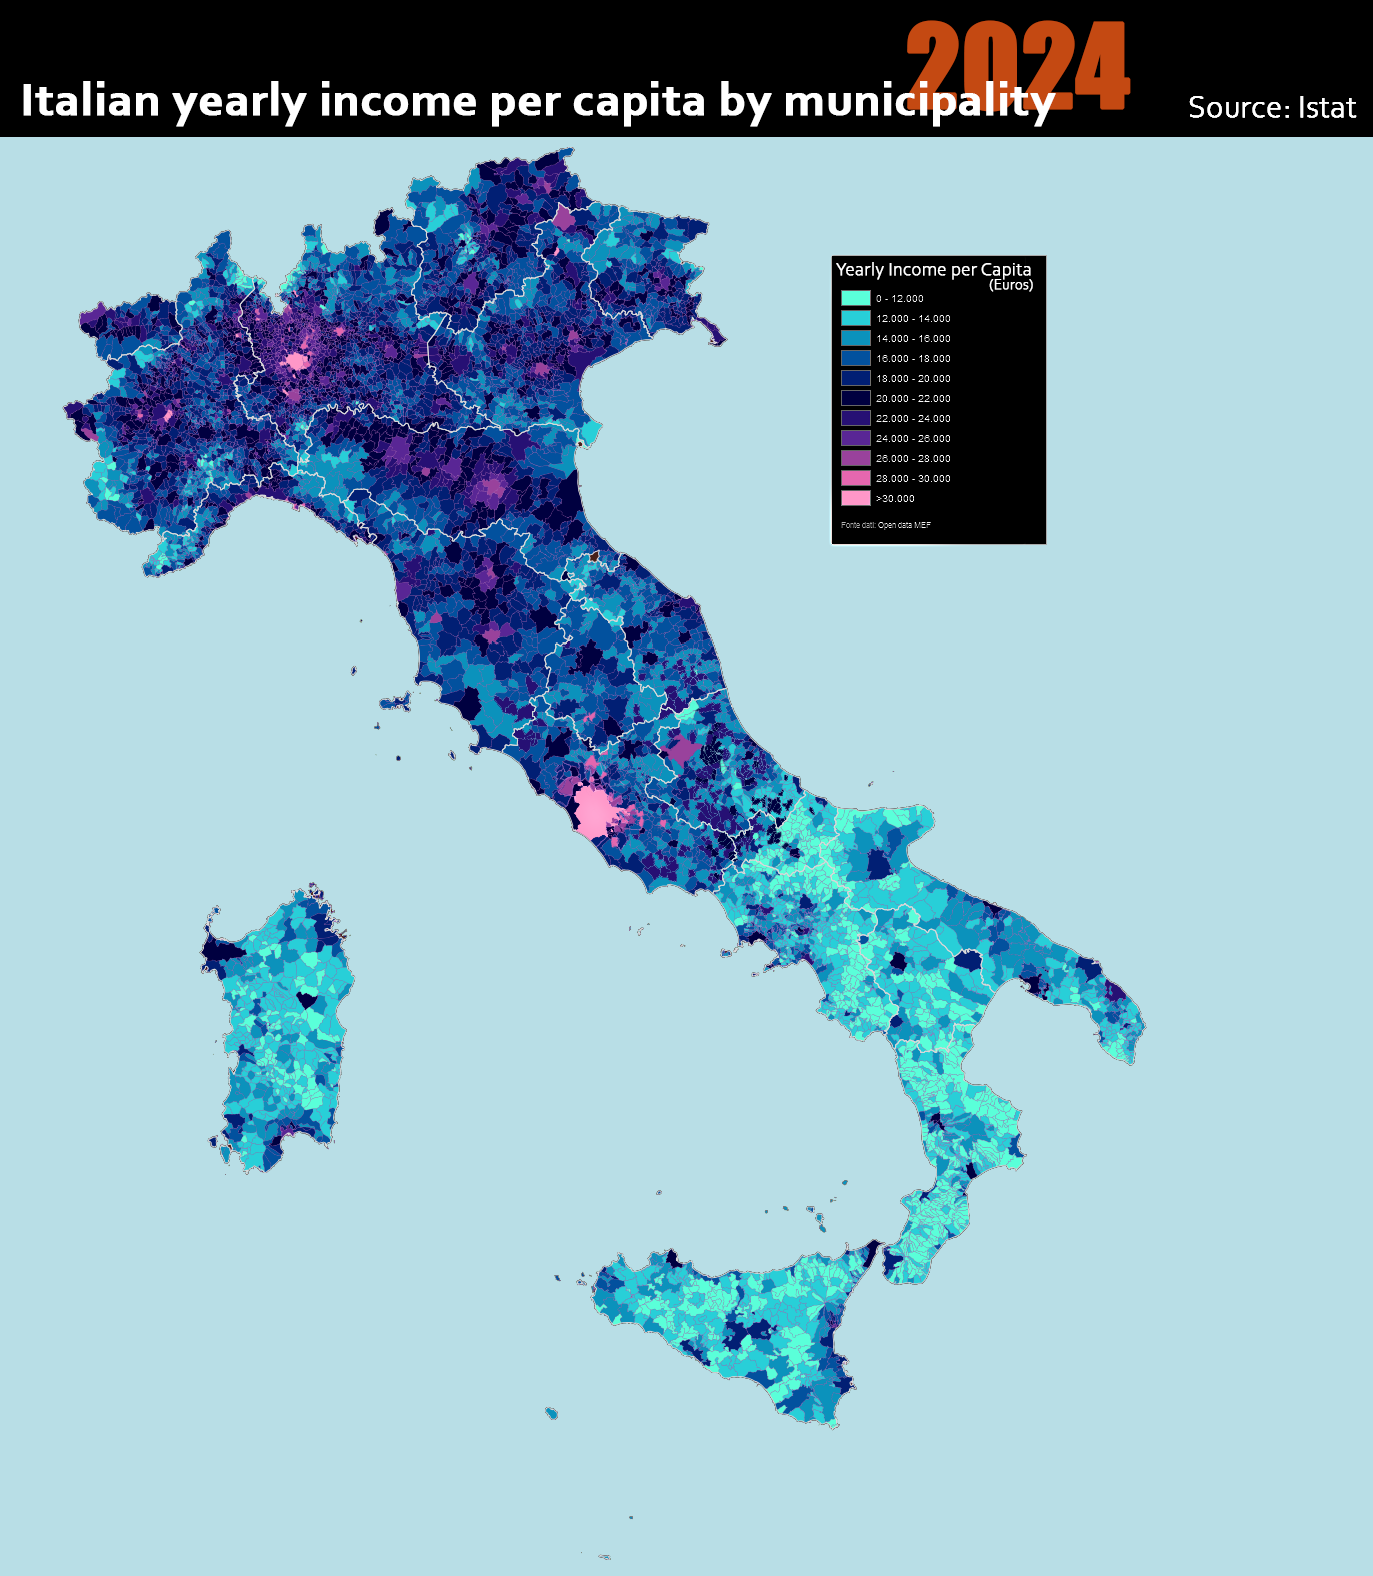
Italian Yearly Income Per Capita by Municipality Map
The "Italian Yearly Income per Capita by Municipality 2024" map provides an insightful look into the economic landscape ...
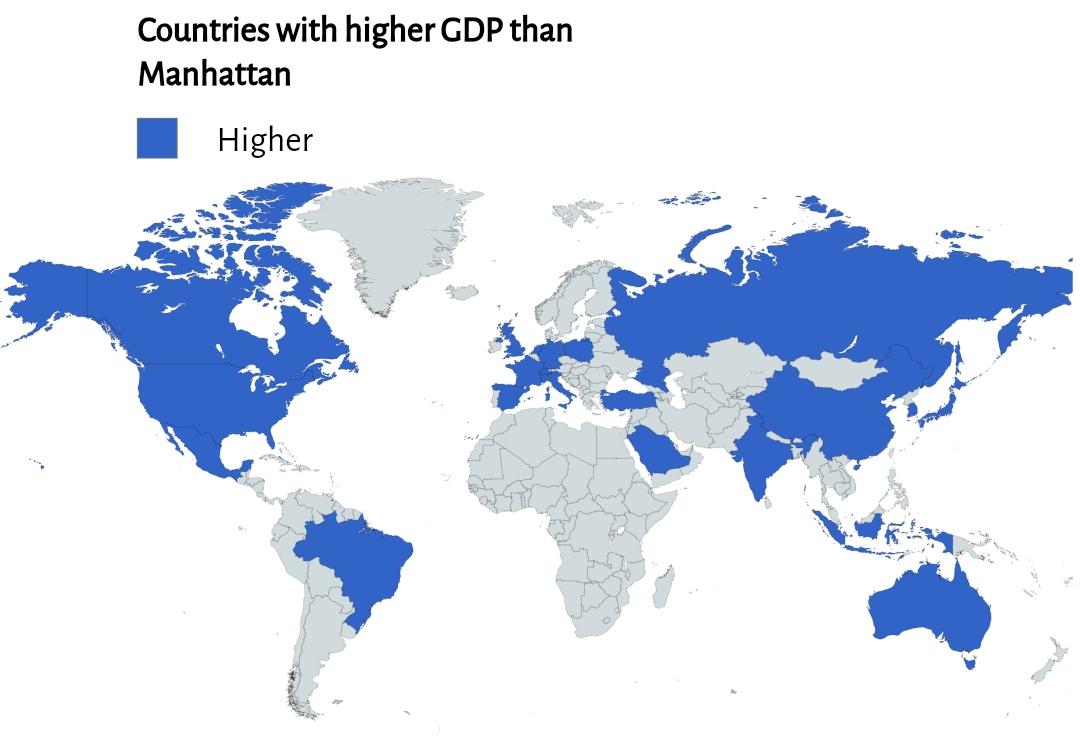
GDP Comparison Map of Manhattan County
This map provides a striking visualization of the economic power of Manhattan County by comparing its Gross Domestic Pro...
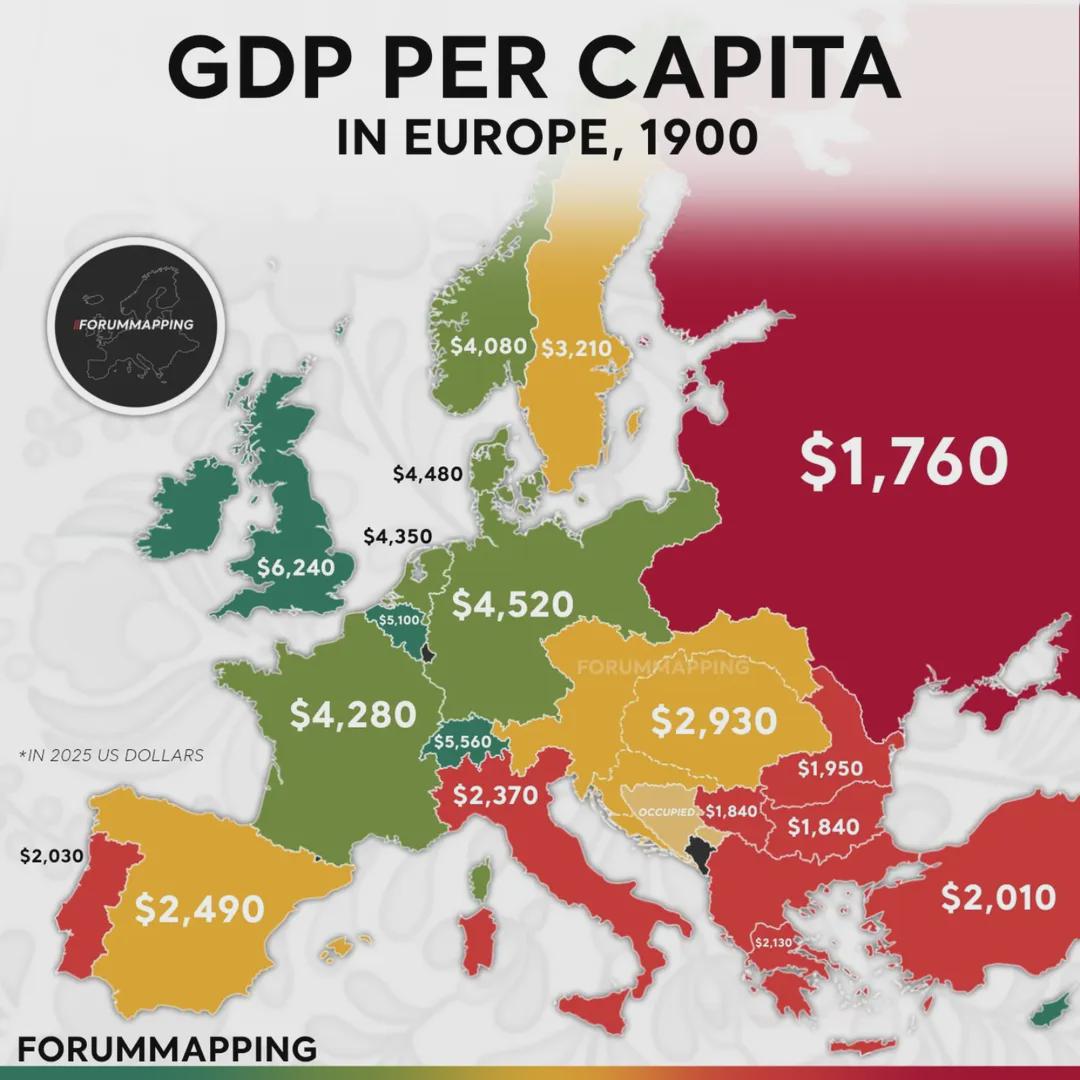
GDP Per Capita (PPP) in Europe Map
The map titled "GDP per Capita (PPP) in Europe (1900)" provides a compelling snapshot of economic disparities across the...
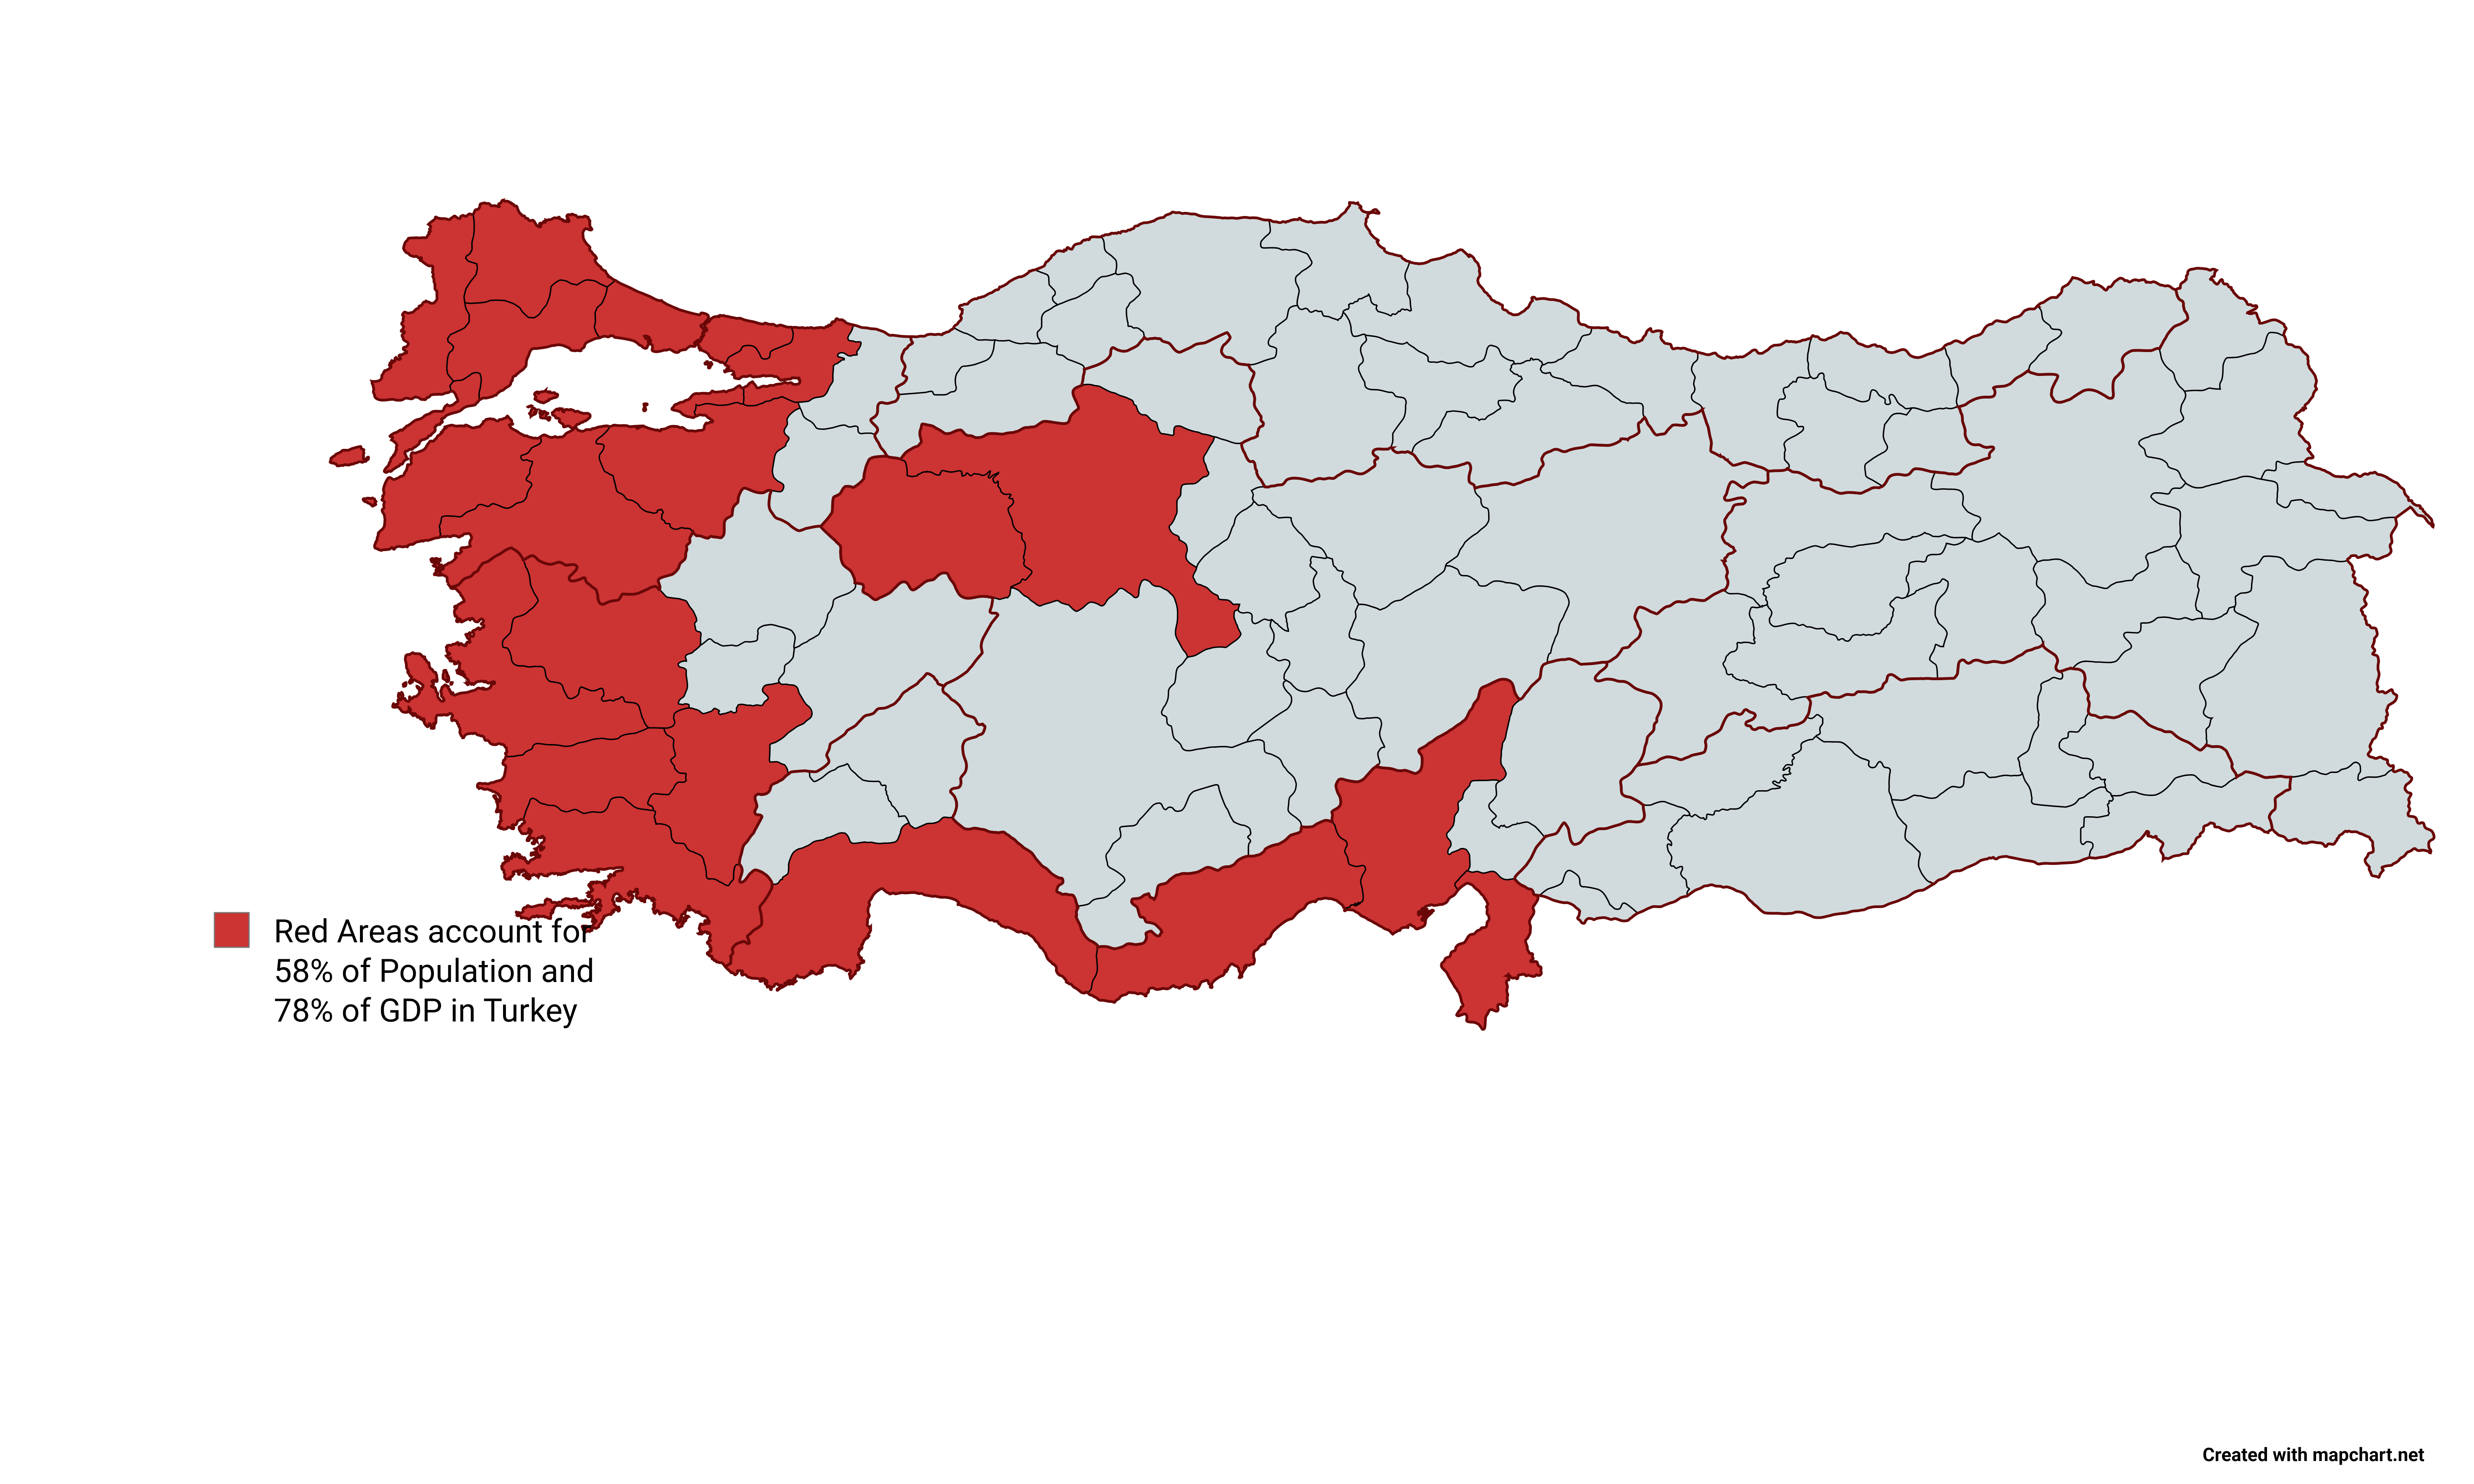
Turkey Population and GDP Distribution Map
The map titled "Red Areas Accounts for 58% of Population and 78% of GDP in Turkey" visually represents the distribution ...
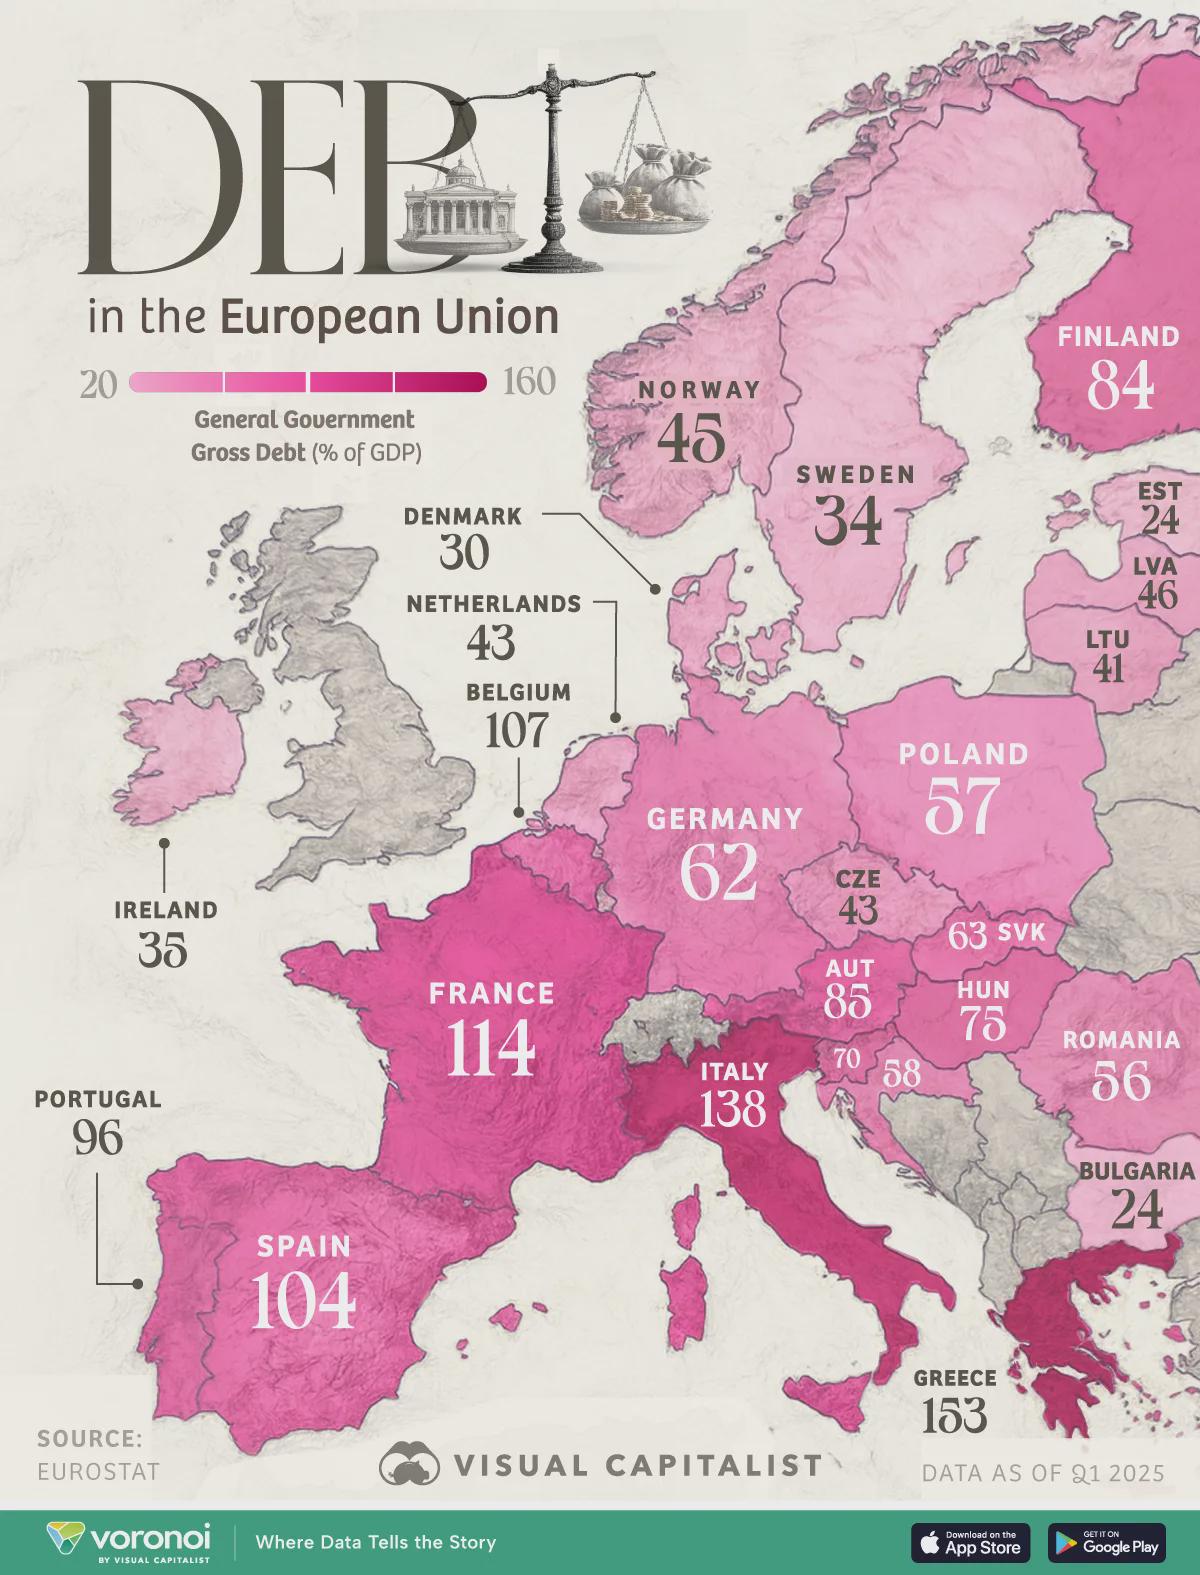
EU Countries Debt to GDP Ratio Map
The \...
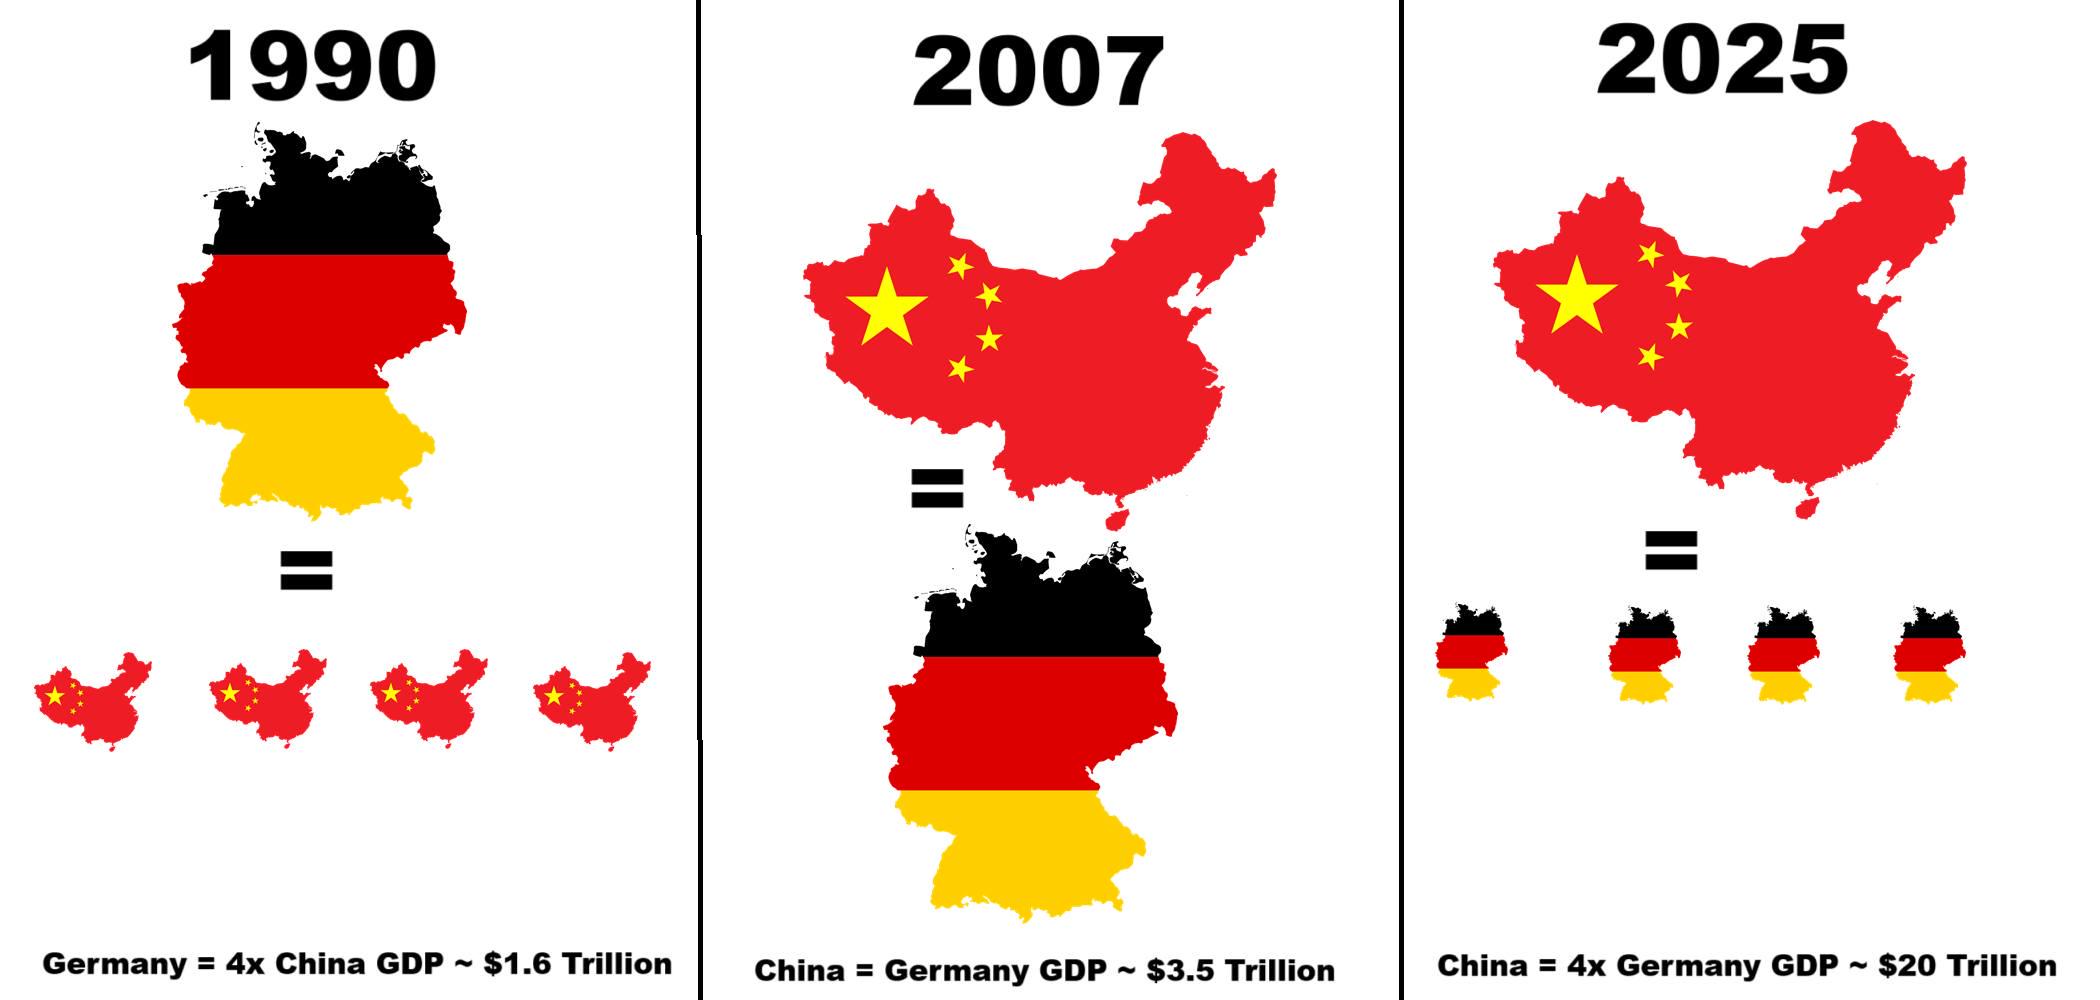
China and Germany Economy Map Comparison 1990
...
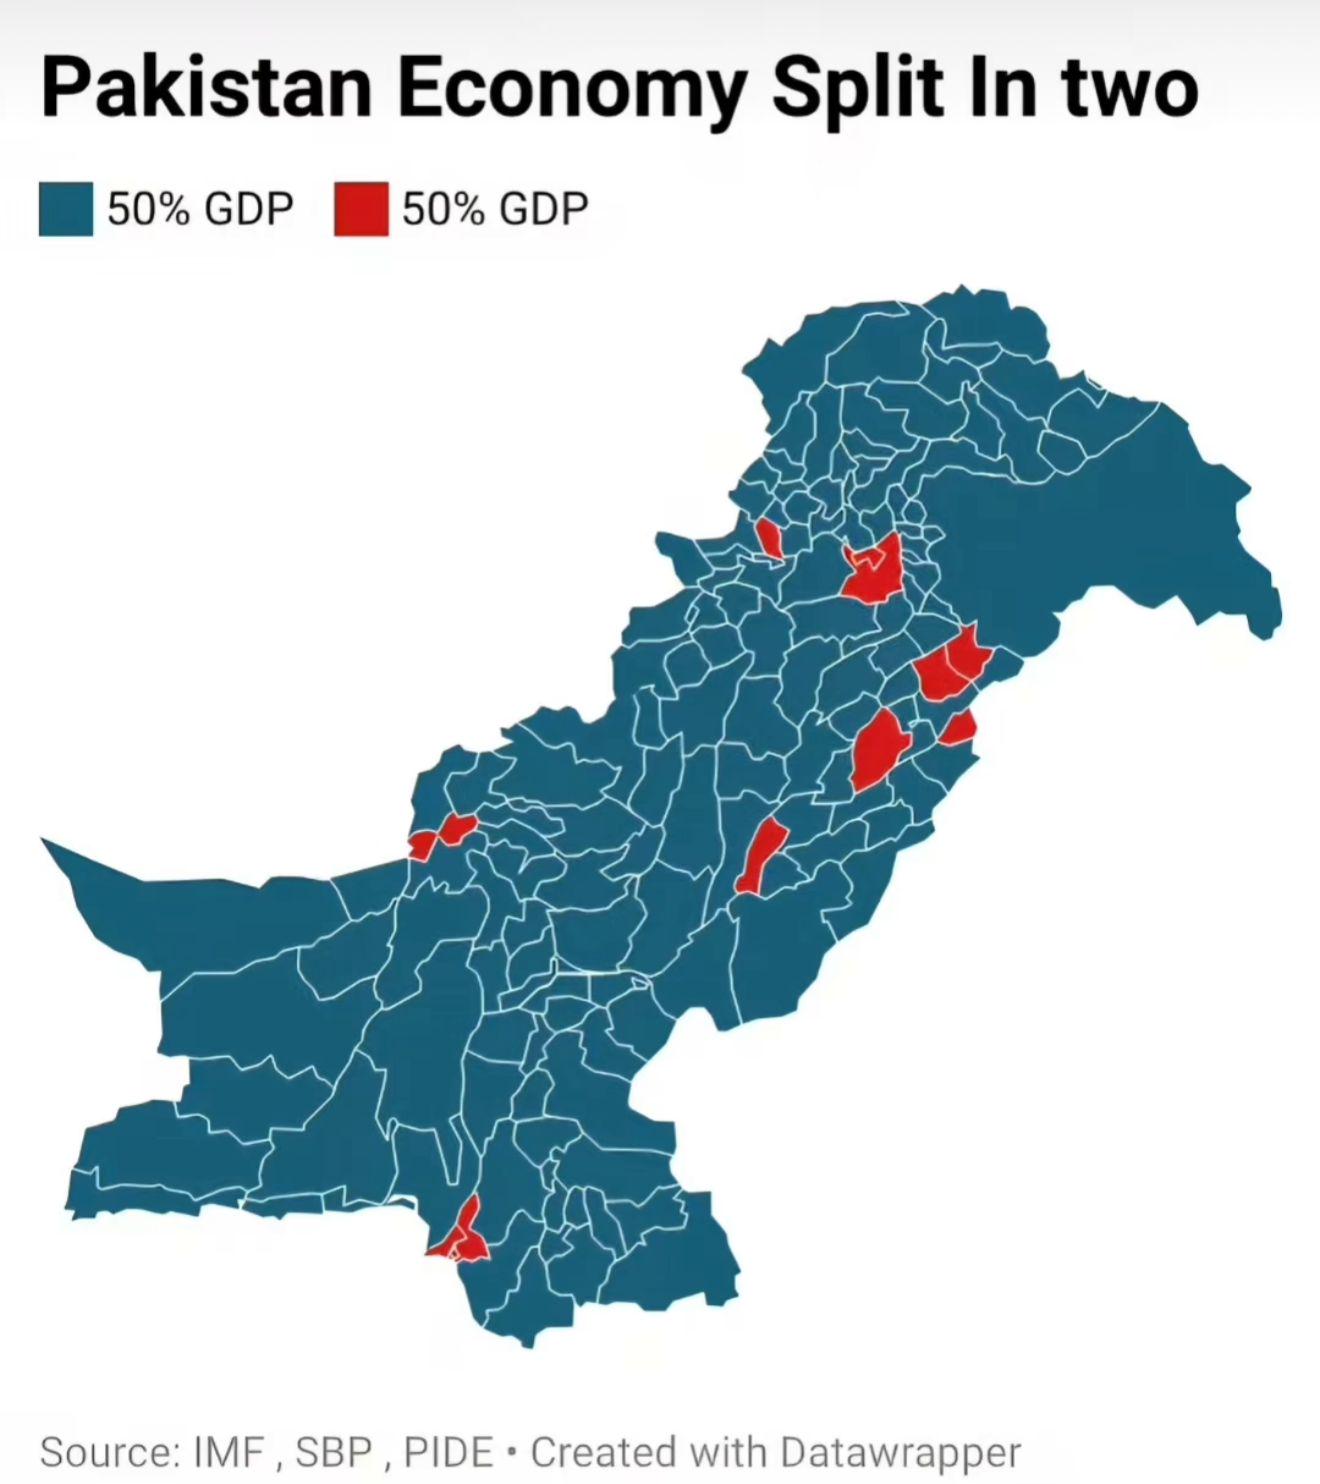
Economic Distribution Map of Pakistan
The map titled "Pakistan's Economy Split in Two" provides a compelling visual representation of the economic landscape a...
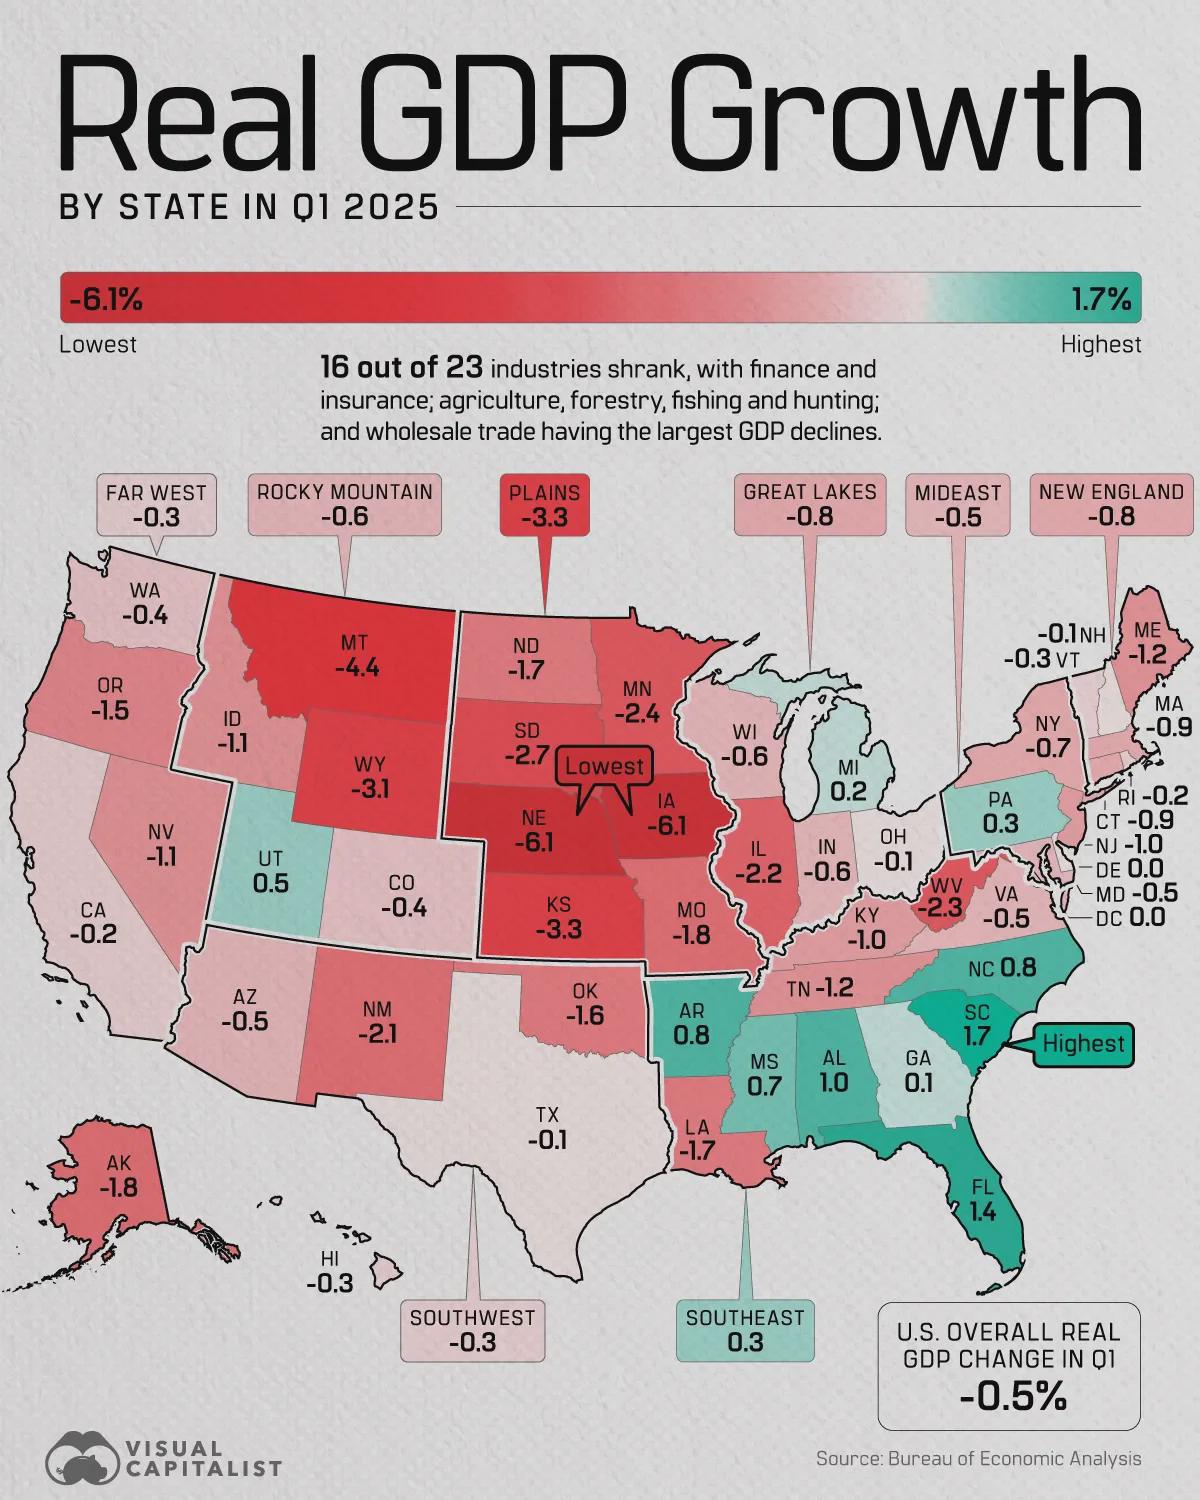
United States Real GDP Growth by State Map
The "United States Real GDP Growth by State in Q1 2025" map visually represents the economic performance of each state i...
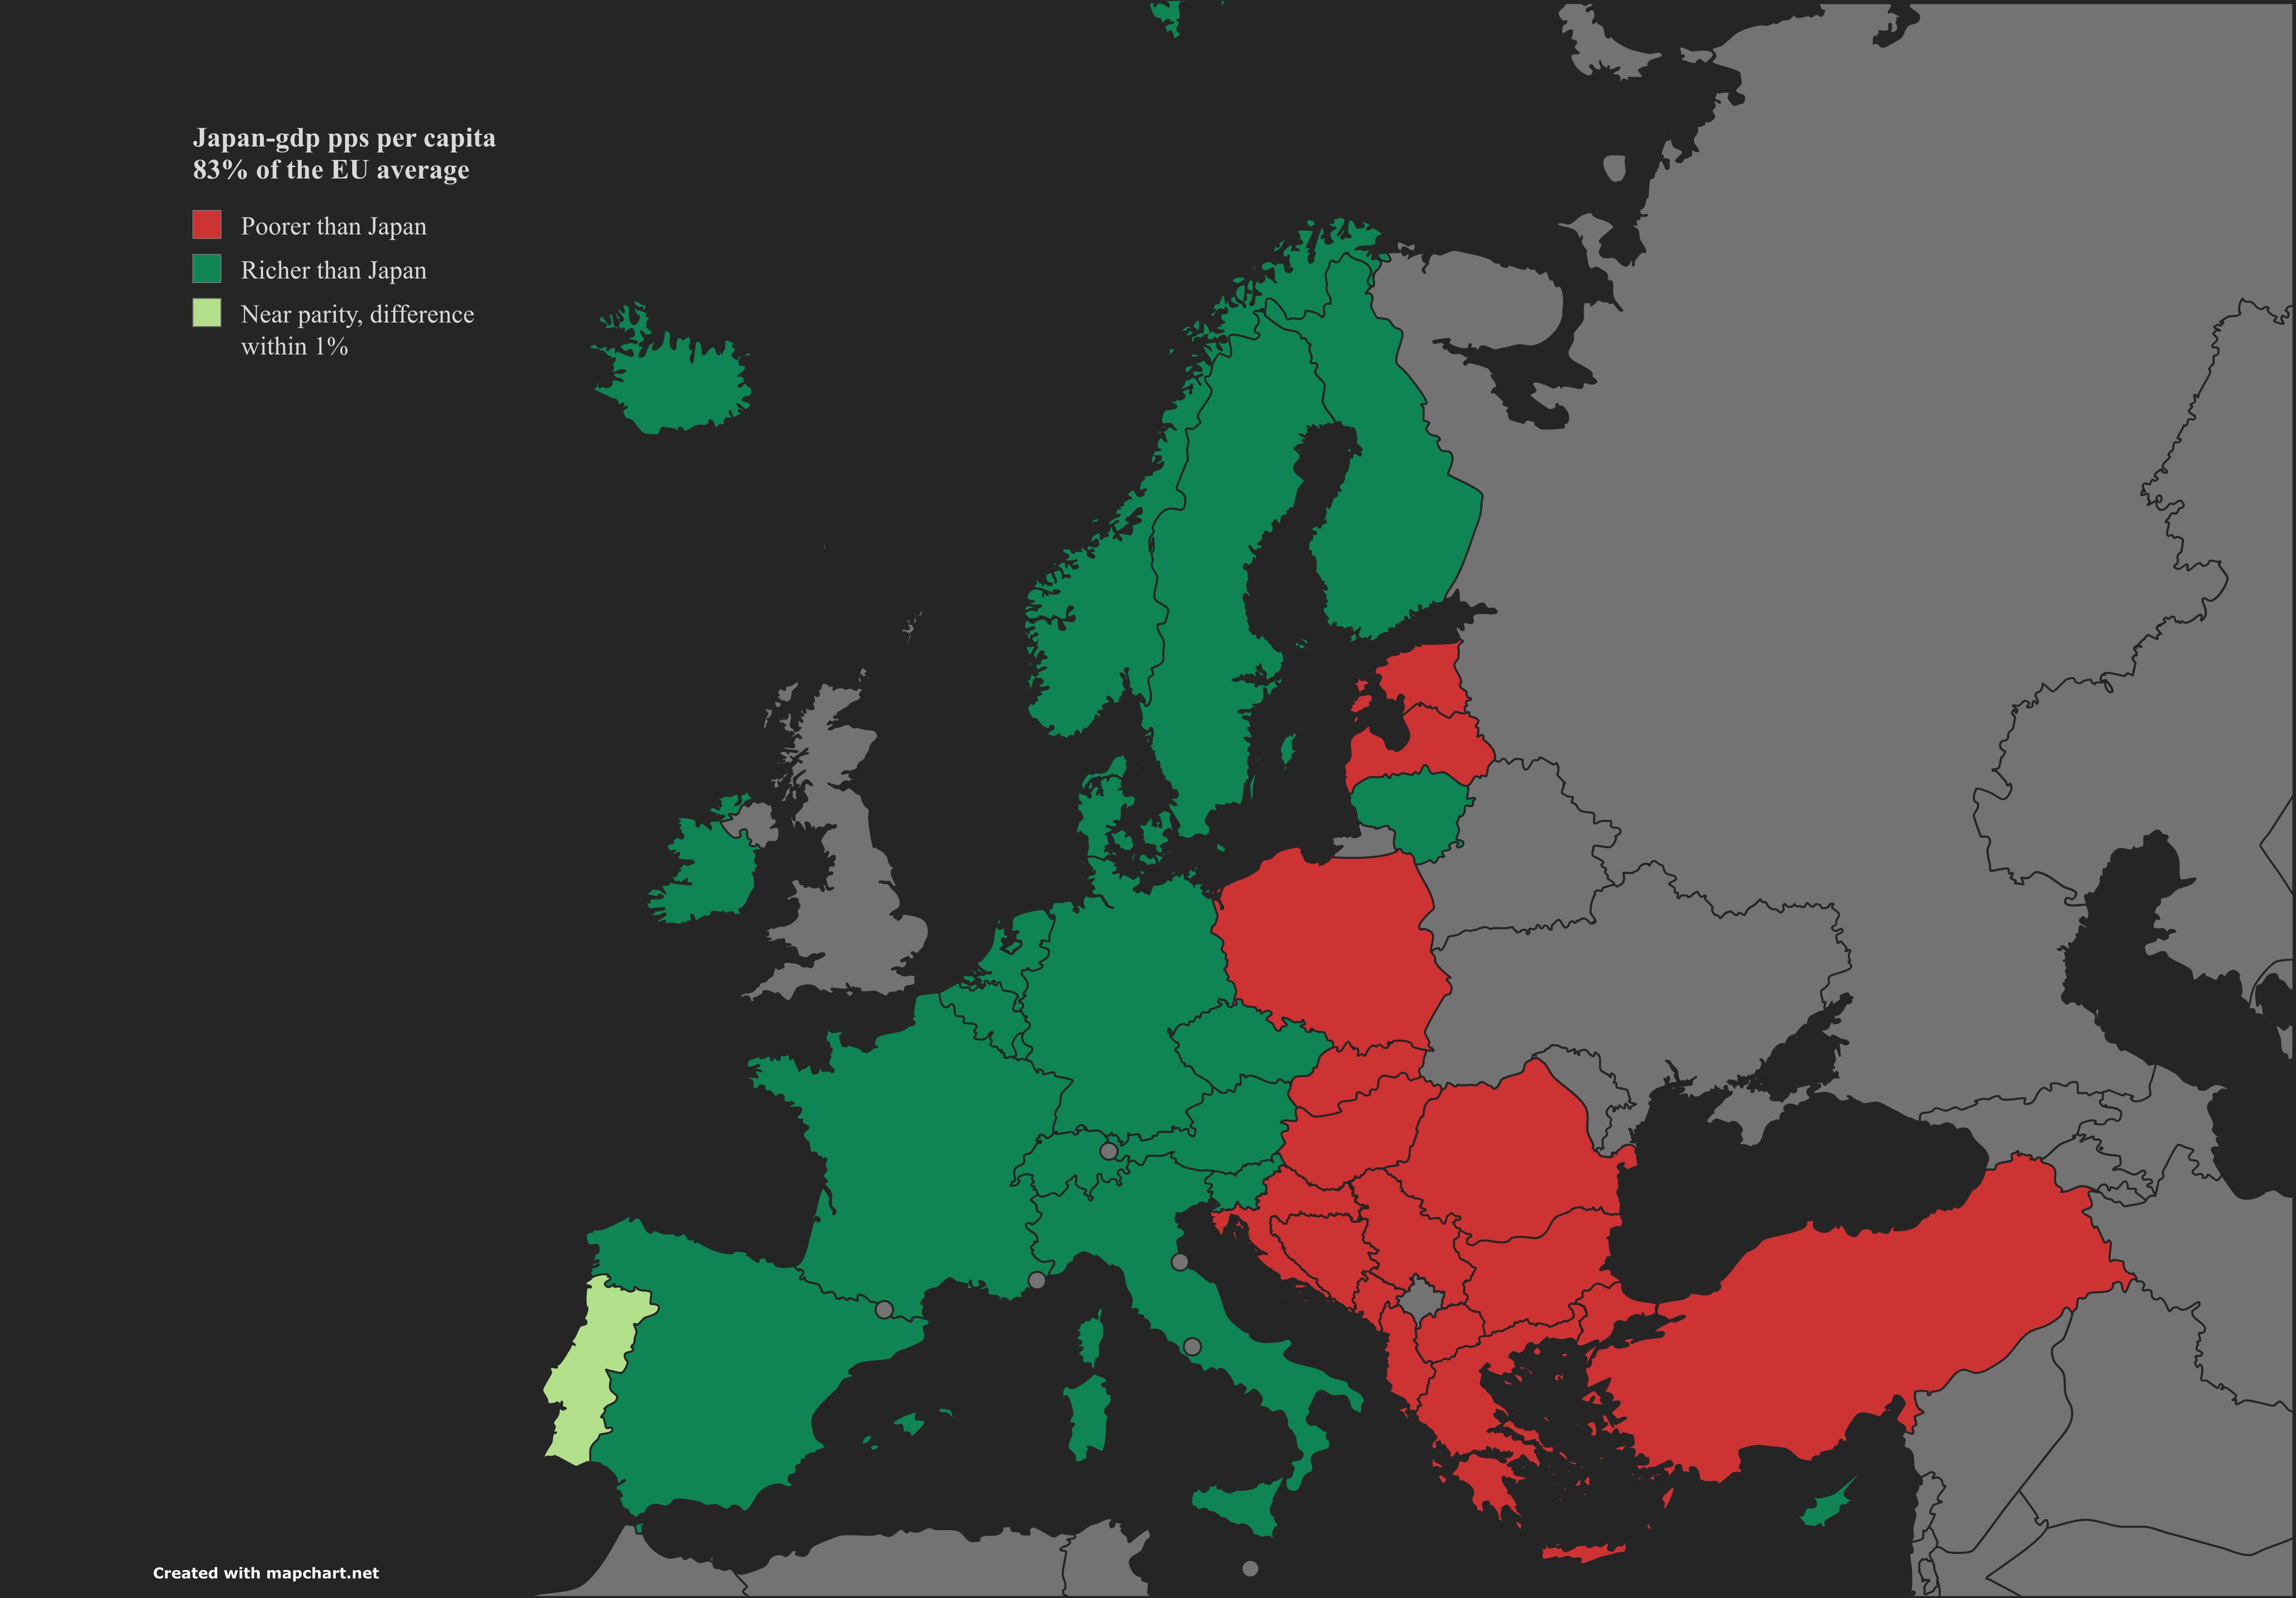
GDP PPS Per Capita Comparison Map: Japan and Europe
The visualization titled "Yen Meets Euro" presents a detailed comparison of Japan's GDP per capita in purchasing power s...
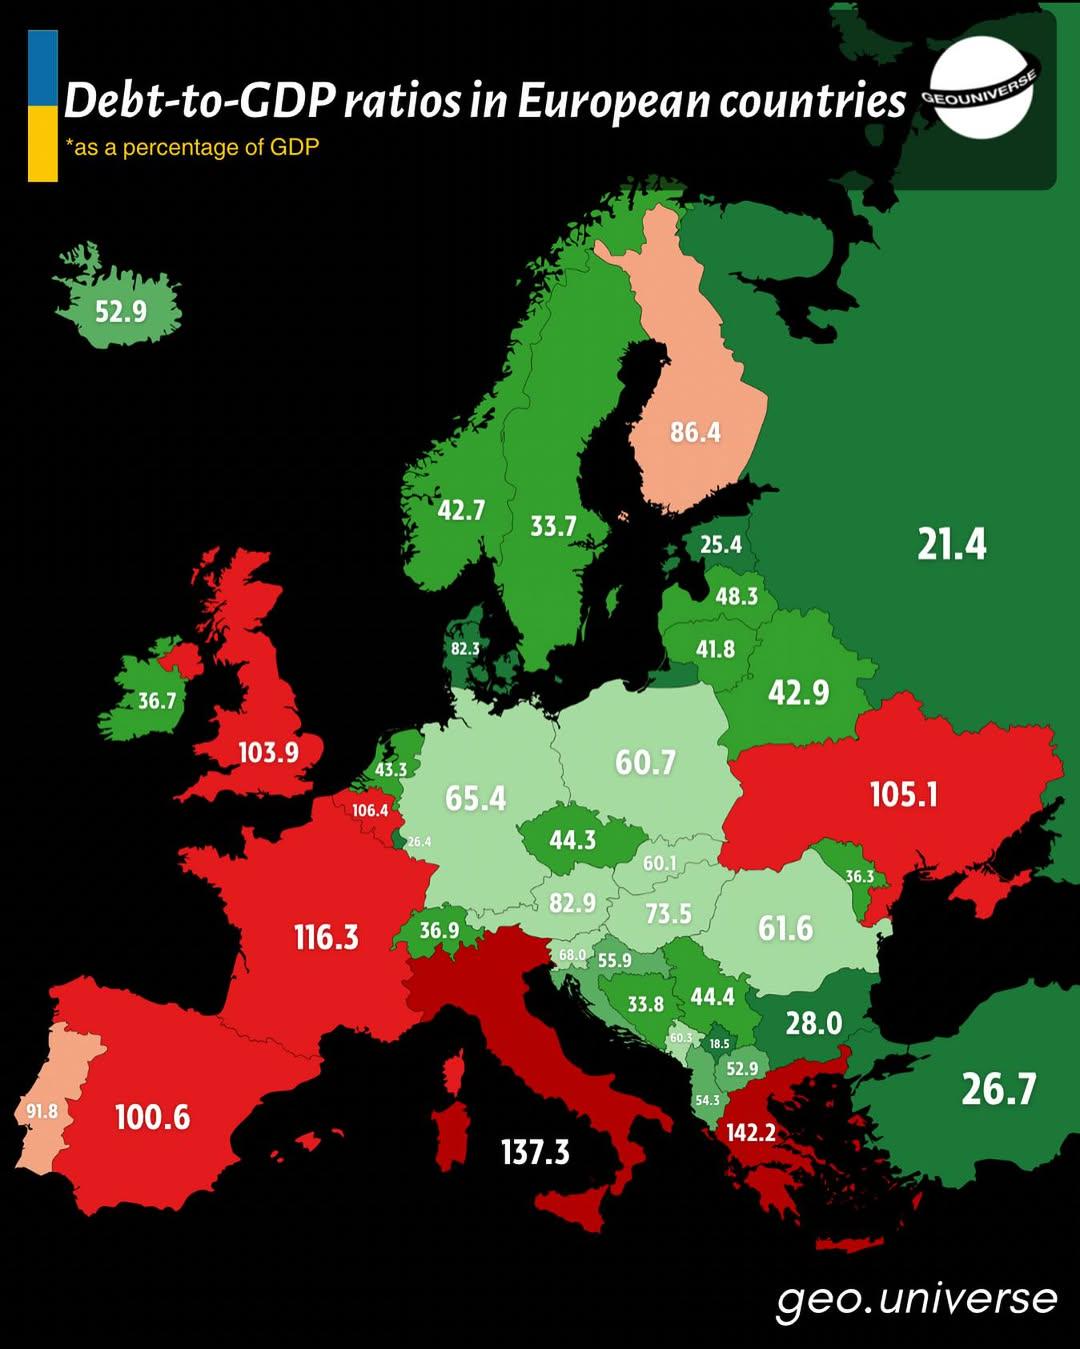
Debt-to-GDP Ratios in Europe Map
The "Debt-to-GDP Ratios in Europe (2025)" map provides a comprehensive overview of the economic health of European natio...
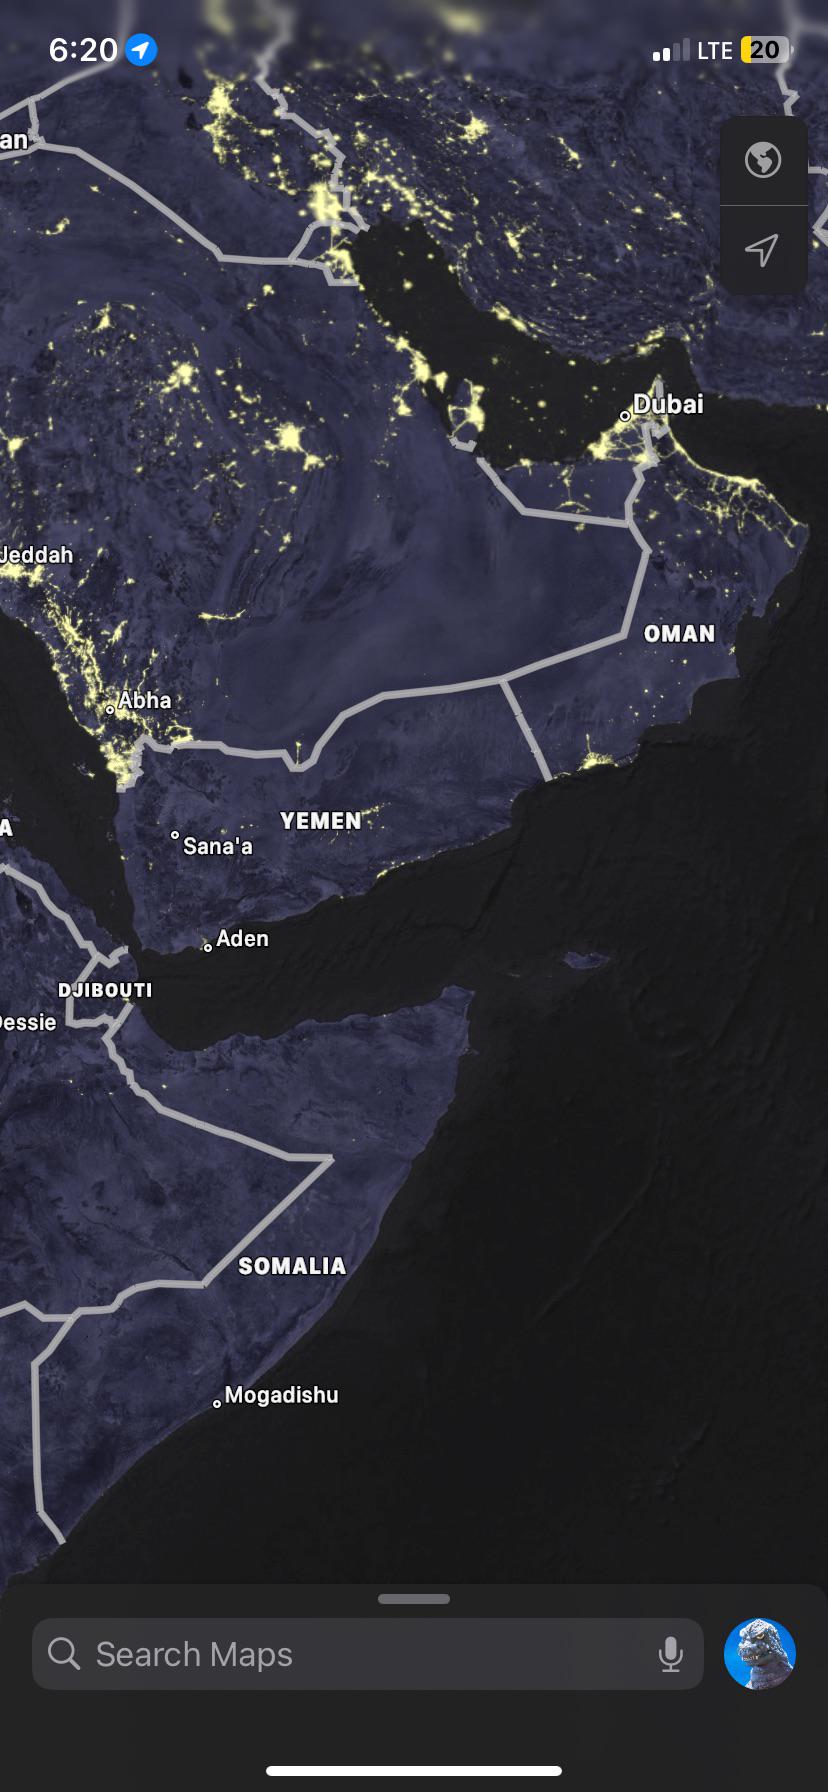
GDP and Population Comparison Map of Oman and Yemen
The visualization titled "Oman 100 Billion Dollar GDP and 5 Million Population vs Yemen 20 Billion GDP and 35 Million Po...
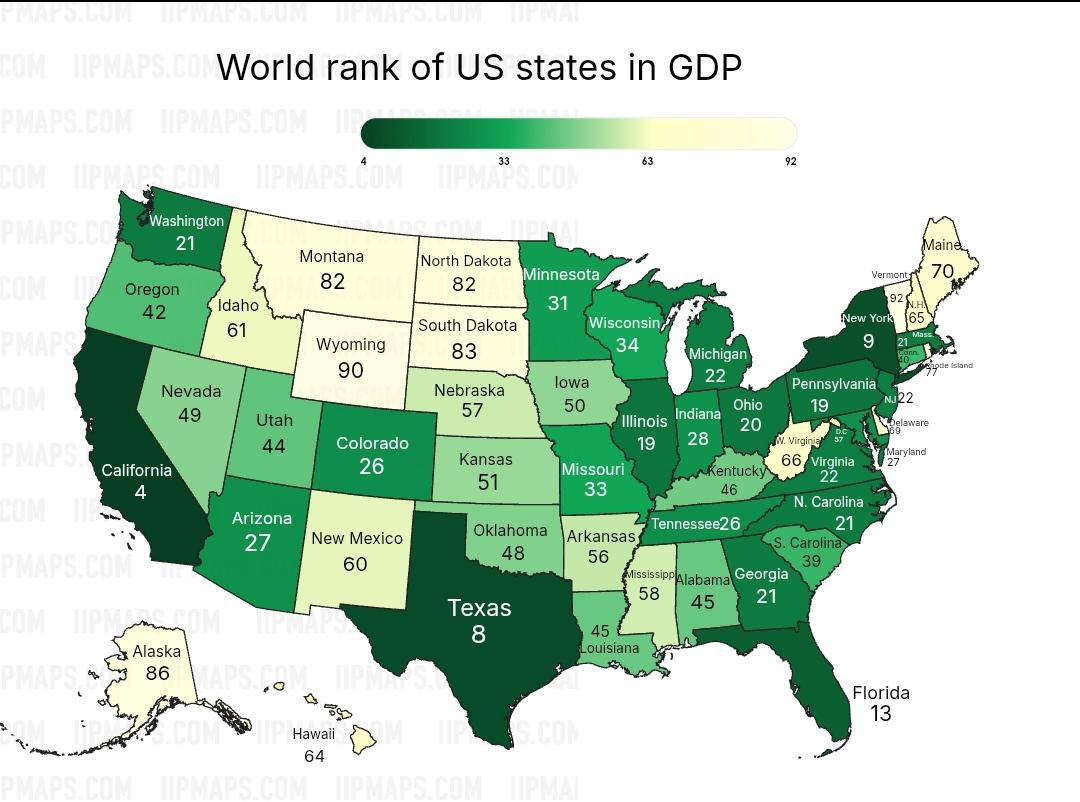
GDP Ranking Map of US States
The GDP Ranking Map of US States visually represents the economic output of each state, showcasing their Gross Domestic ...
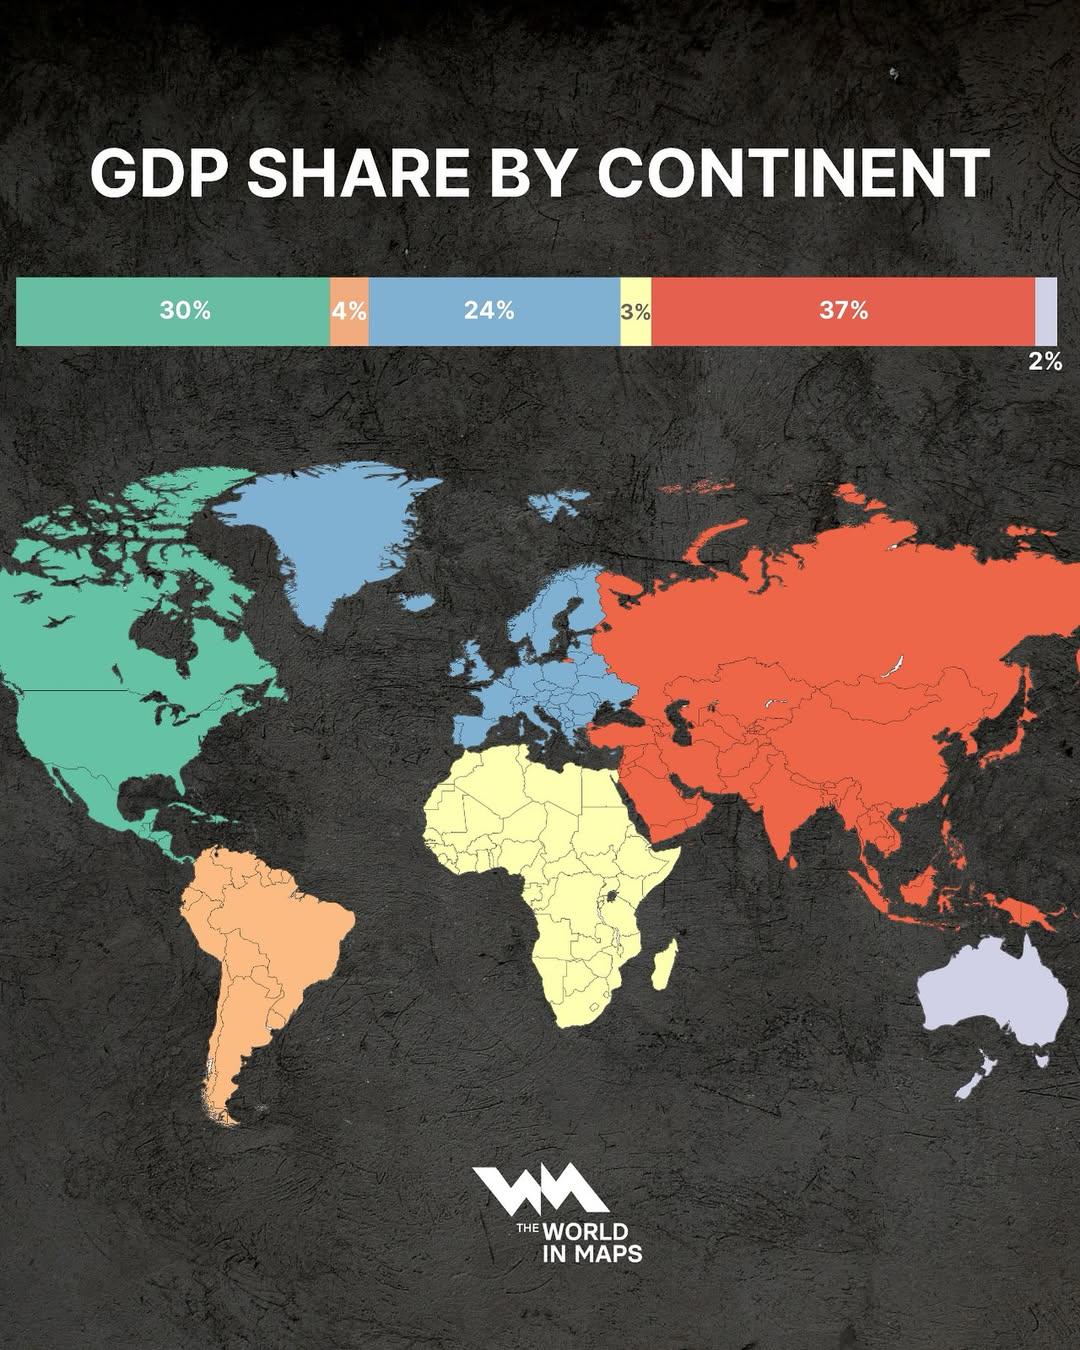
GDP Share by Continent Map
The "GDP Share by Continent Map" provides a clear visual representation of the economic output of different continents a...
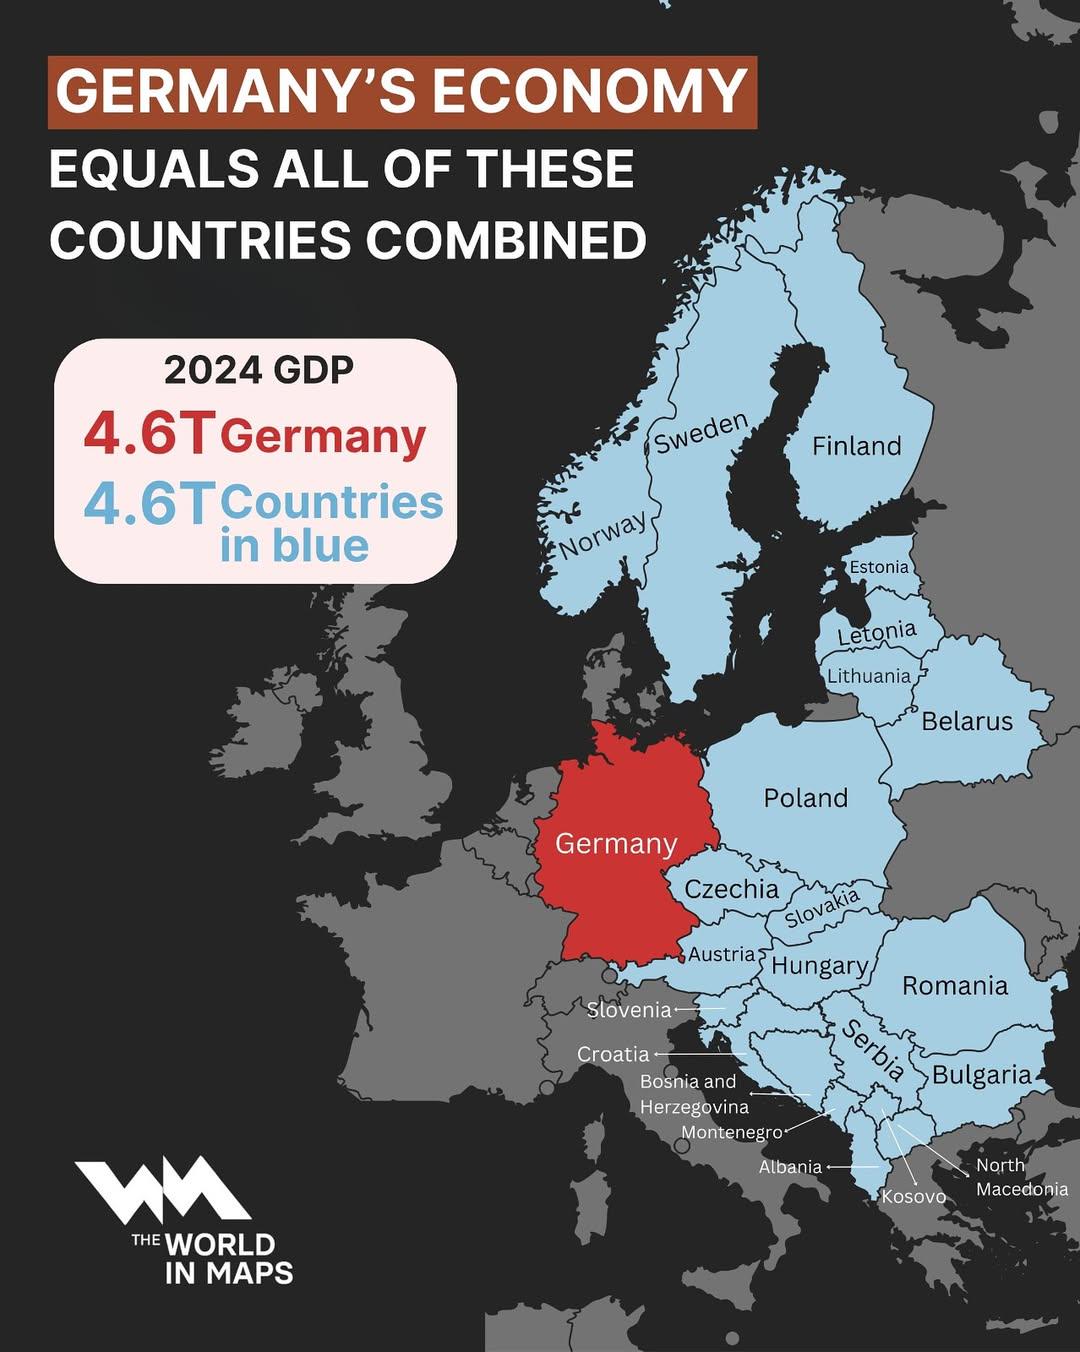
Germany's Economy Compared to Other Countries Map
This map visualizes the total economic output of Germany, showcasing how it compares to the combined economies of severa...
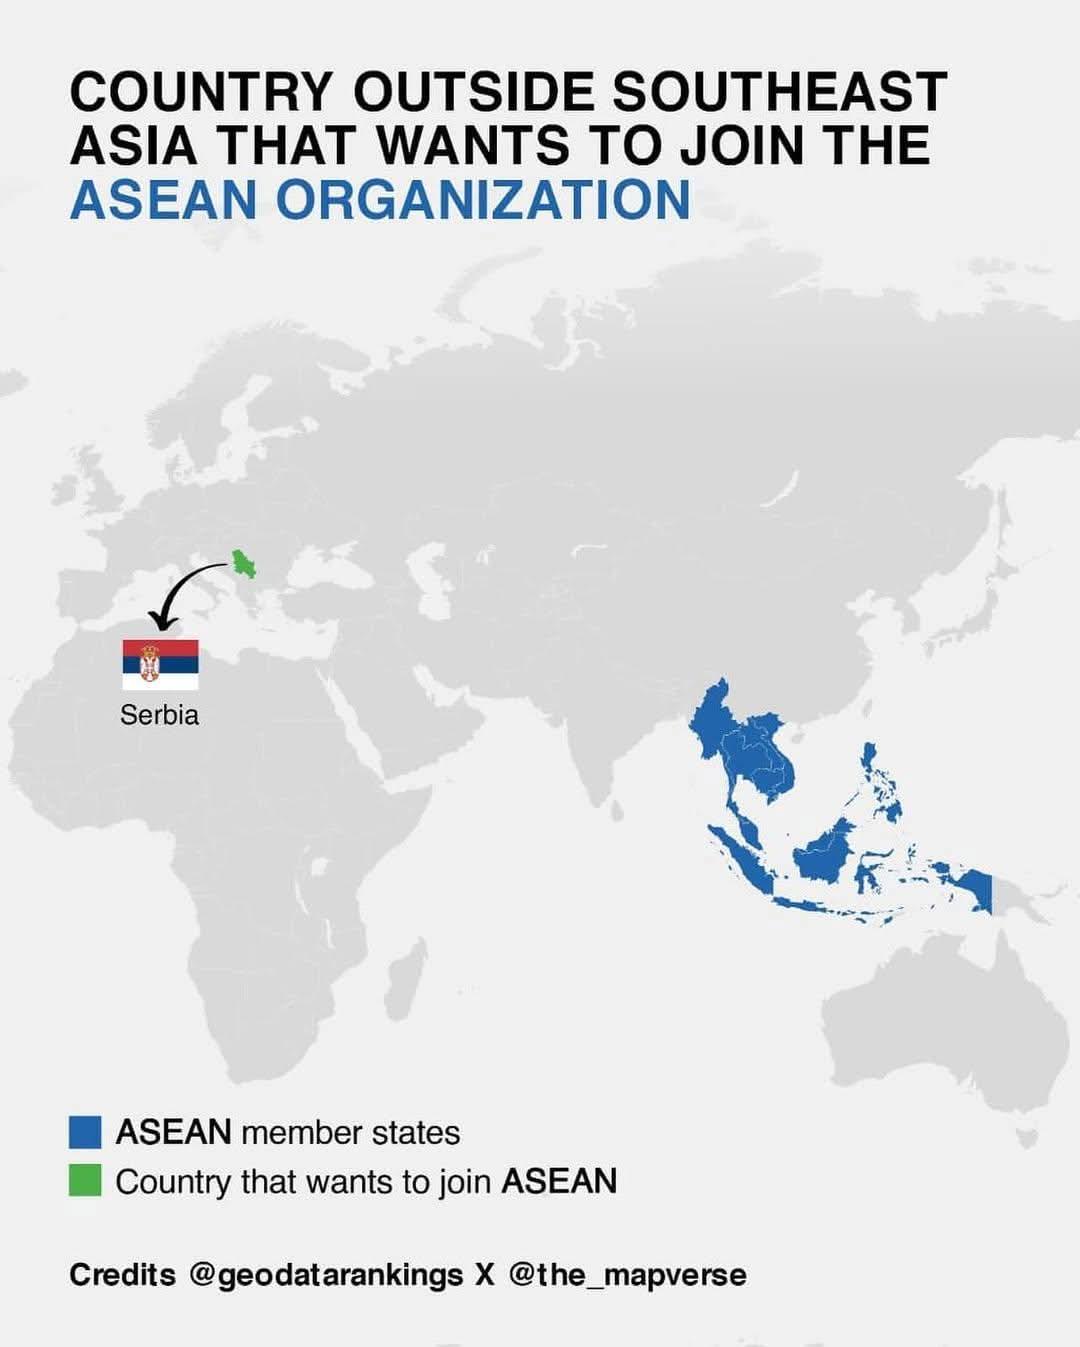
Economic Challenges Map of Serbia
This visualization highlights key economic challenges facing Serbia, illustrating various socio-economic indicators acro...
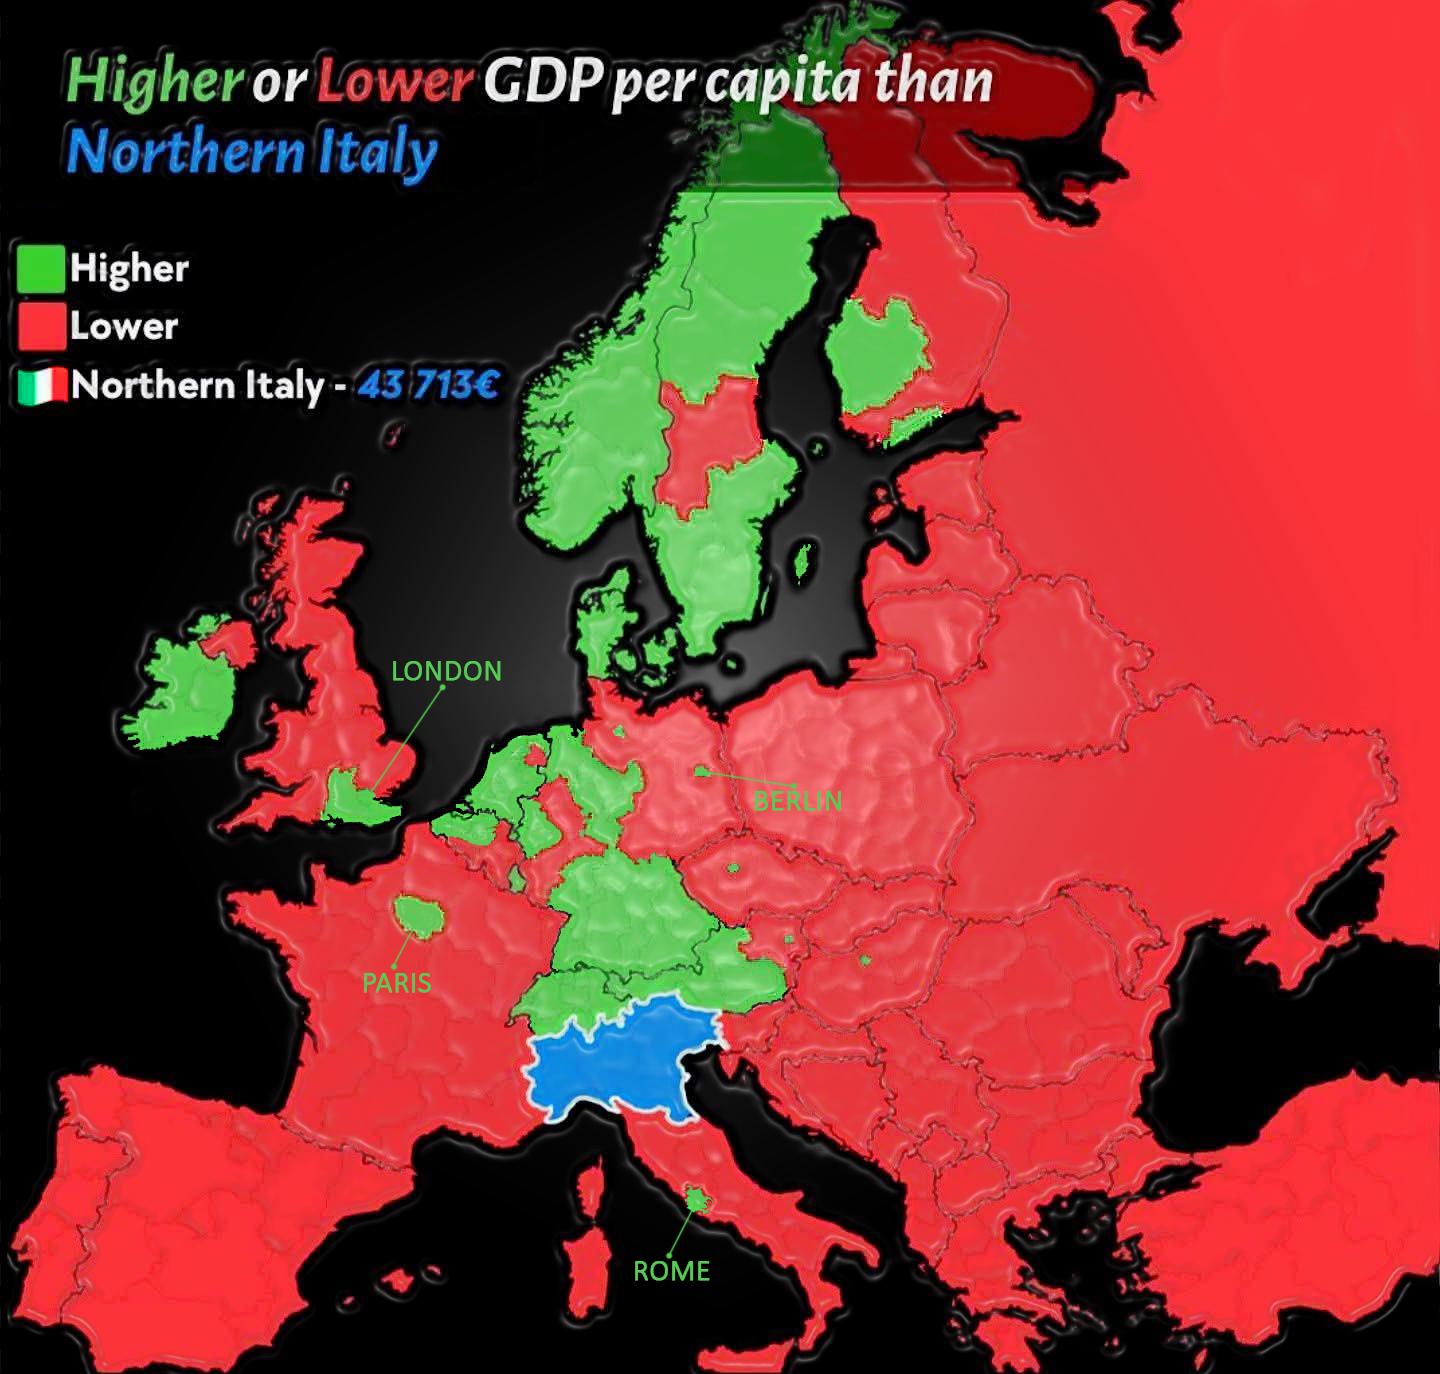
GDP Per Capita Map of Northern Italy vs Europe
The visualization titled "GDP Per Capita of Northern Italy vs GDP Per Capita of the rest of Europe" provides a compellin...
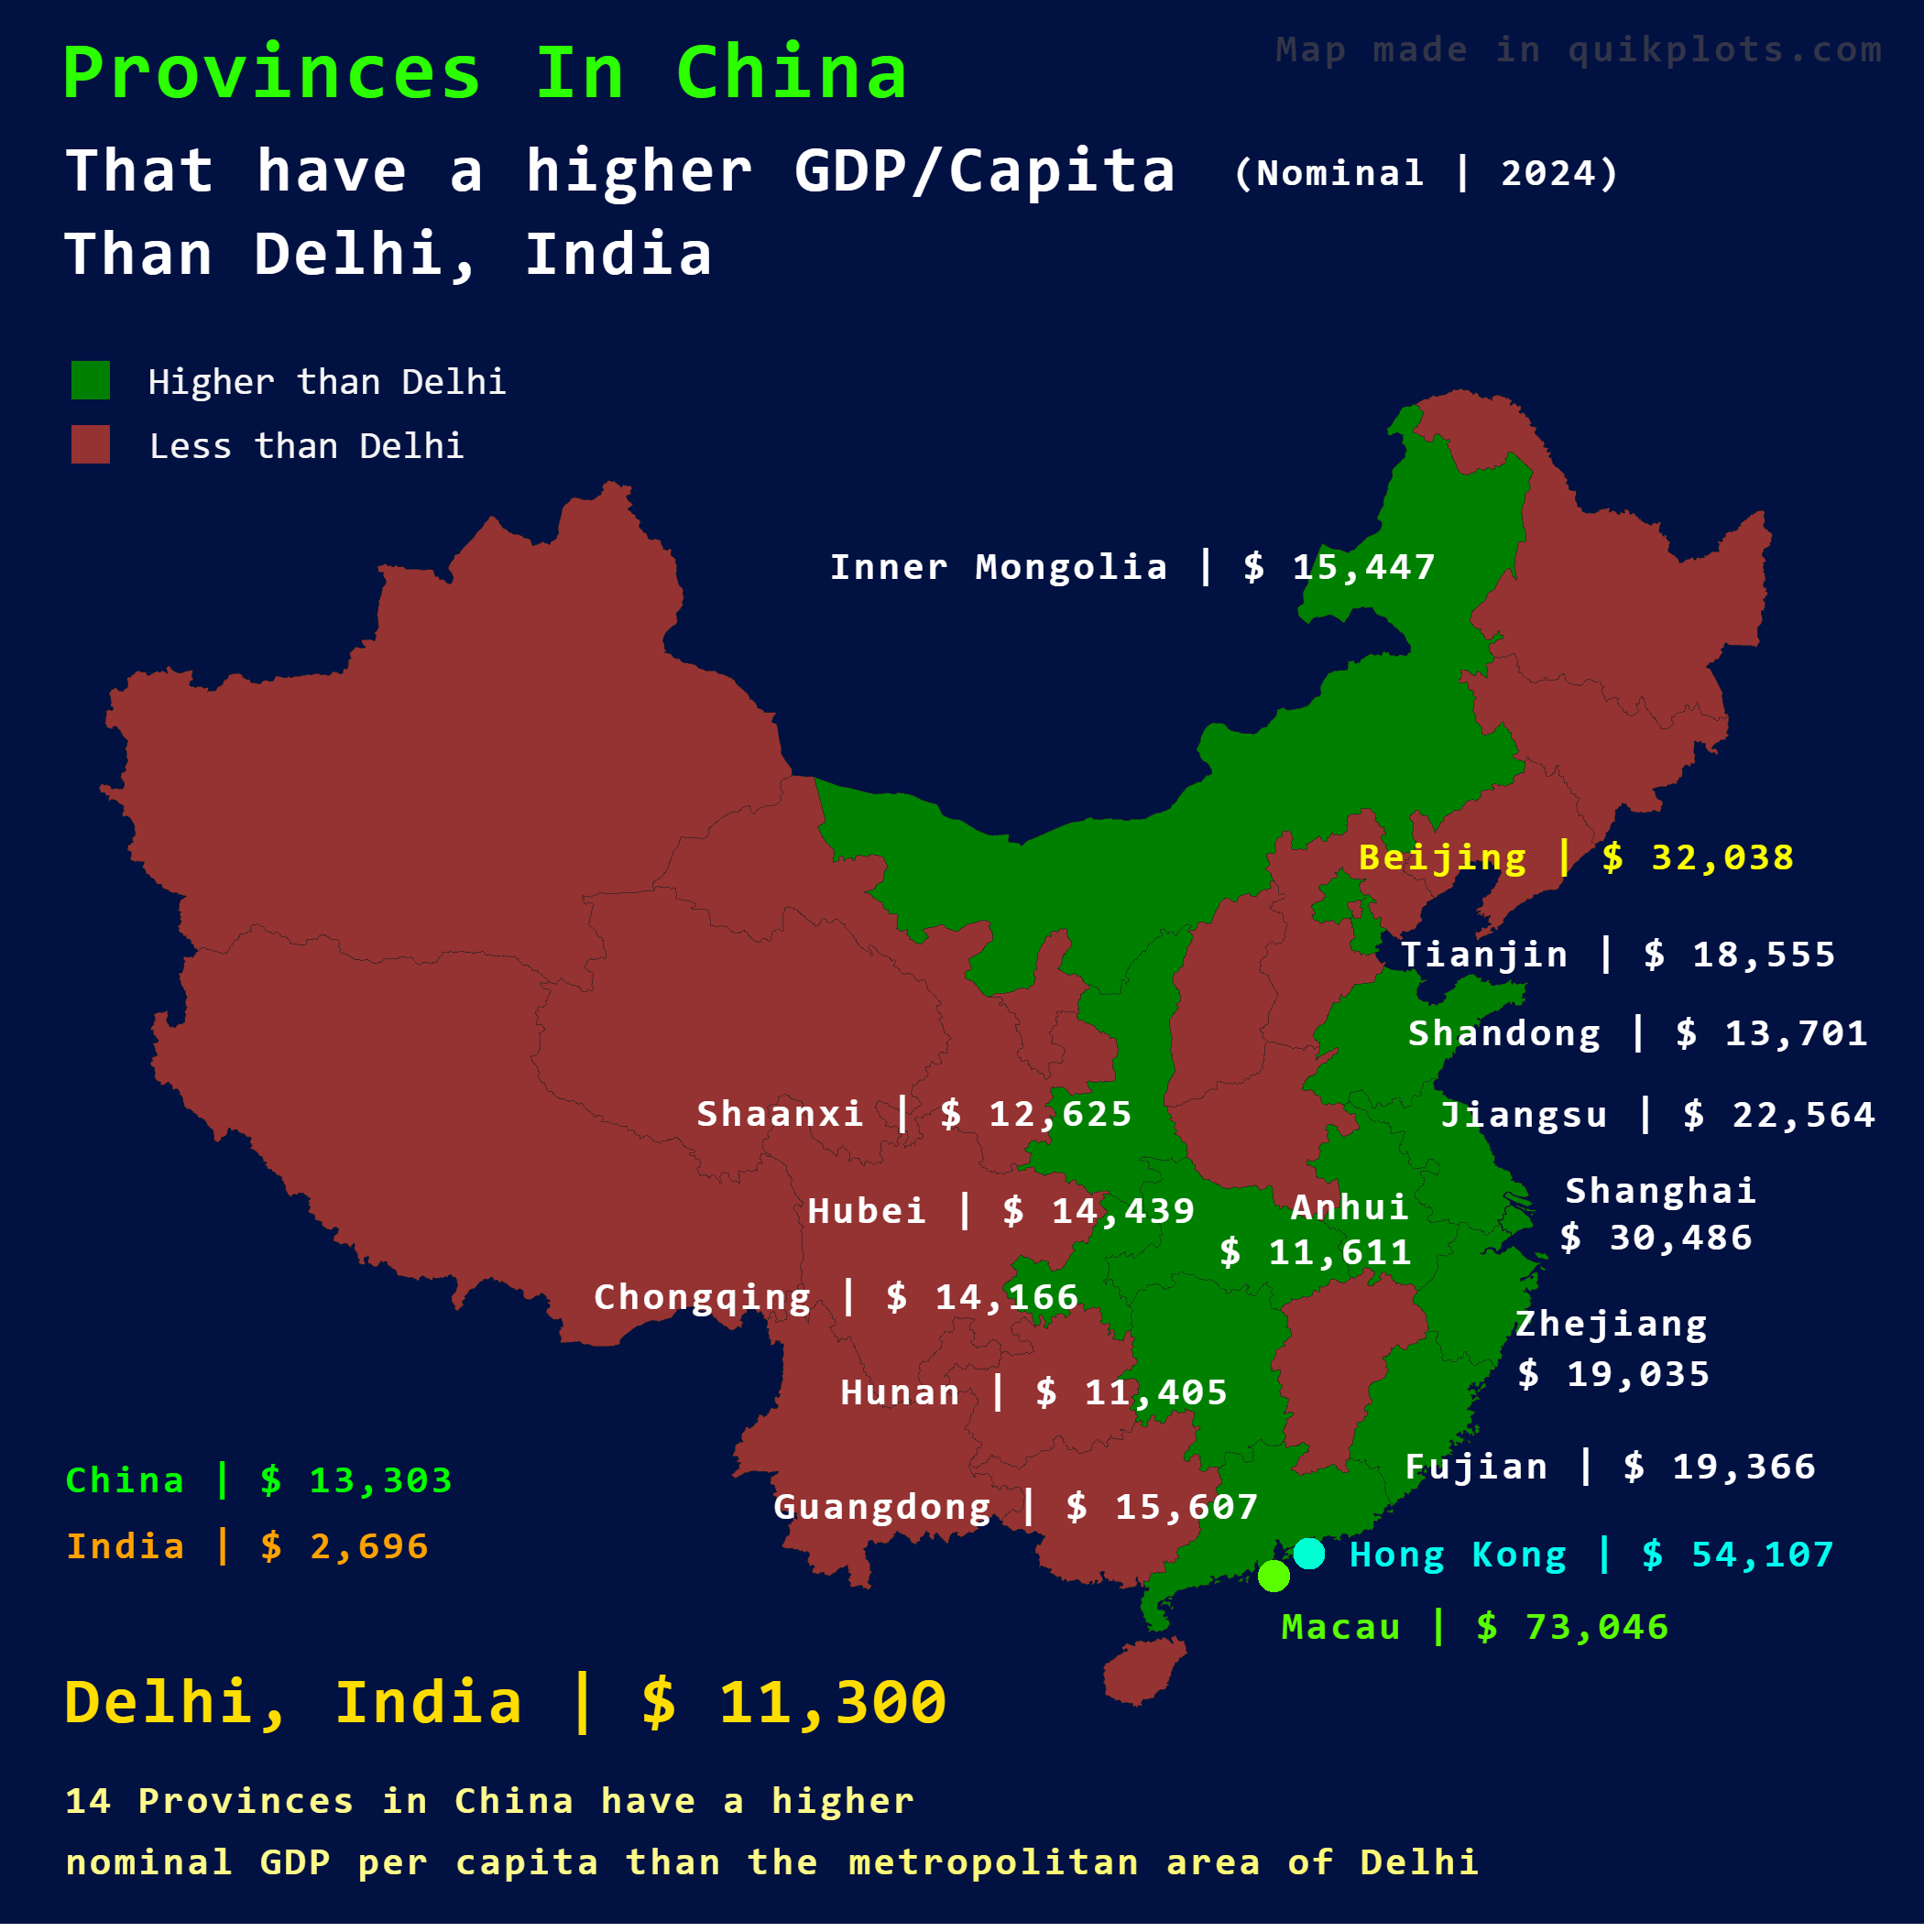
Map of Chinese Provinces with Higher GDP Per Capita than Delhi
This map illustrates which provinces in China have a higher nominal GDP per capita compared to Delhi, India. By placing ...
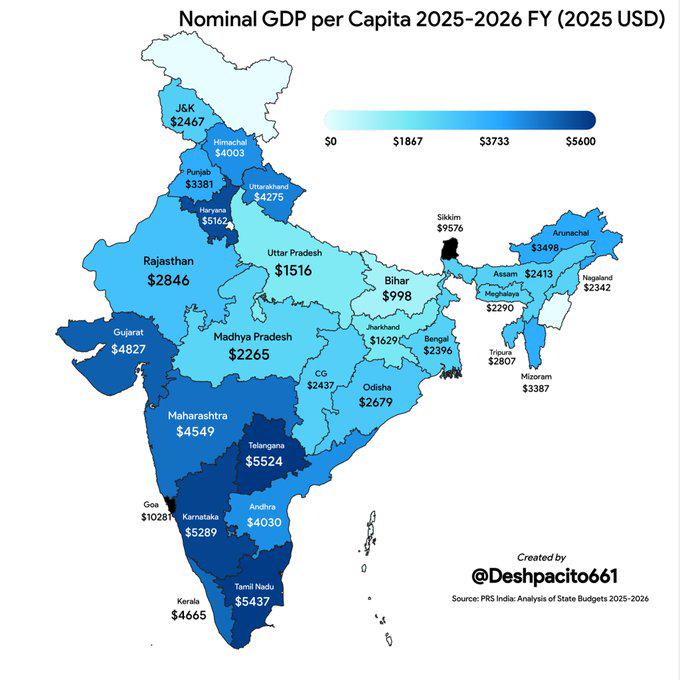
India Nominal GDP per Capita by State Map
The visualization titled "India Nominal GDP per Capita for States 2025-2026 FY (2025 USD)" presents a detailed overview ...
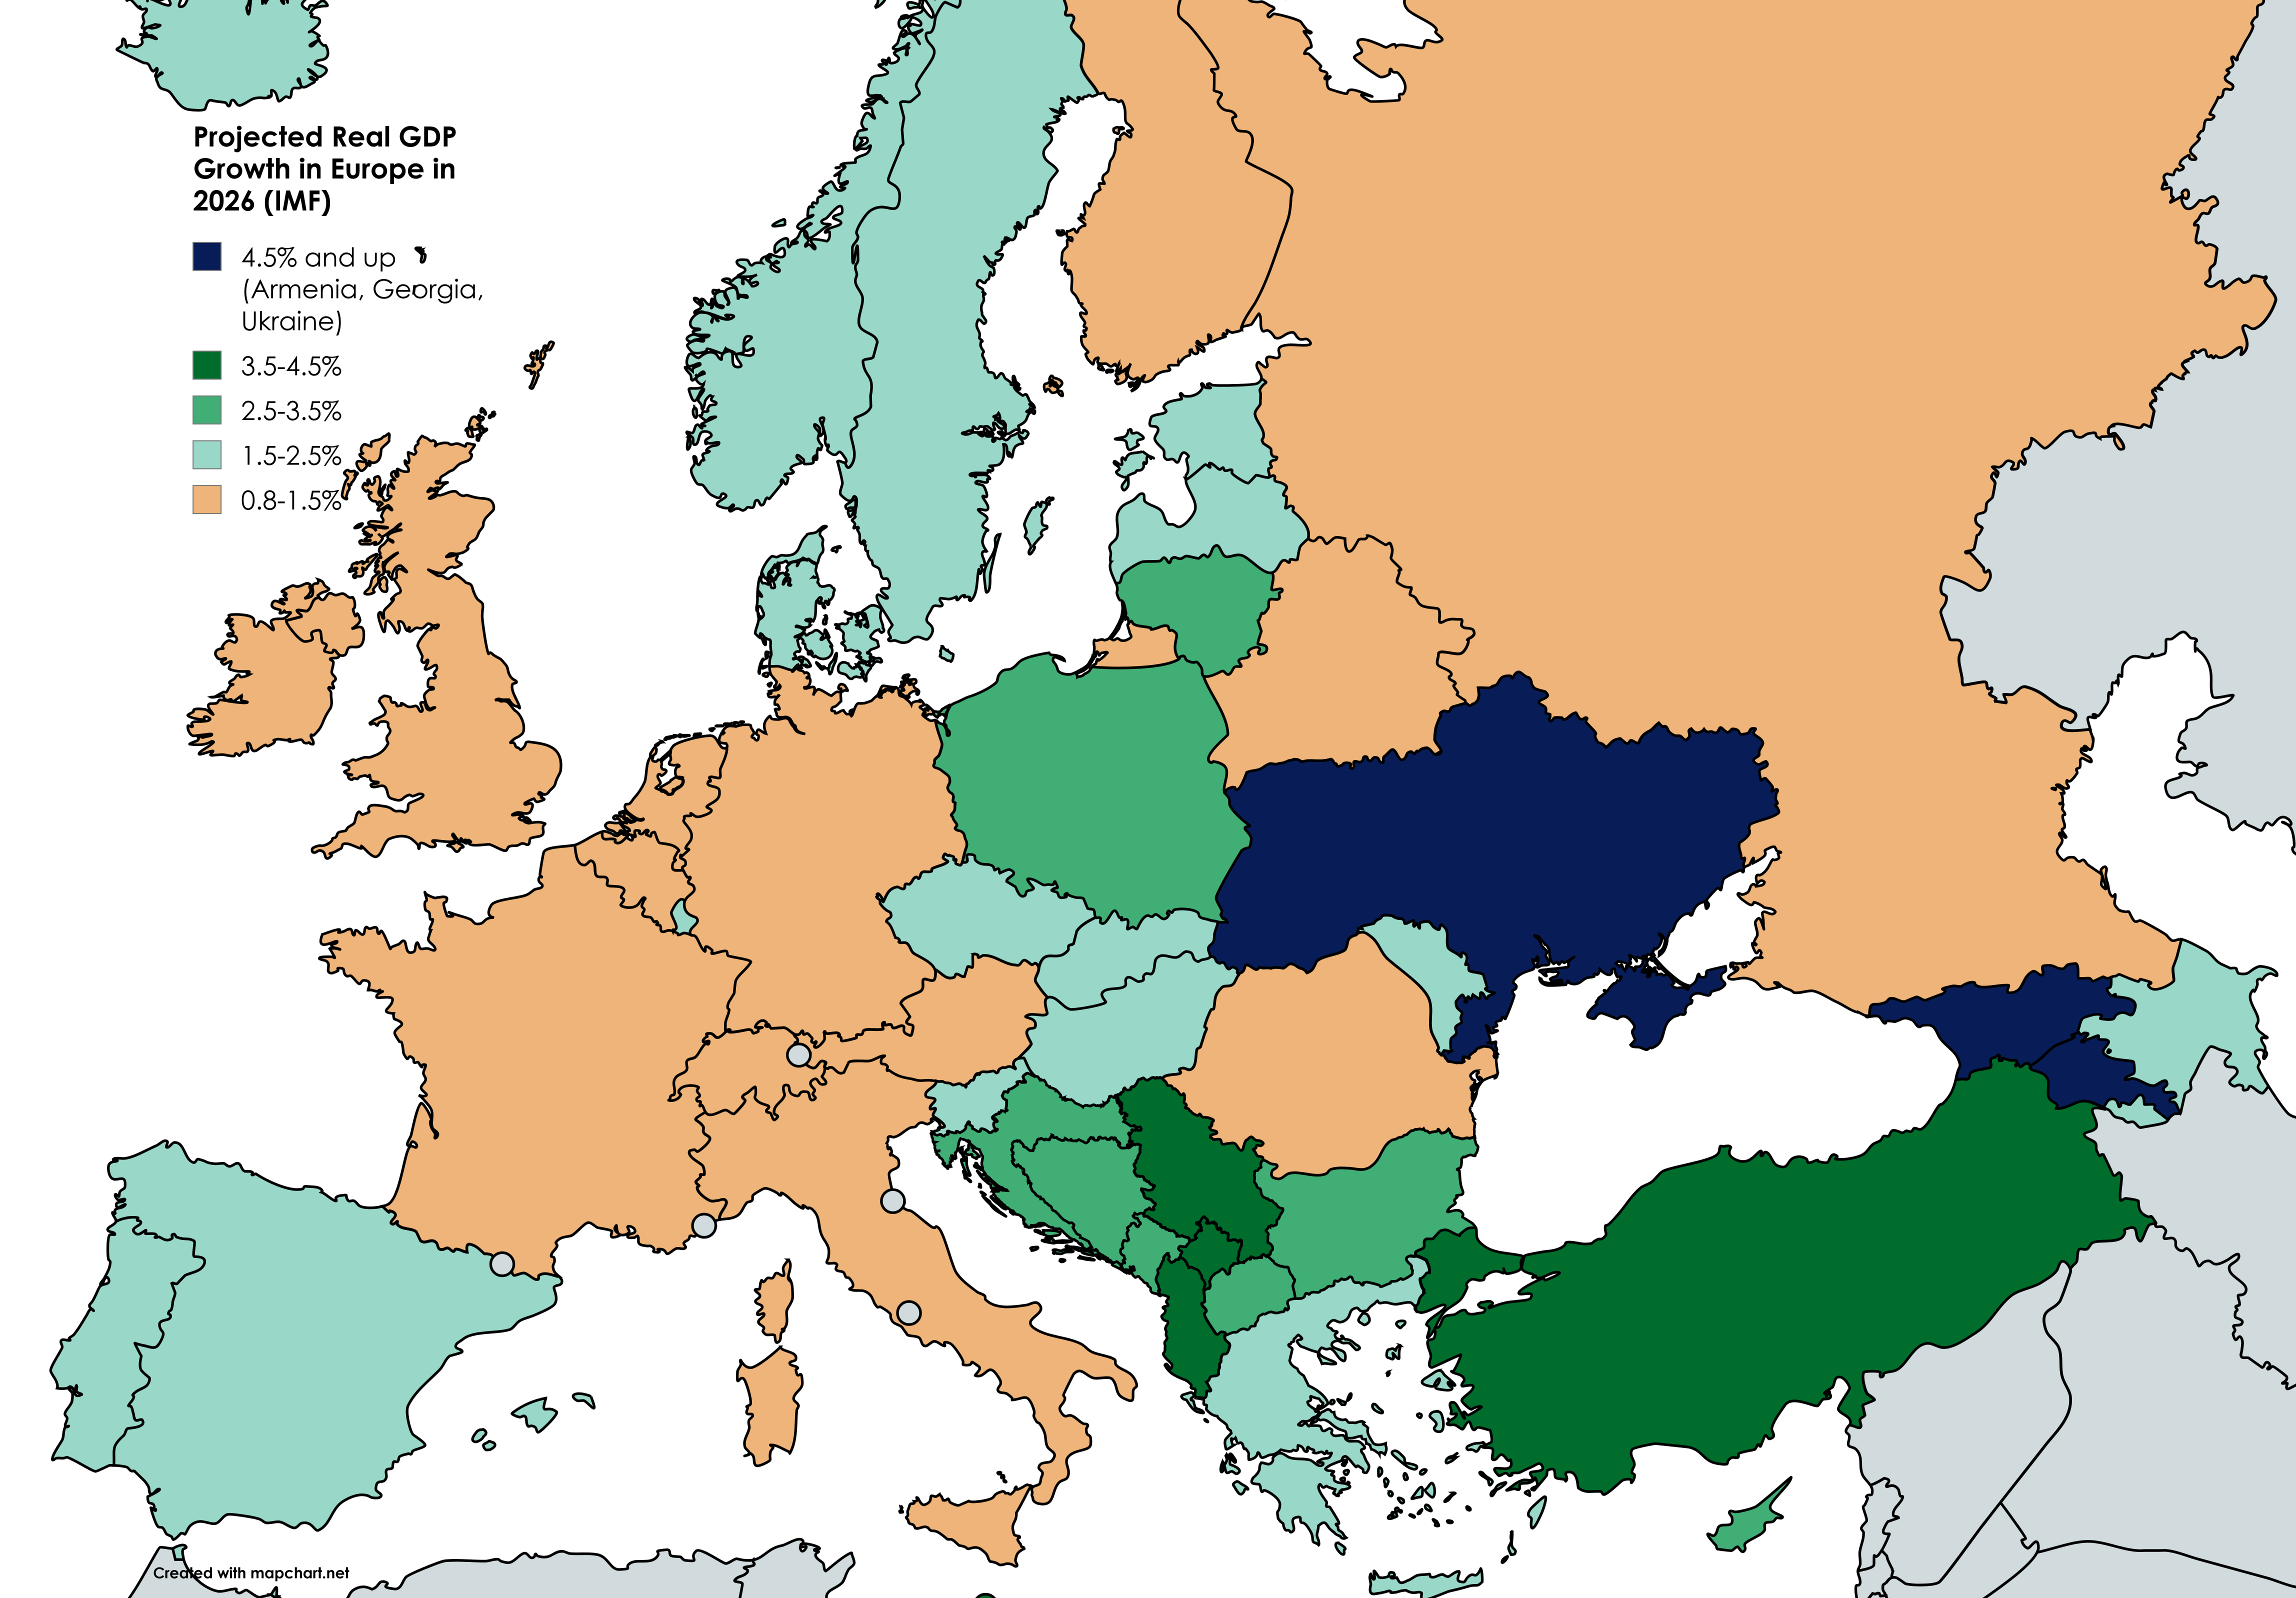
Projected Real GDP Growth Map in Europe 2026
The visualization "Projected Real GDP Growth in Europe in 2026" showcases the anticipated economic growth rates across v...
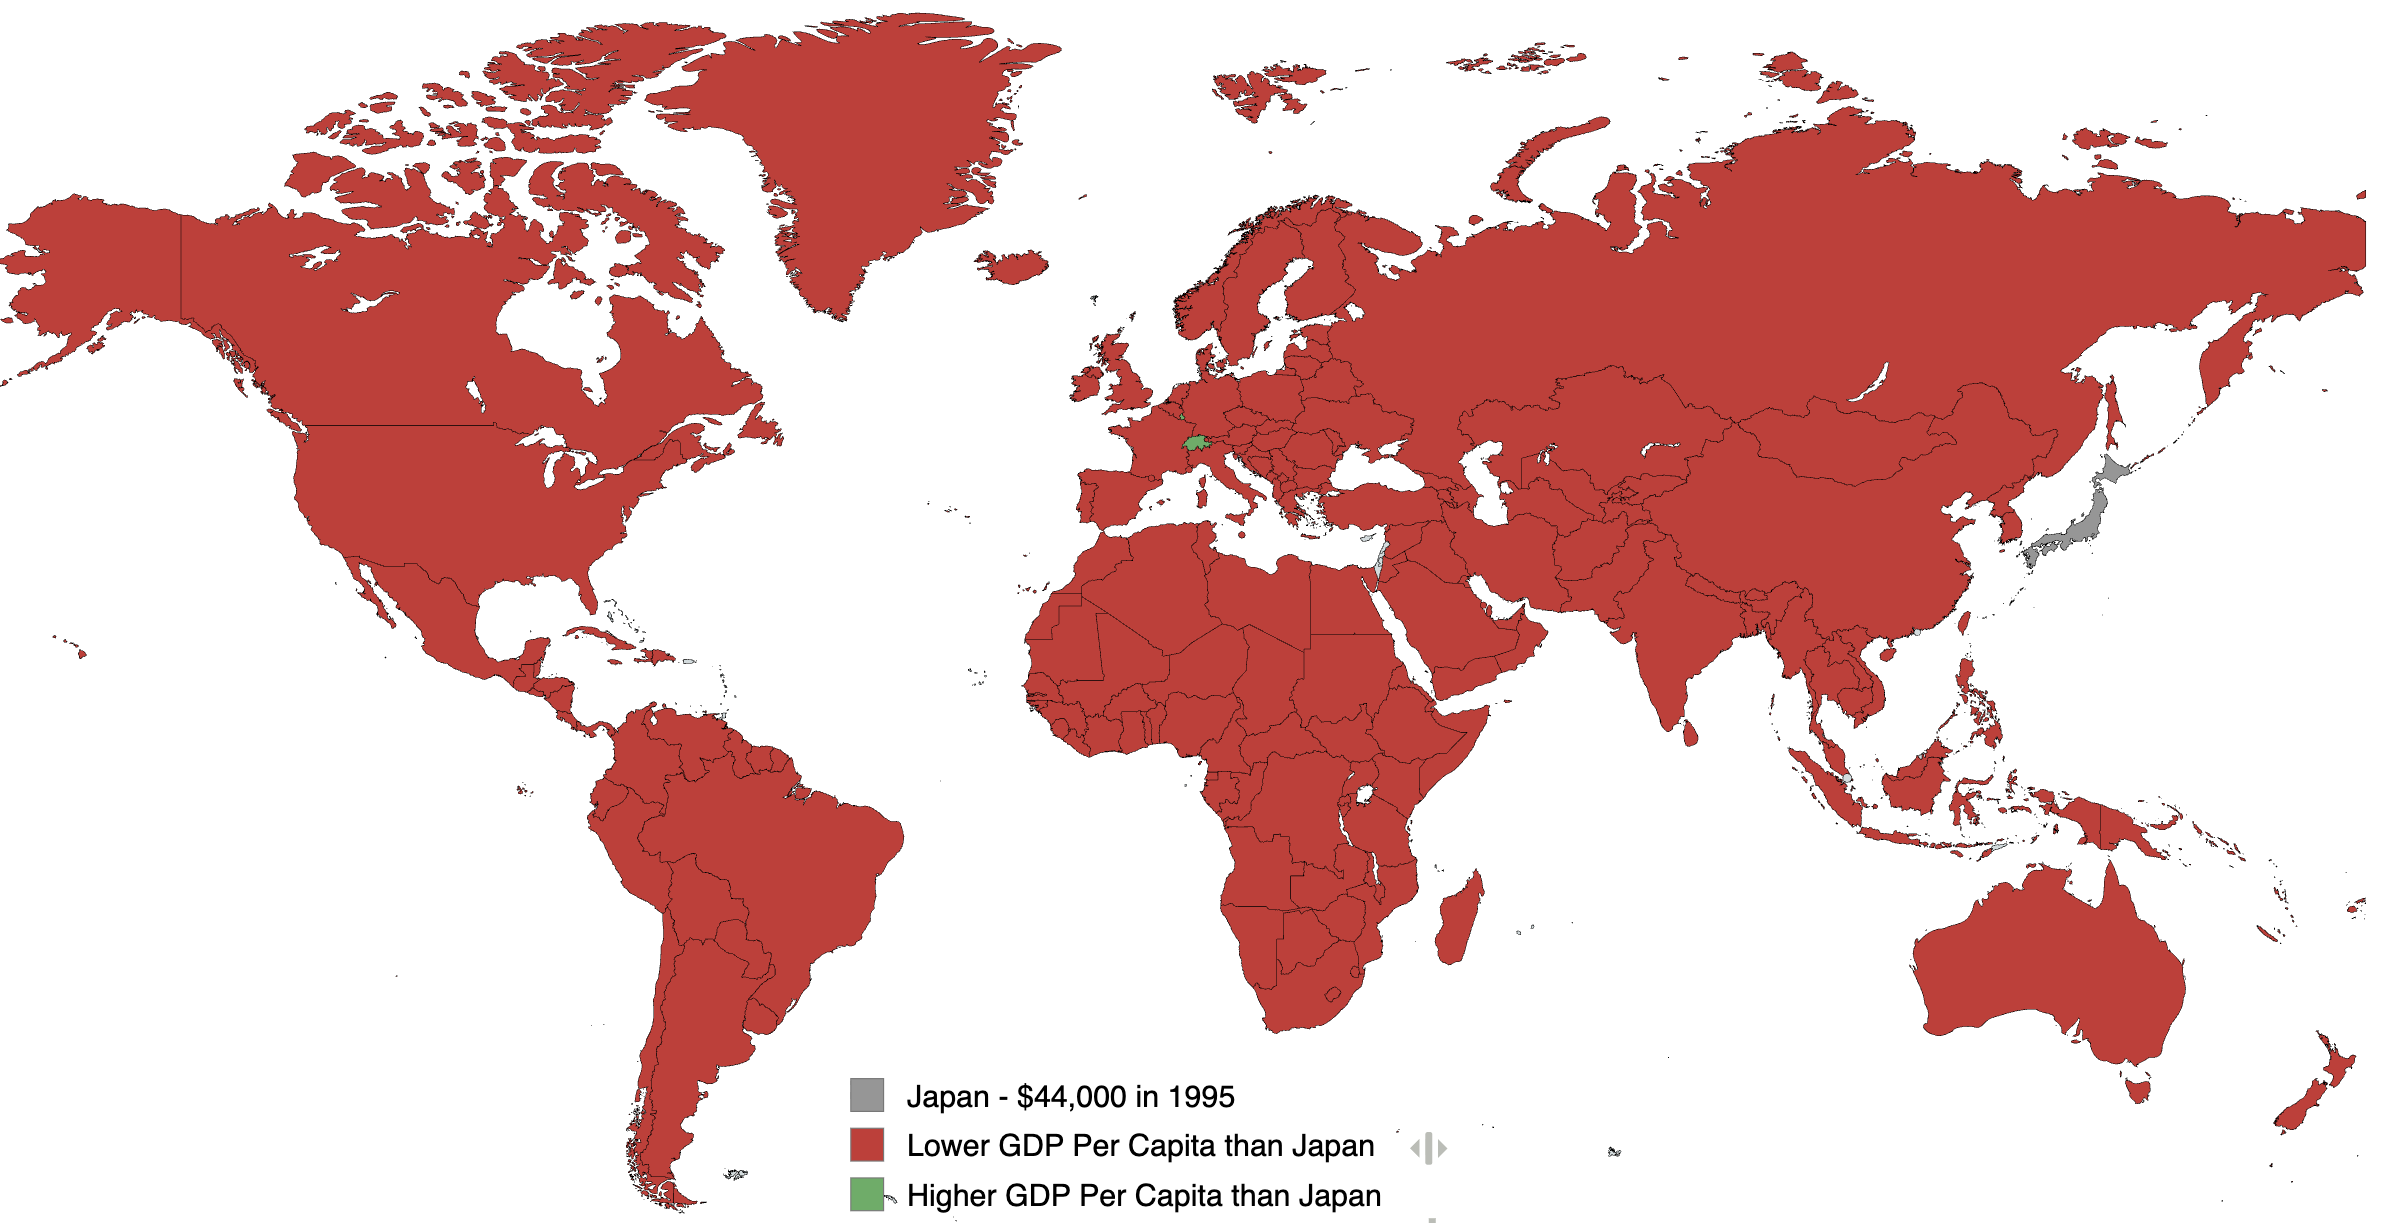
GDP Per Capita Map of Japan 1995
This visualization illustrates the GDP per capita of various countries in the year 1995, with Japan's GDP per capita peg...
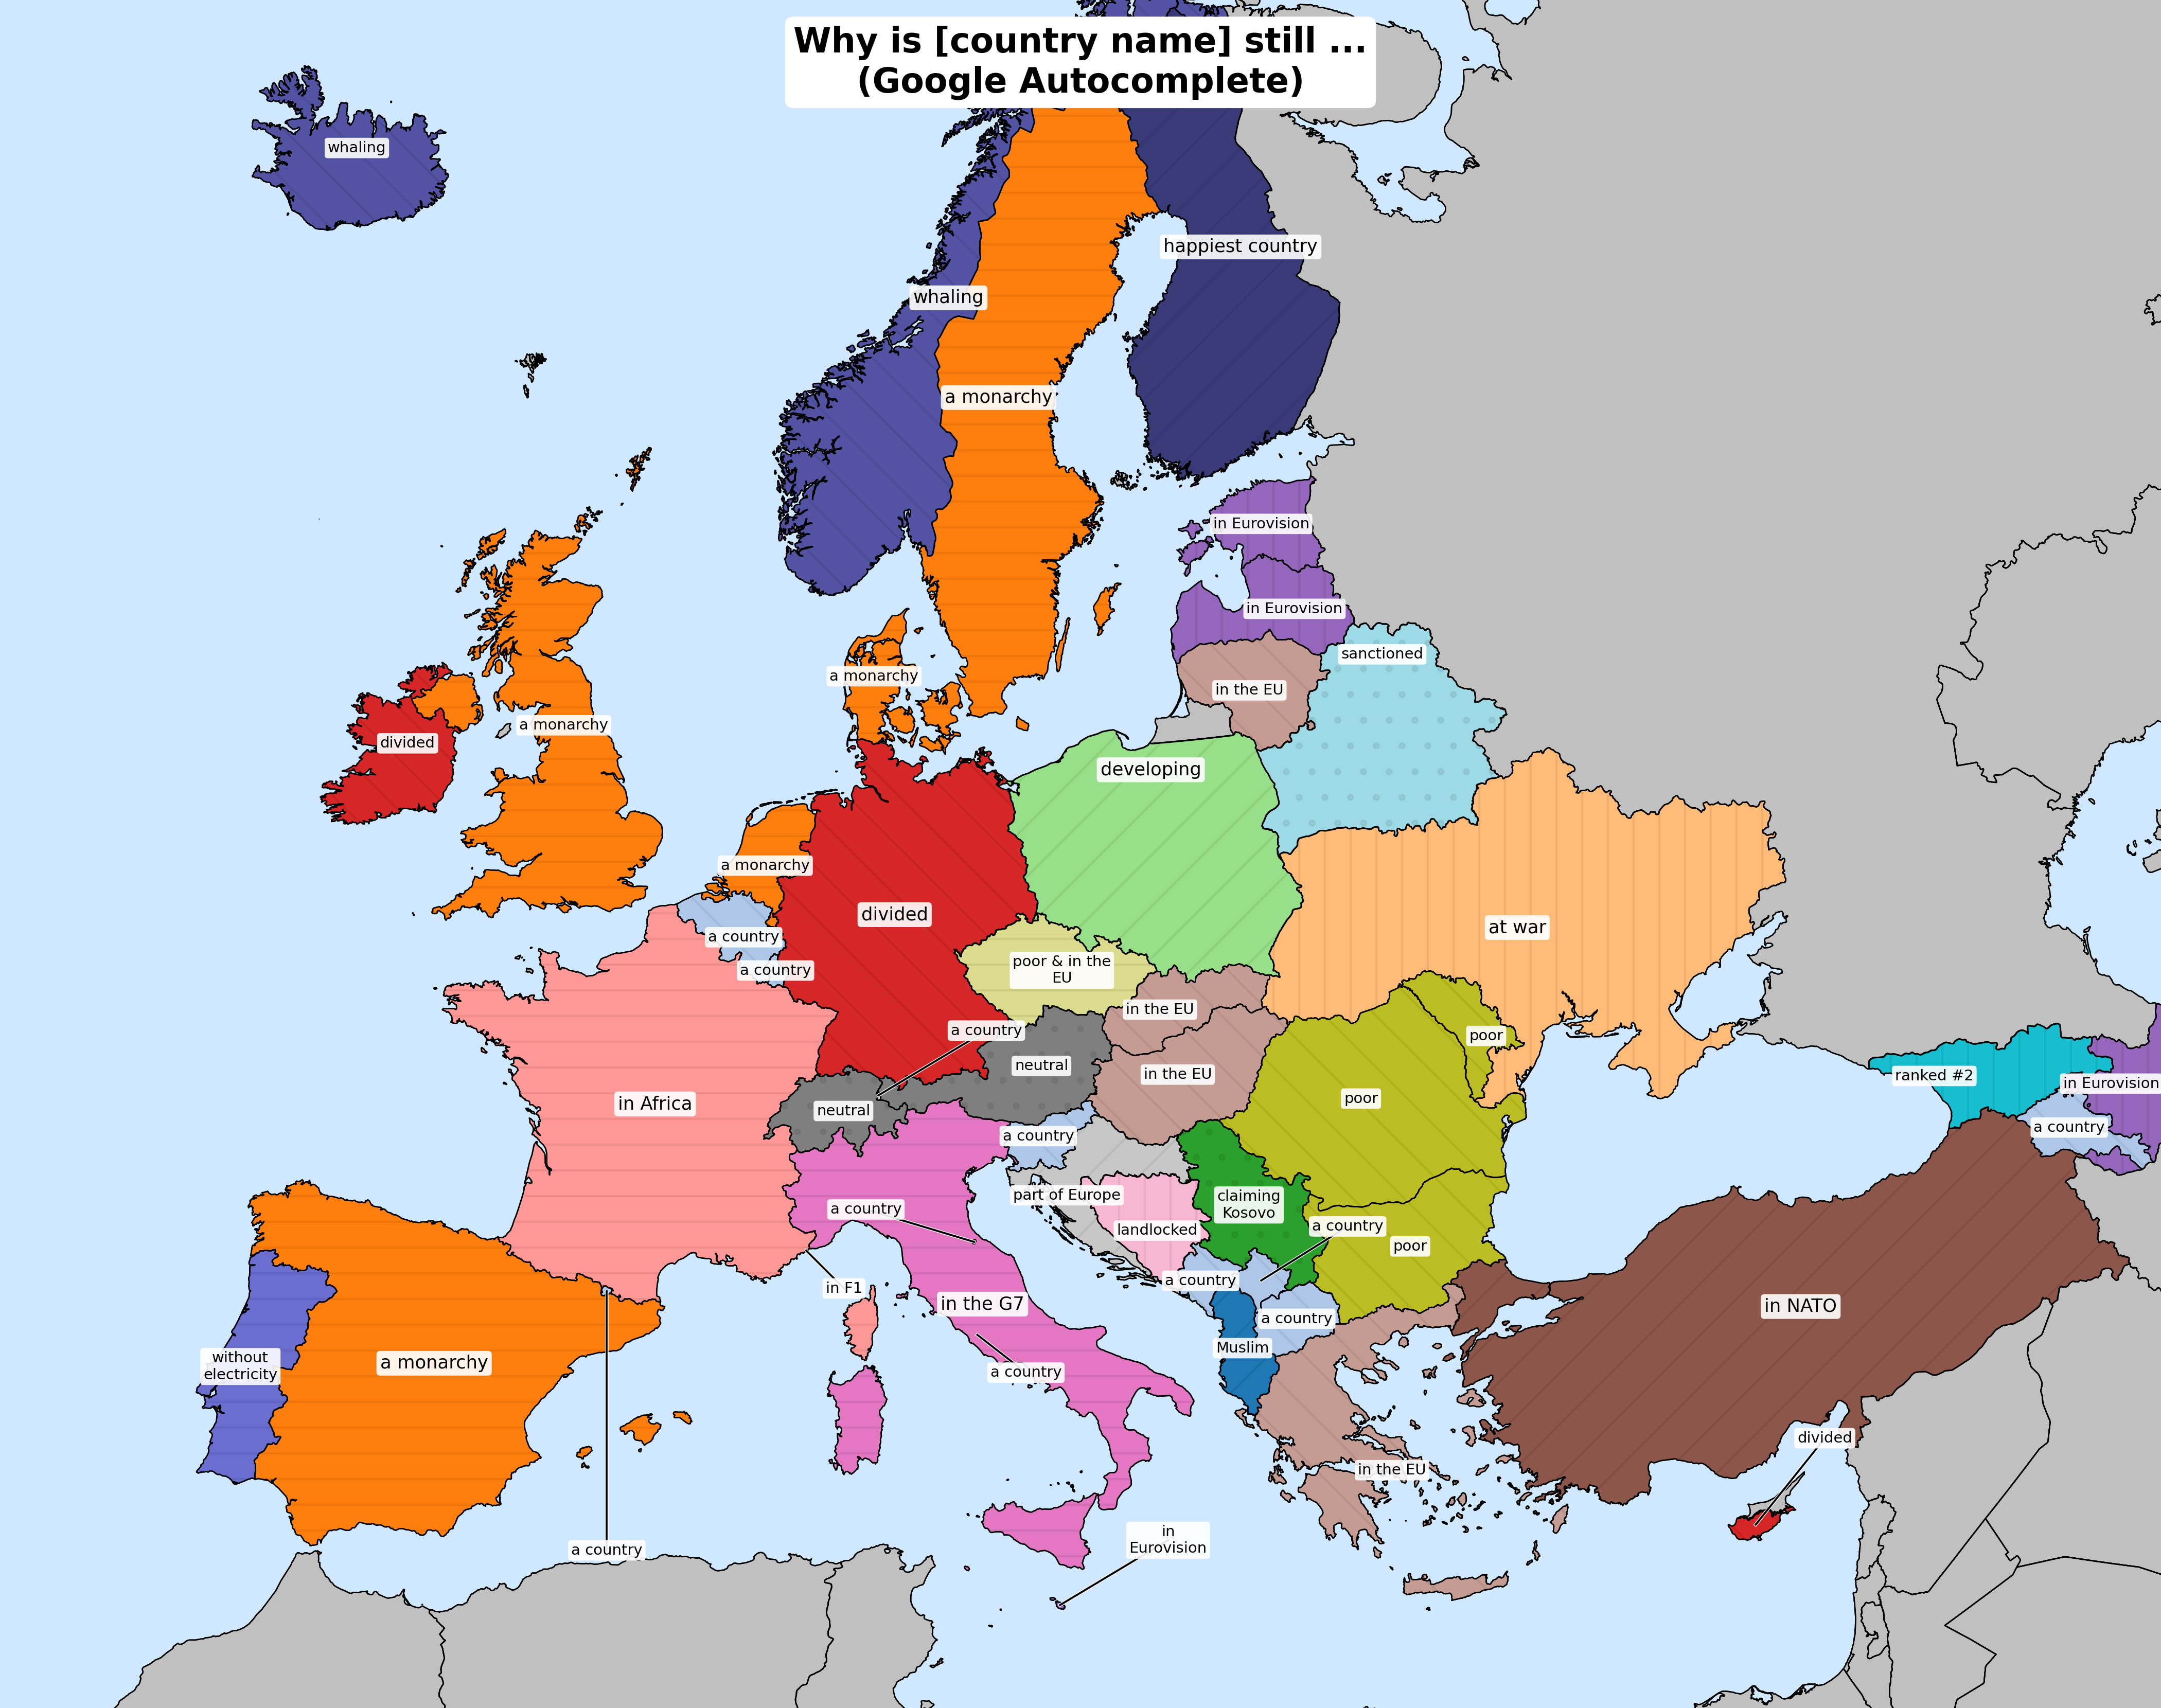
Economic Development Map of Haiti
Interestingly, Haiti ranks among the poorest countries in the Western Hemisphere, with a GDP per capita of around $1,200...
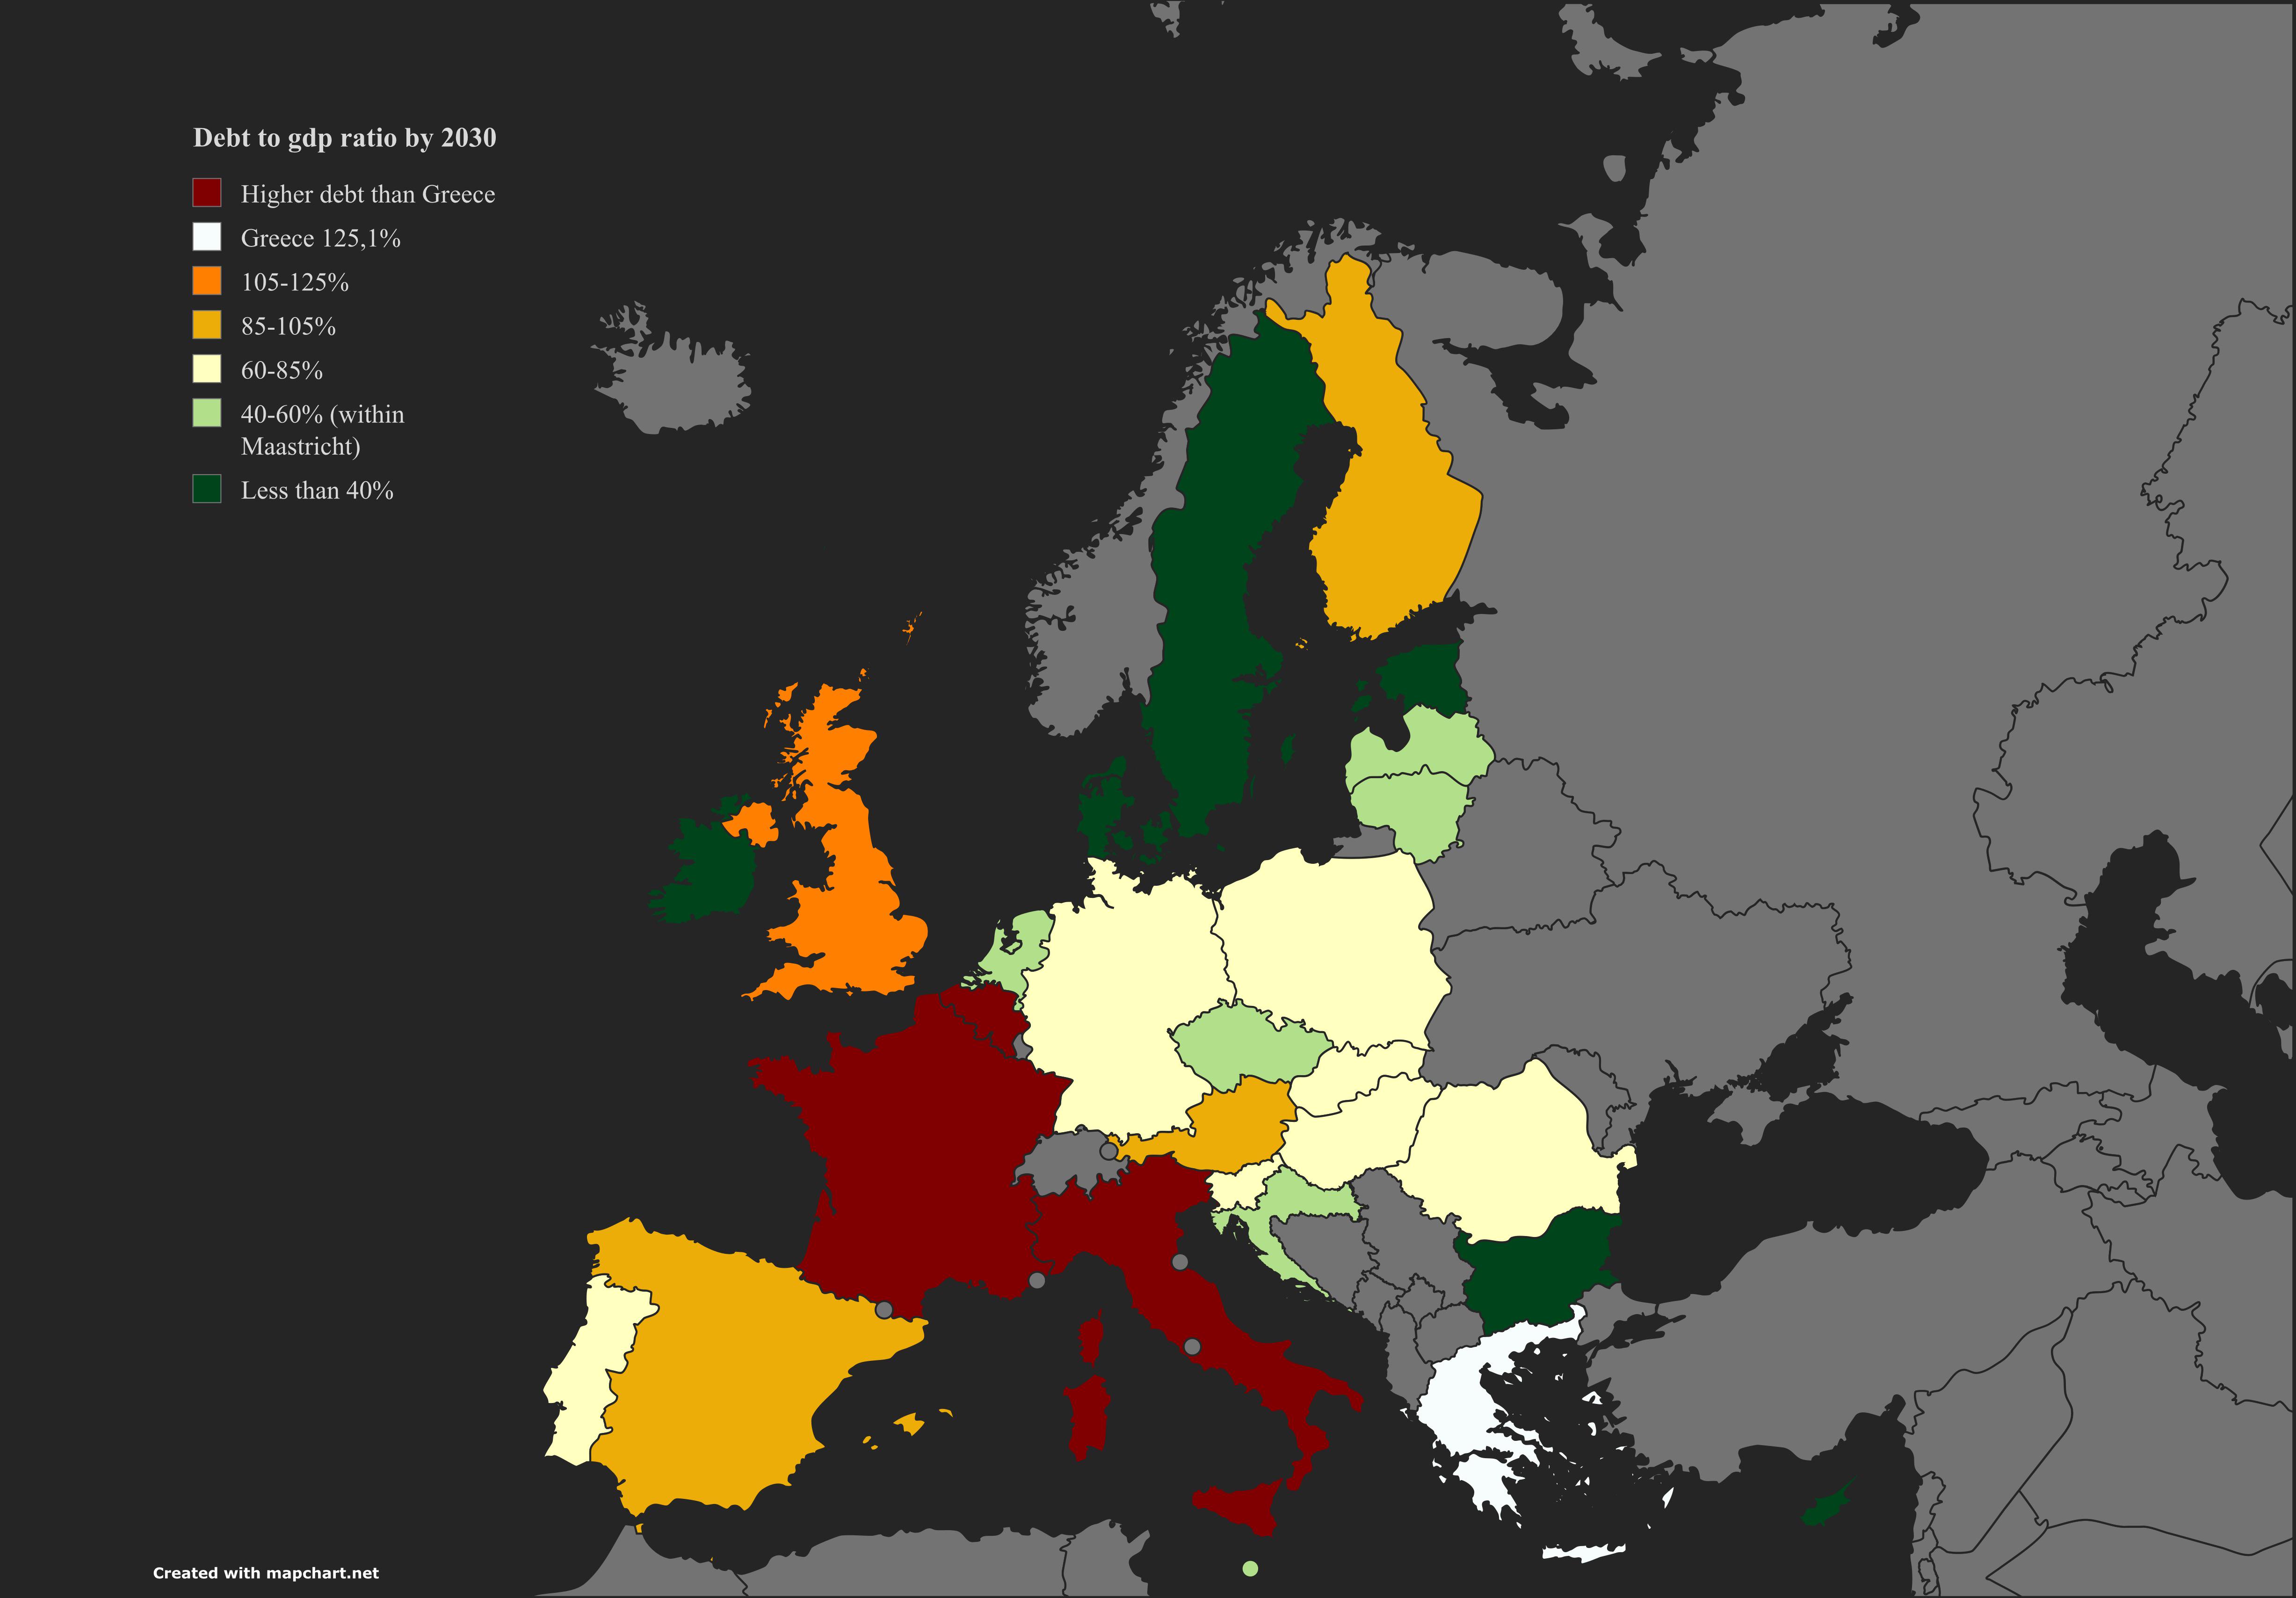
Debt to GDP Ratio by 2030 Map
The visualization titled "Debt to GDP Ratio by 2030 in the EU and the UK according to the IMF" provides a comprehensive ...
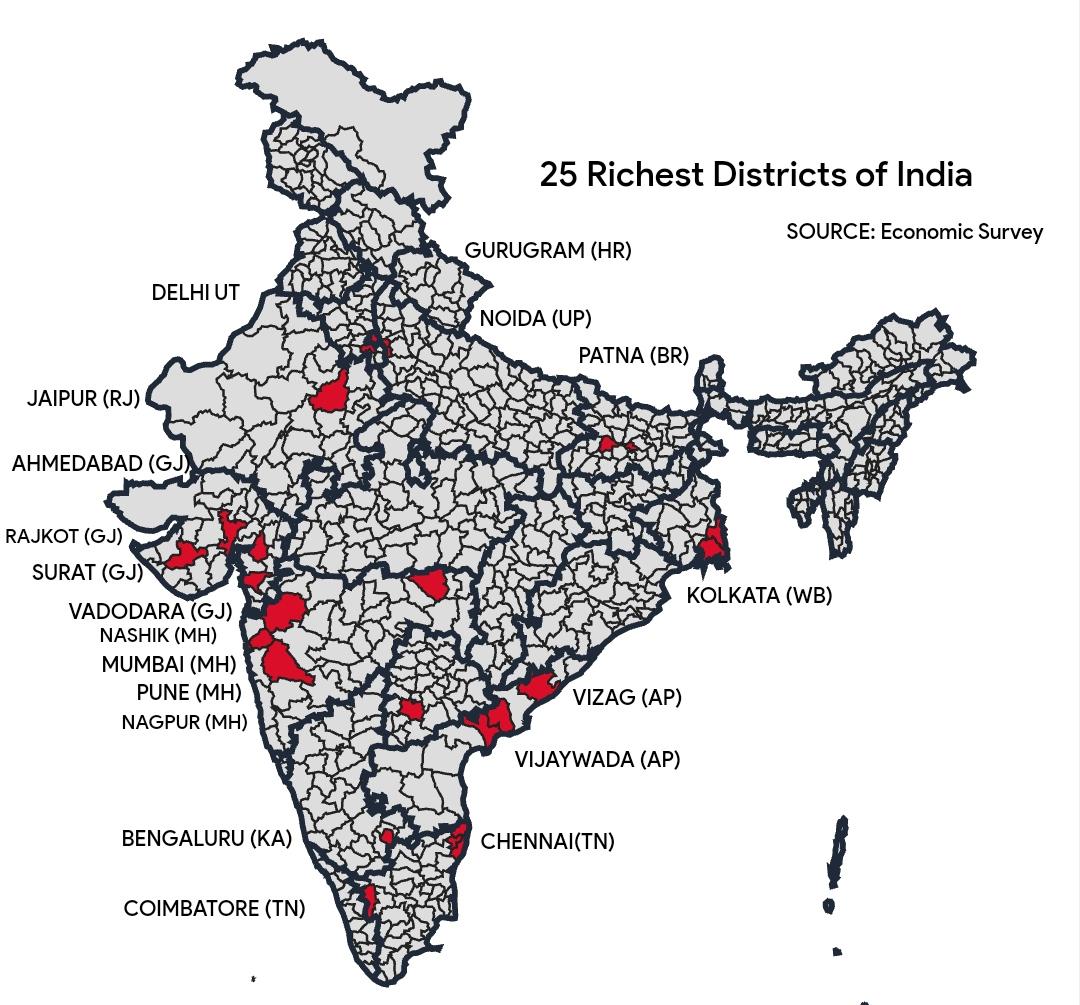
GDP Contribution by Districts in India Map
The visualization titled "Almost 1/3rd of India's $4 trillion GDP comes from these 25 districts" highlights the economic...
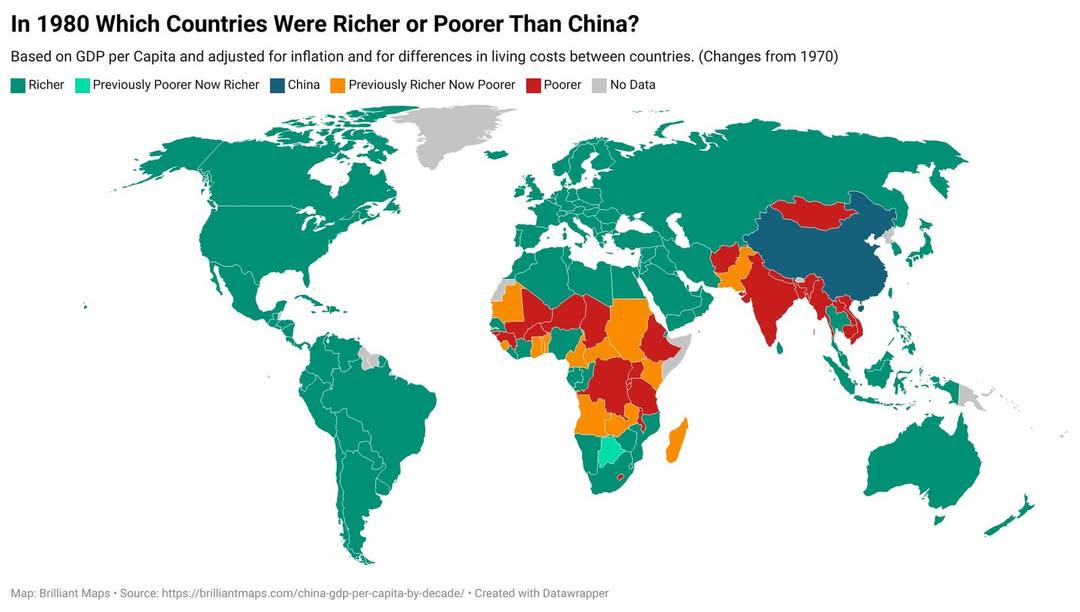
1980 GDP Comparison Map: Countries Richer or Poorer Than China
This visualization displays the GDP per capita of various countries in 1980, allowing us to see which nations were riche...
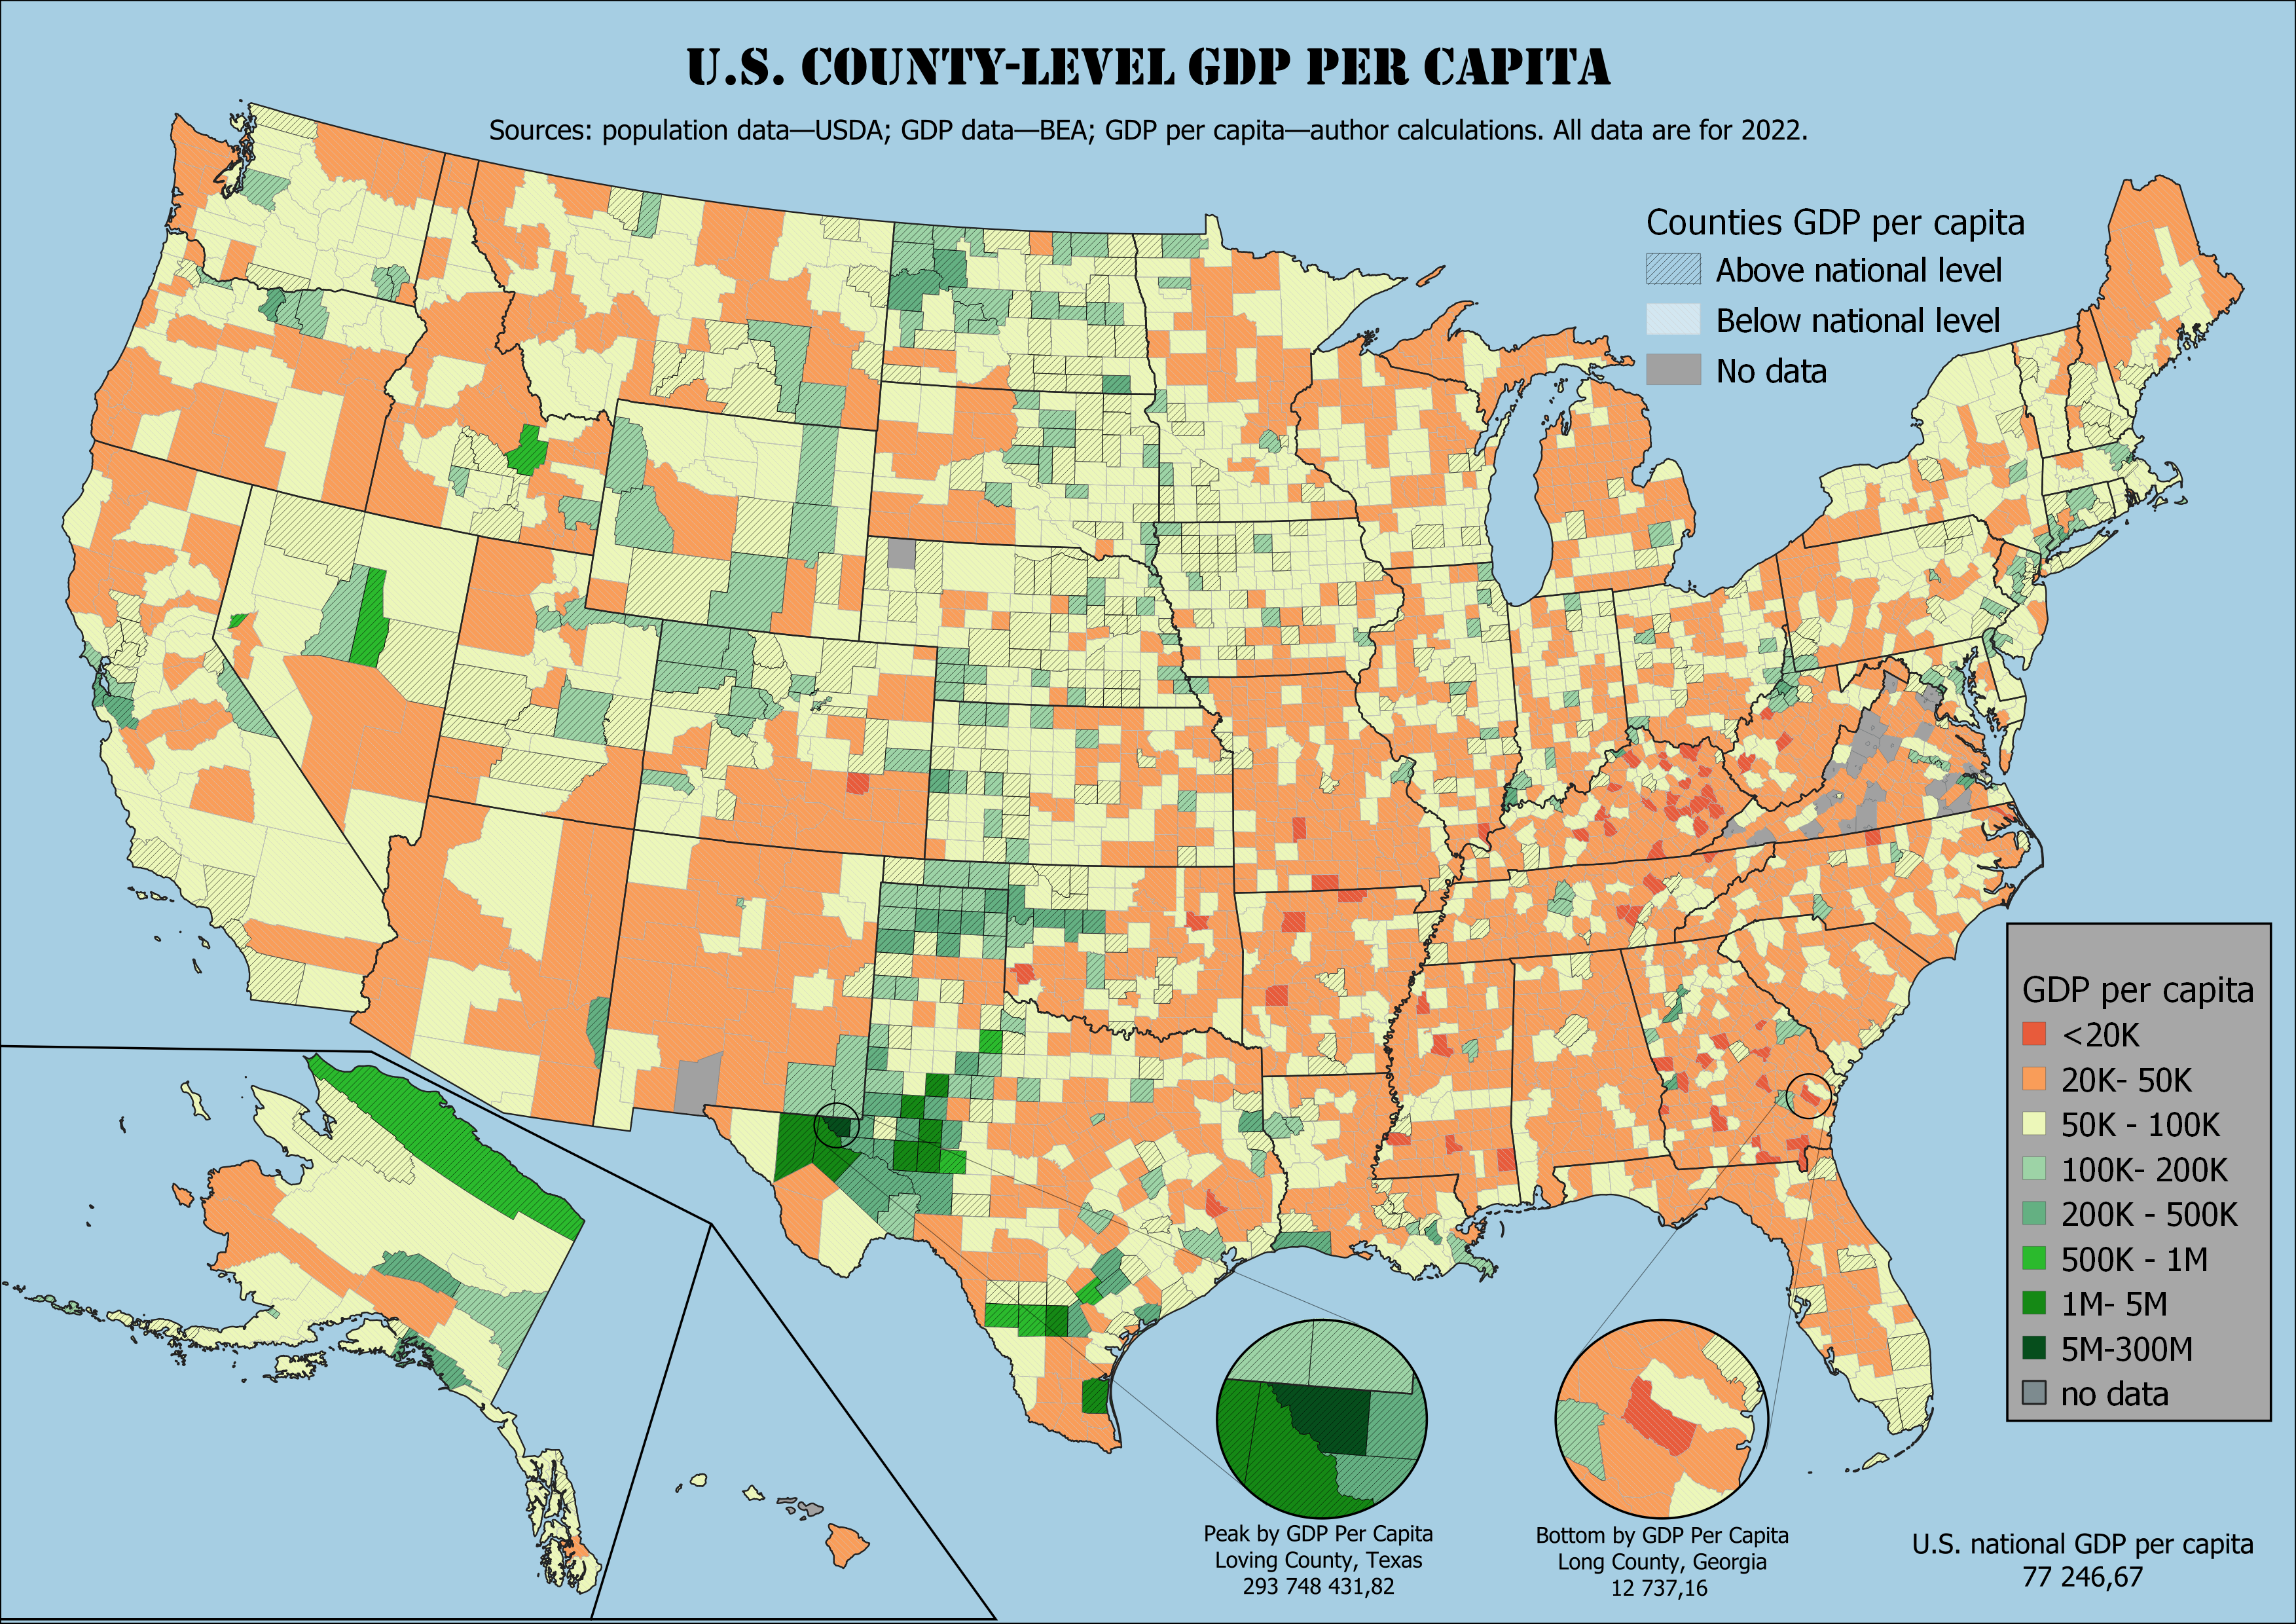
US County-Level GDP Per Capita Map 2022
The "US County-Level GDP Per Capita, 2022" map provides a detailed visualization of the economic performance across vari...
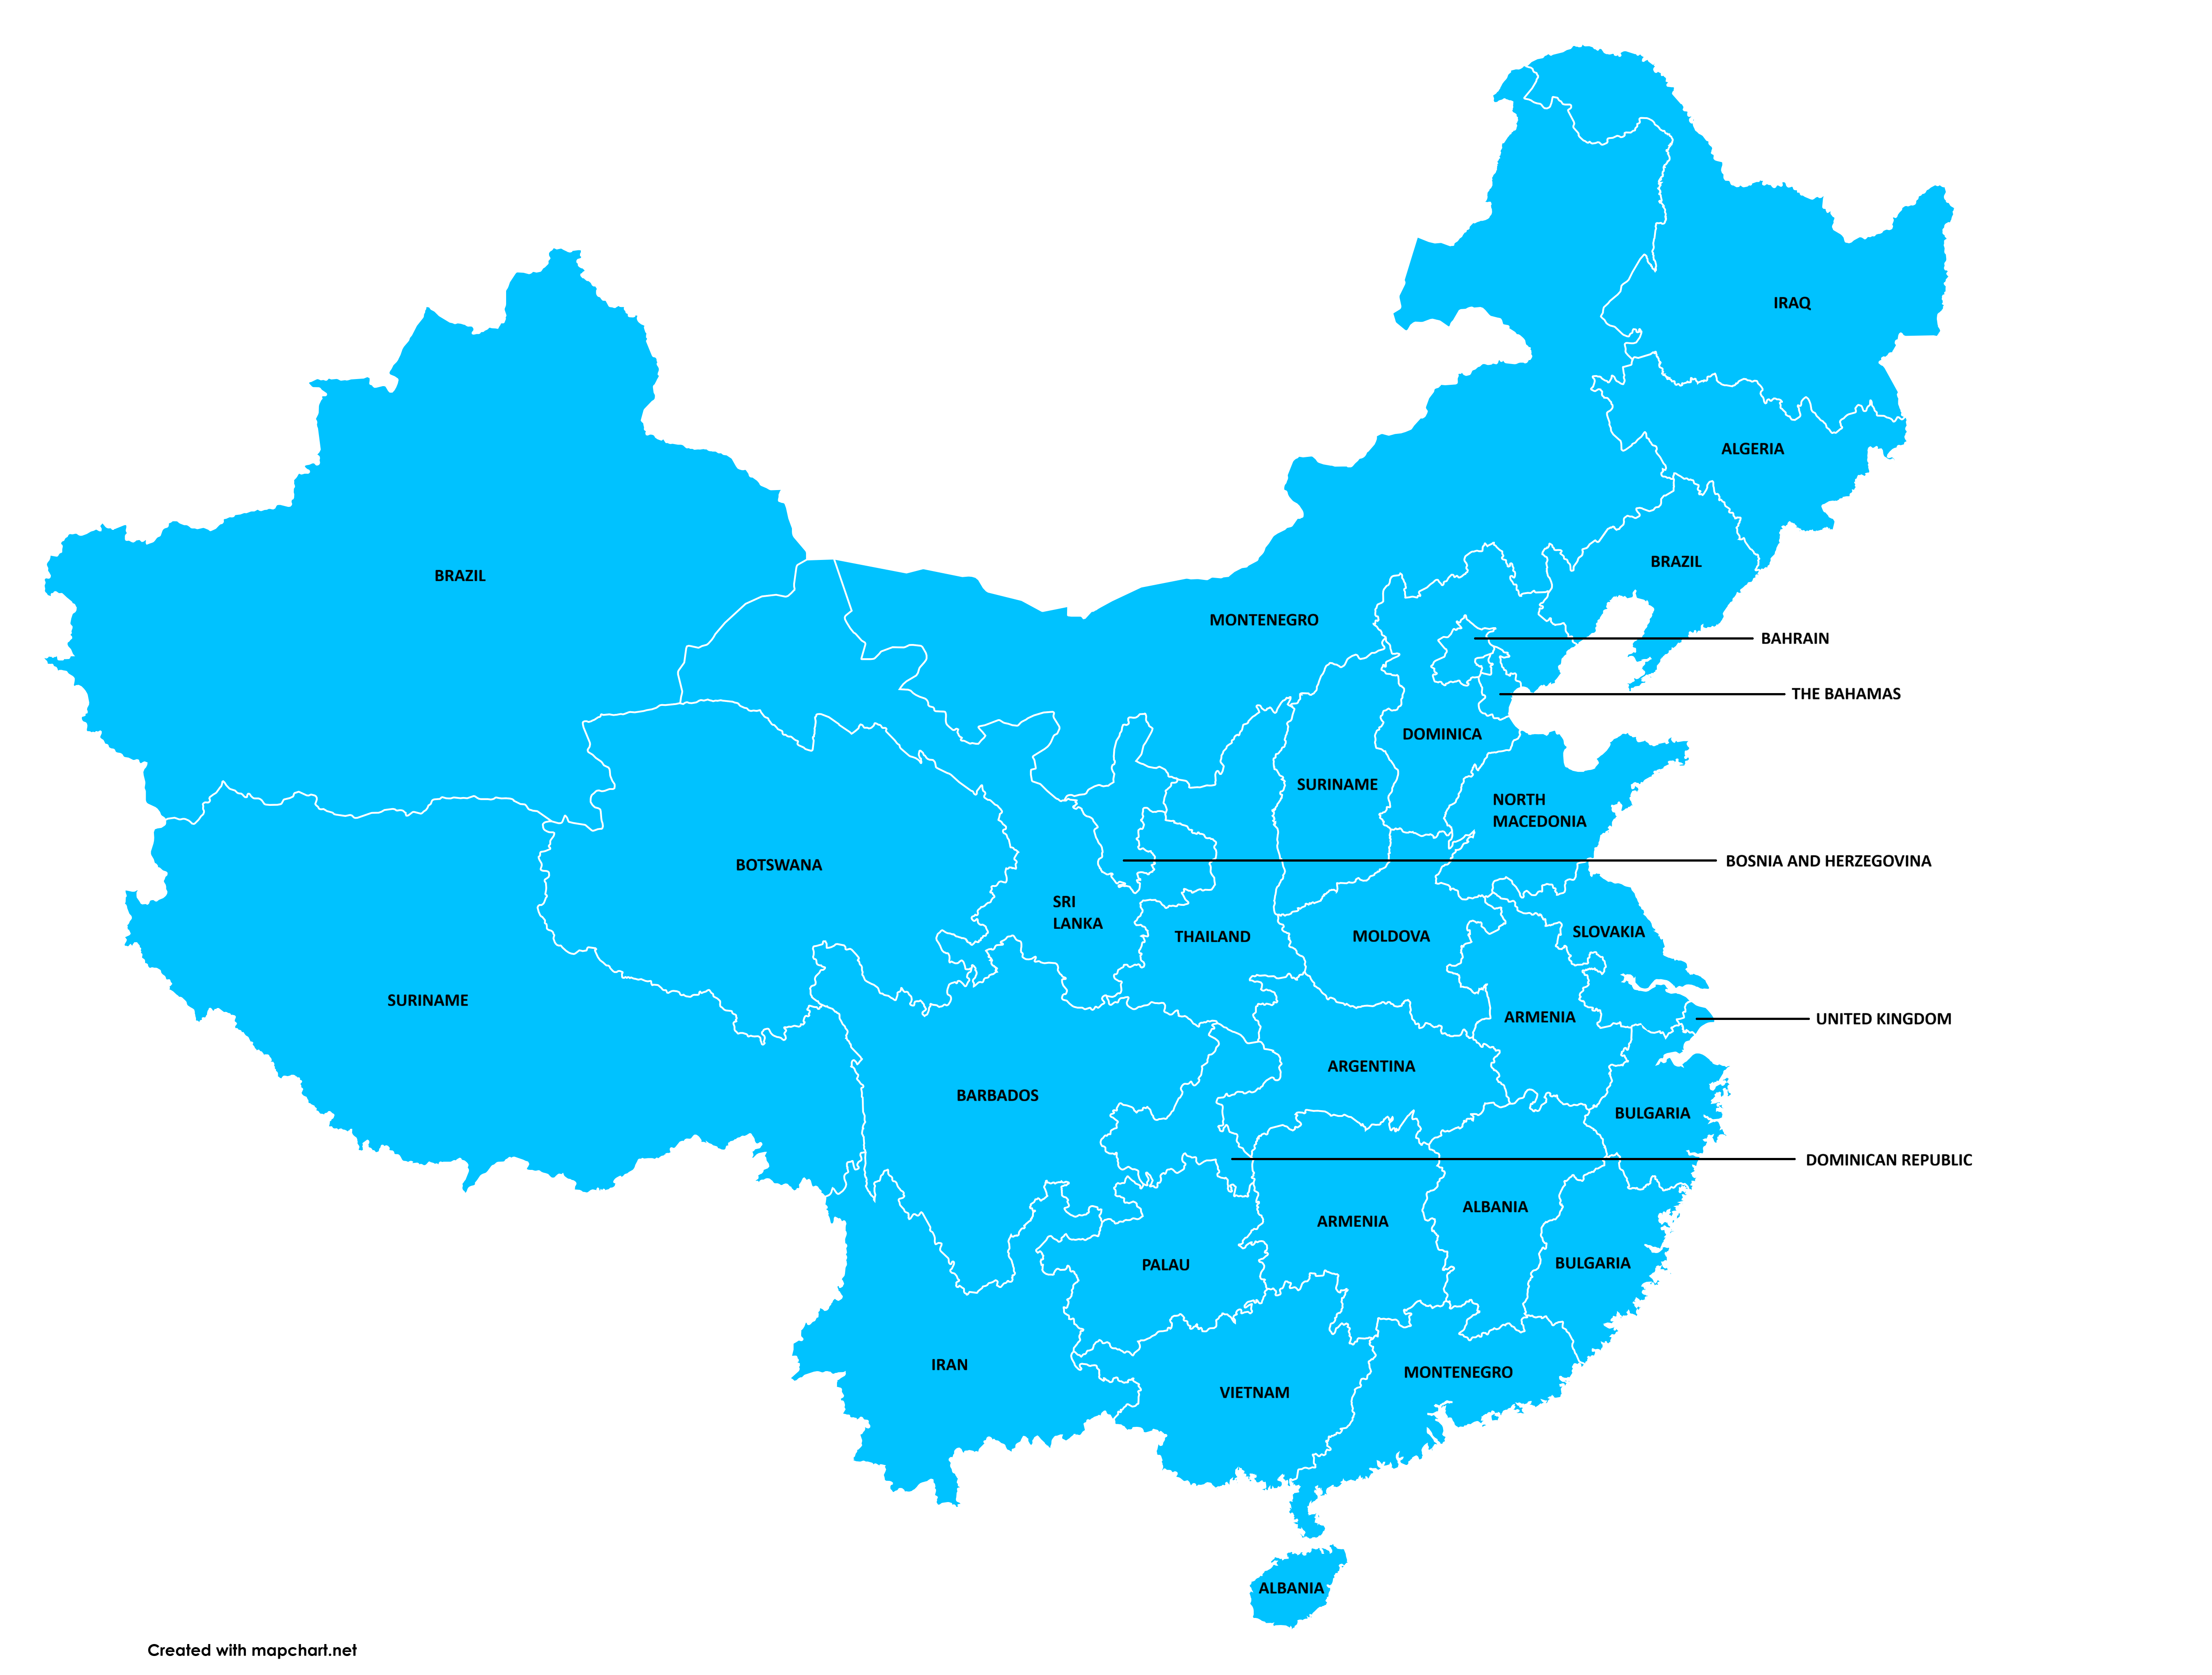
GDP Per Capita by Chinese Provinces Map
The visualization titled "Chinese Provinces Compared to Countries by GDP (PPP) Per Capita" provides a fascinating overvi...
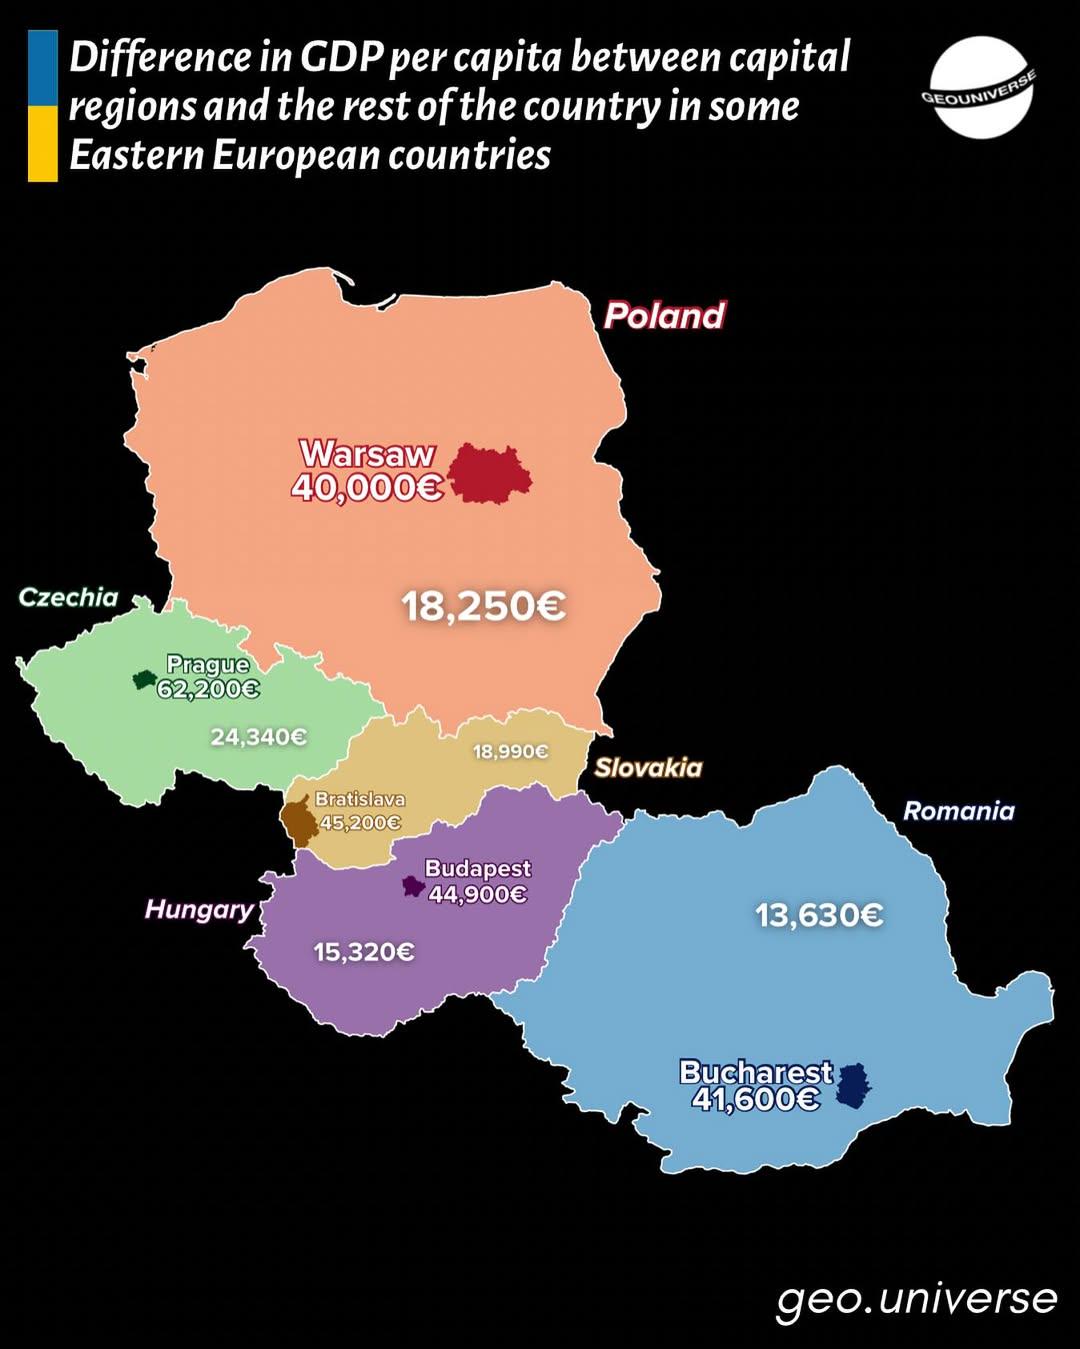
GDP Per Capita Gap Map in Eastern Europe
This map visually illustrates the disparities in GDP per capita between capital regions and the rest of their respective...
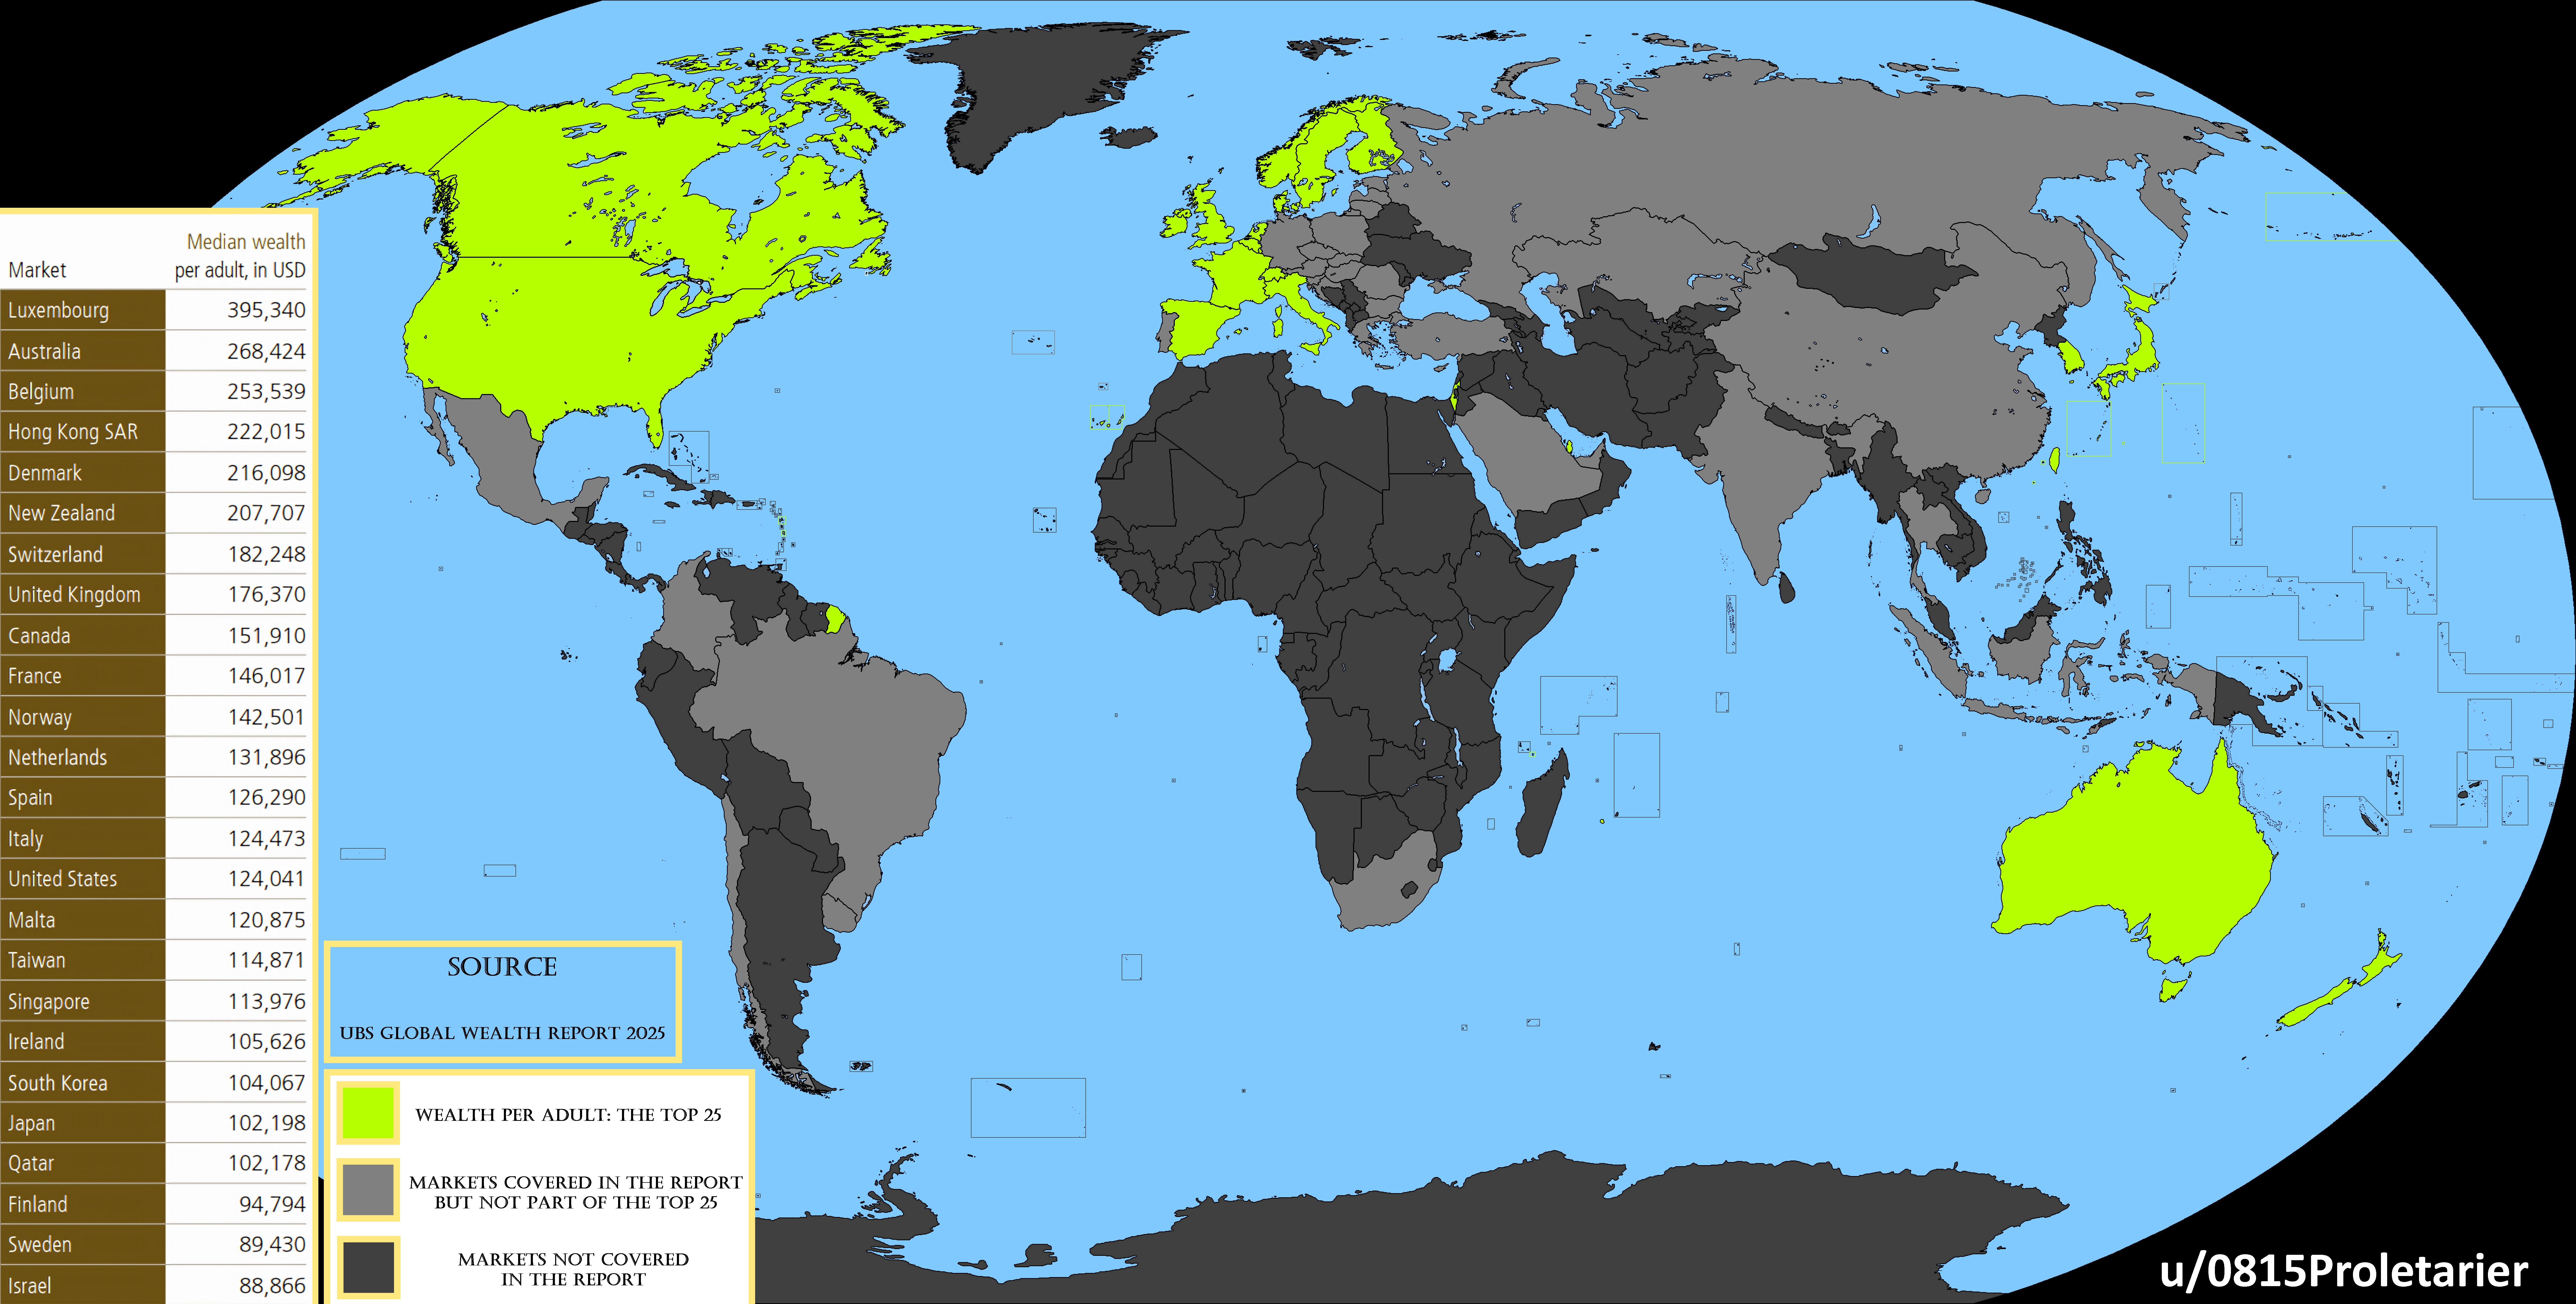
Map of Top 25 Countries by Median Wealth
The visualization titled \...
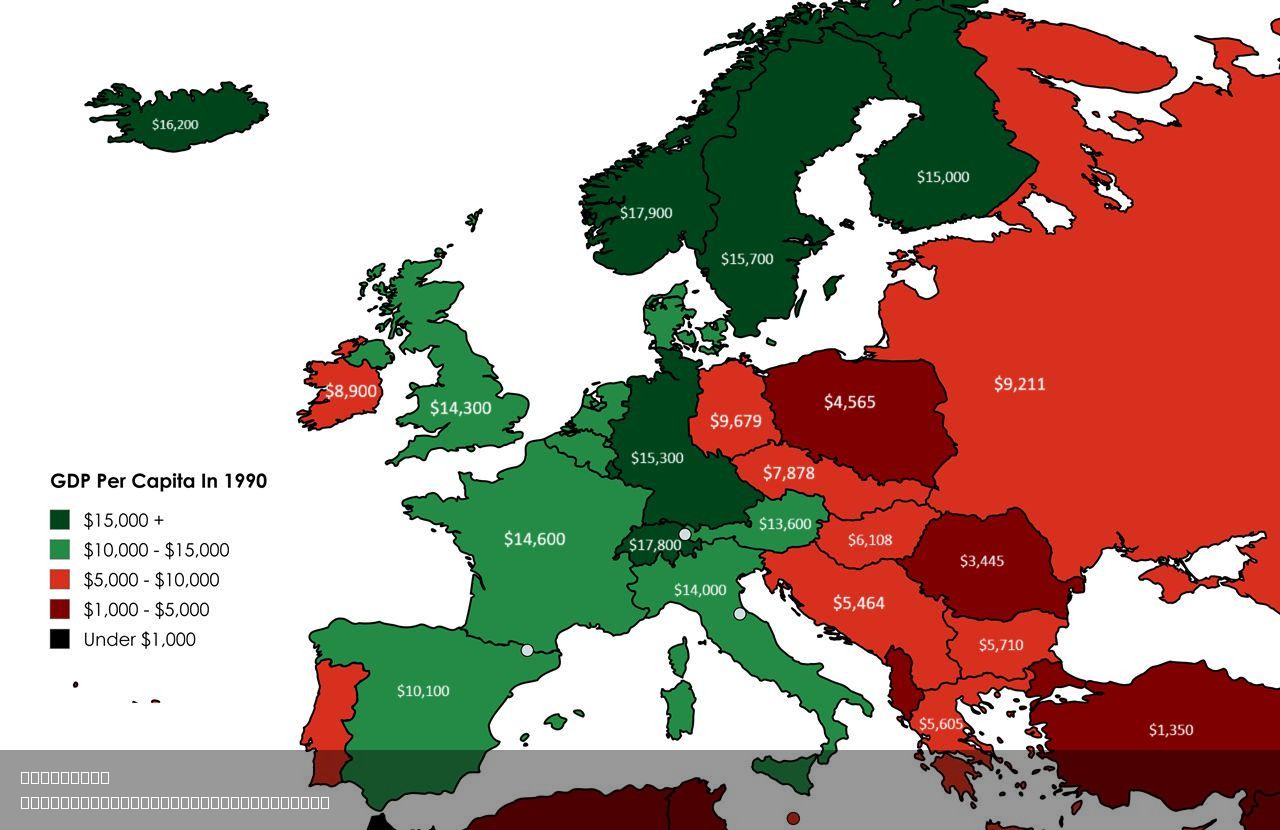
GDP Per Capita by Country Map 1990
The map titled "European GDP Per Capita in 1990" provides a visual representation of the economic output per person acro...
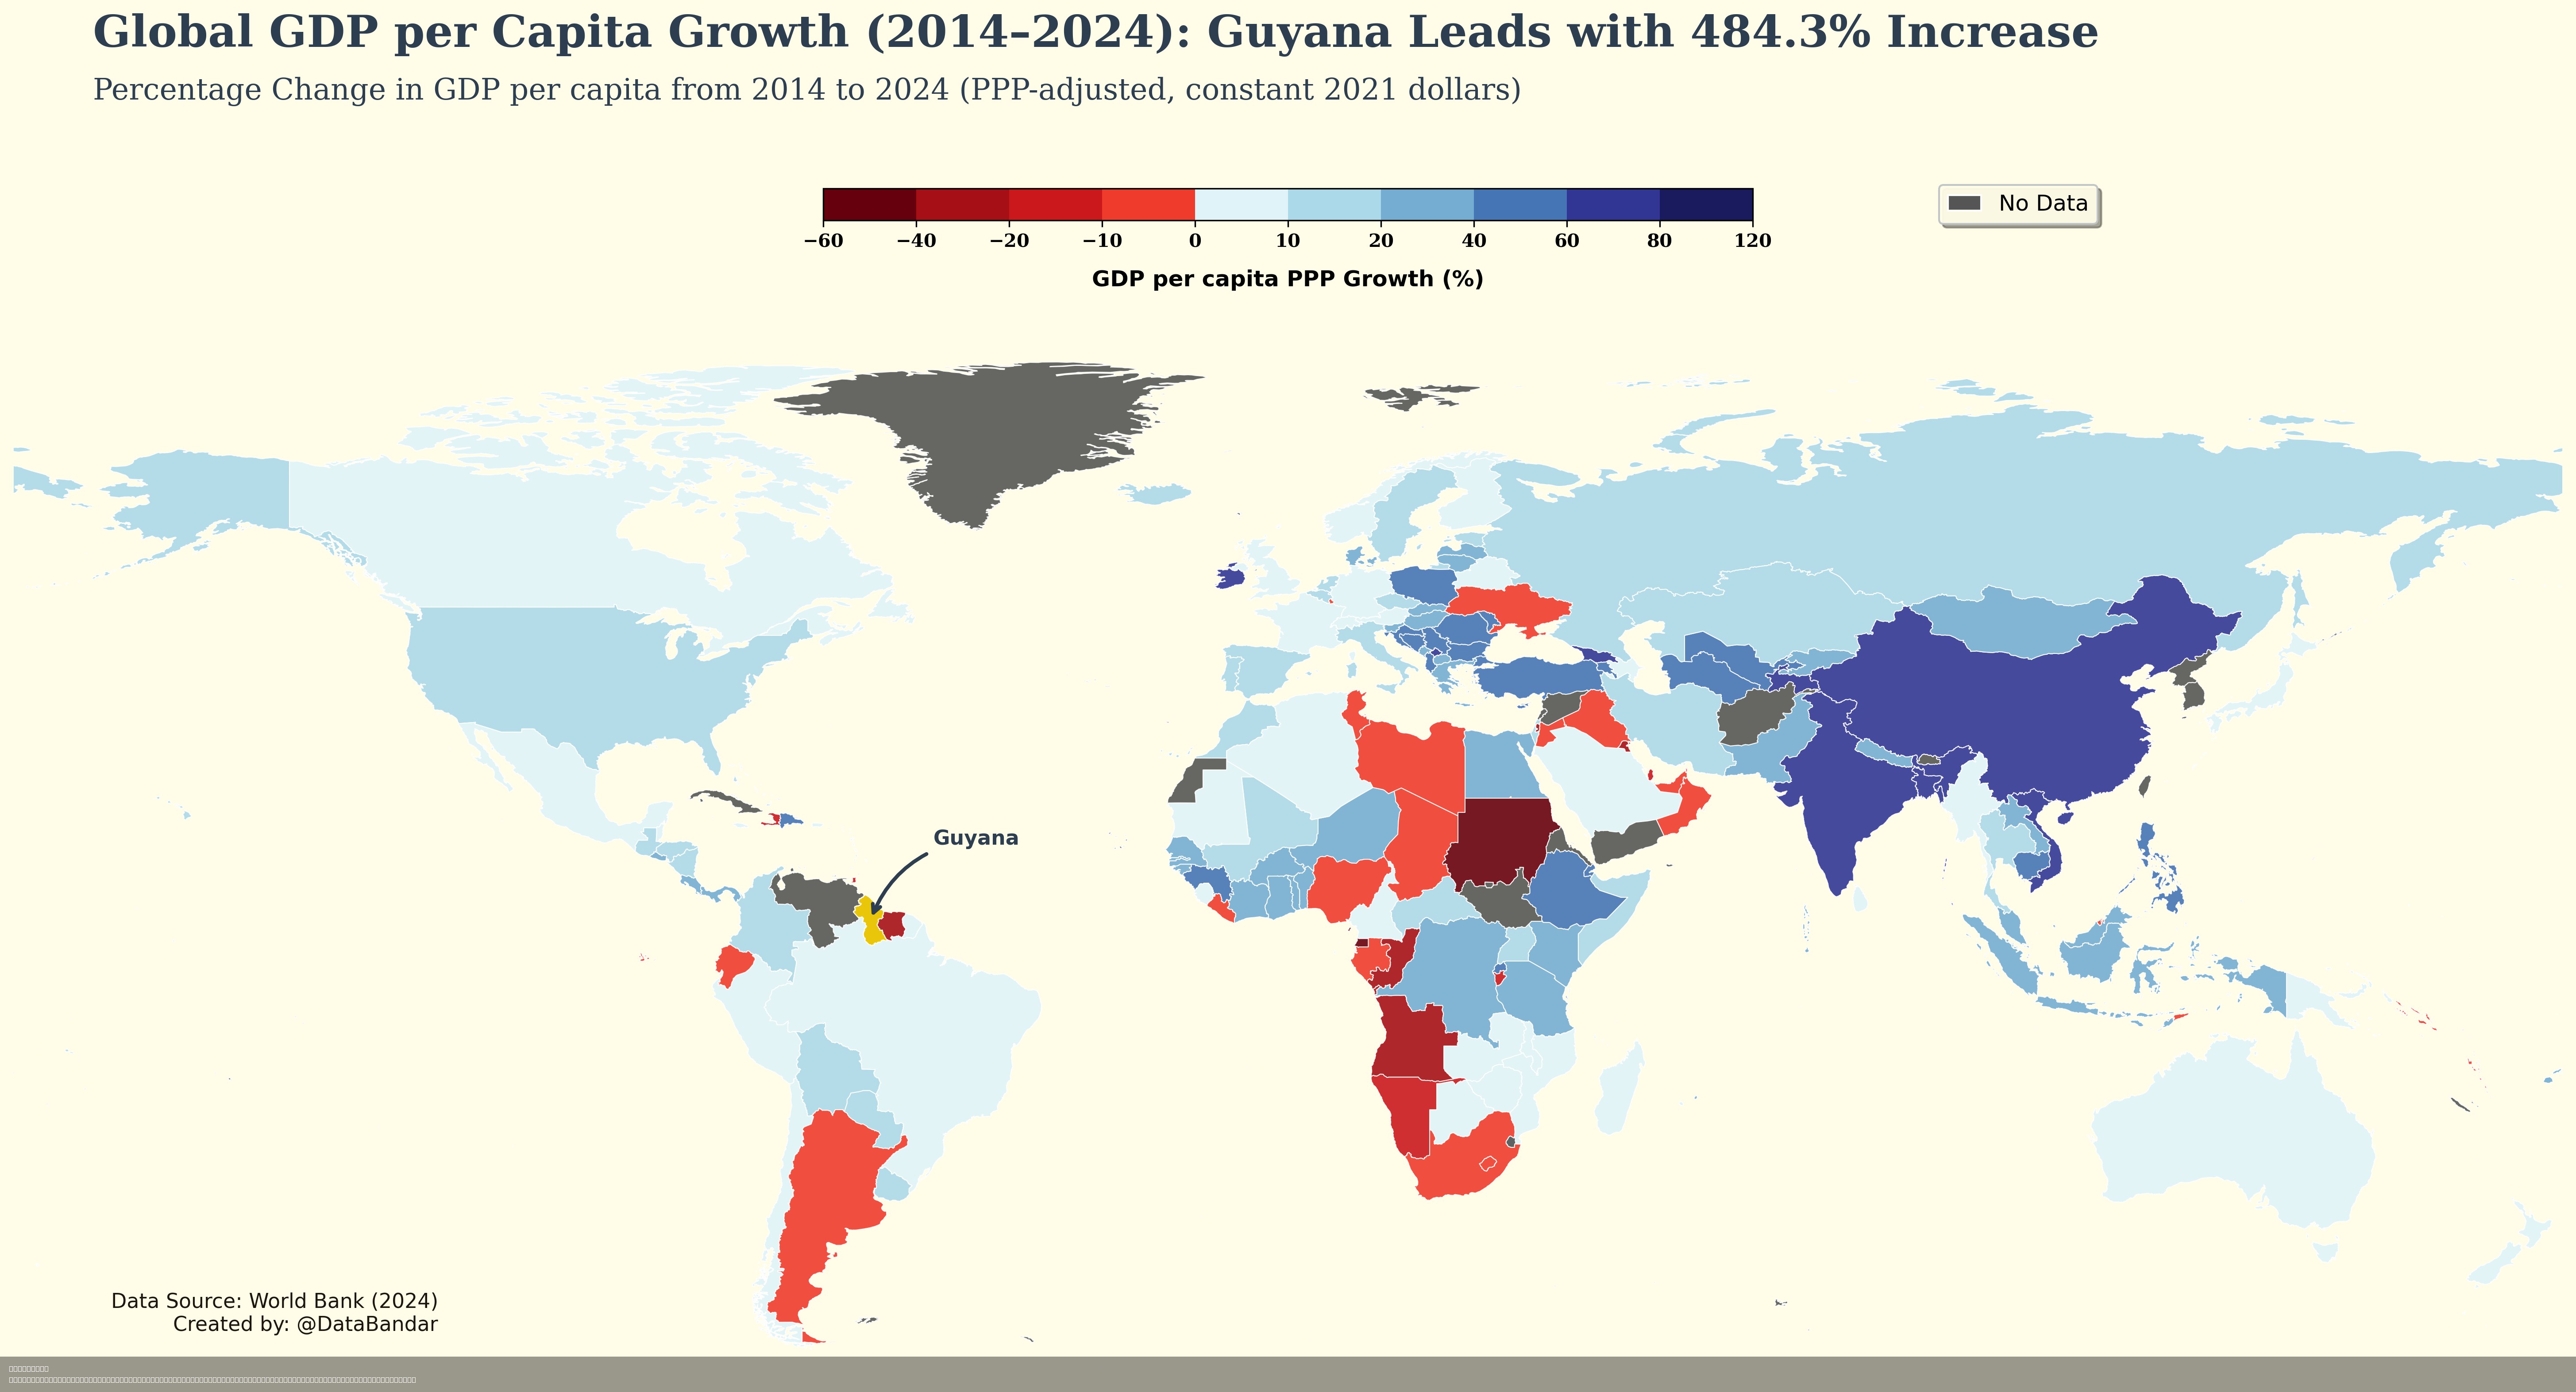
GDP Per Capita Growth Map of Guyana
The visualization titled "Guyana's GDP per capita grew 484% from 2014-2024, leading the world by a massive margin" provi...
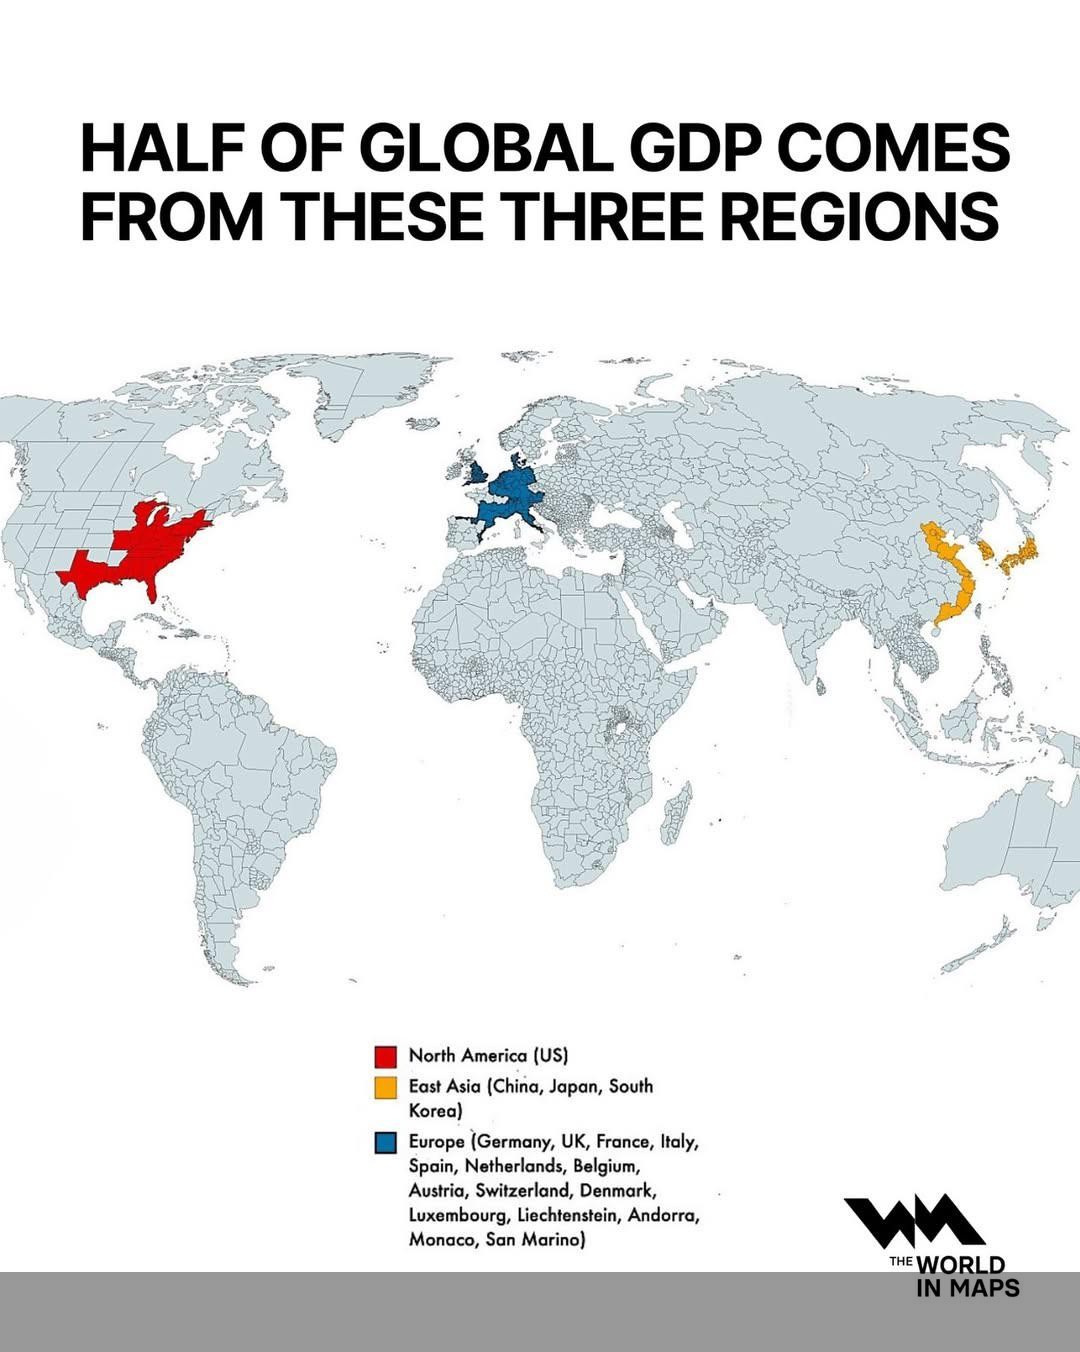
Global GDP Distribution by Region Map
This map illustrates a significant economic reality: half of the world's Gross Domestic Product (GDP) originates from ju...
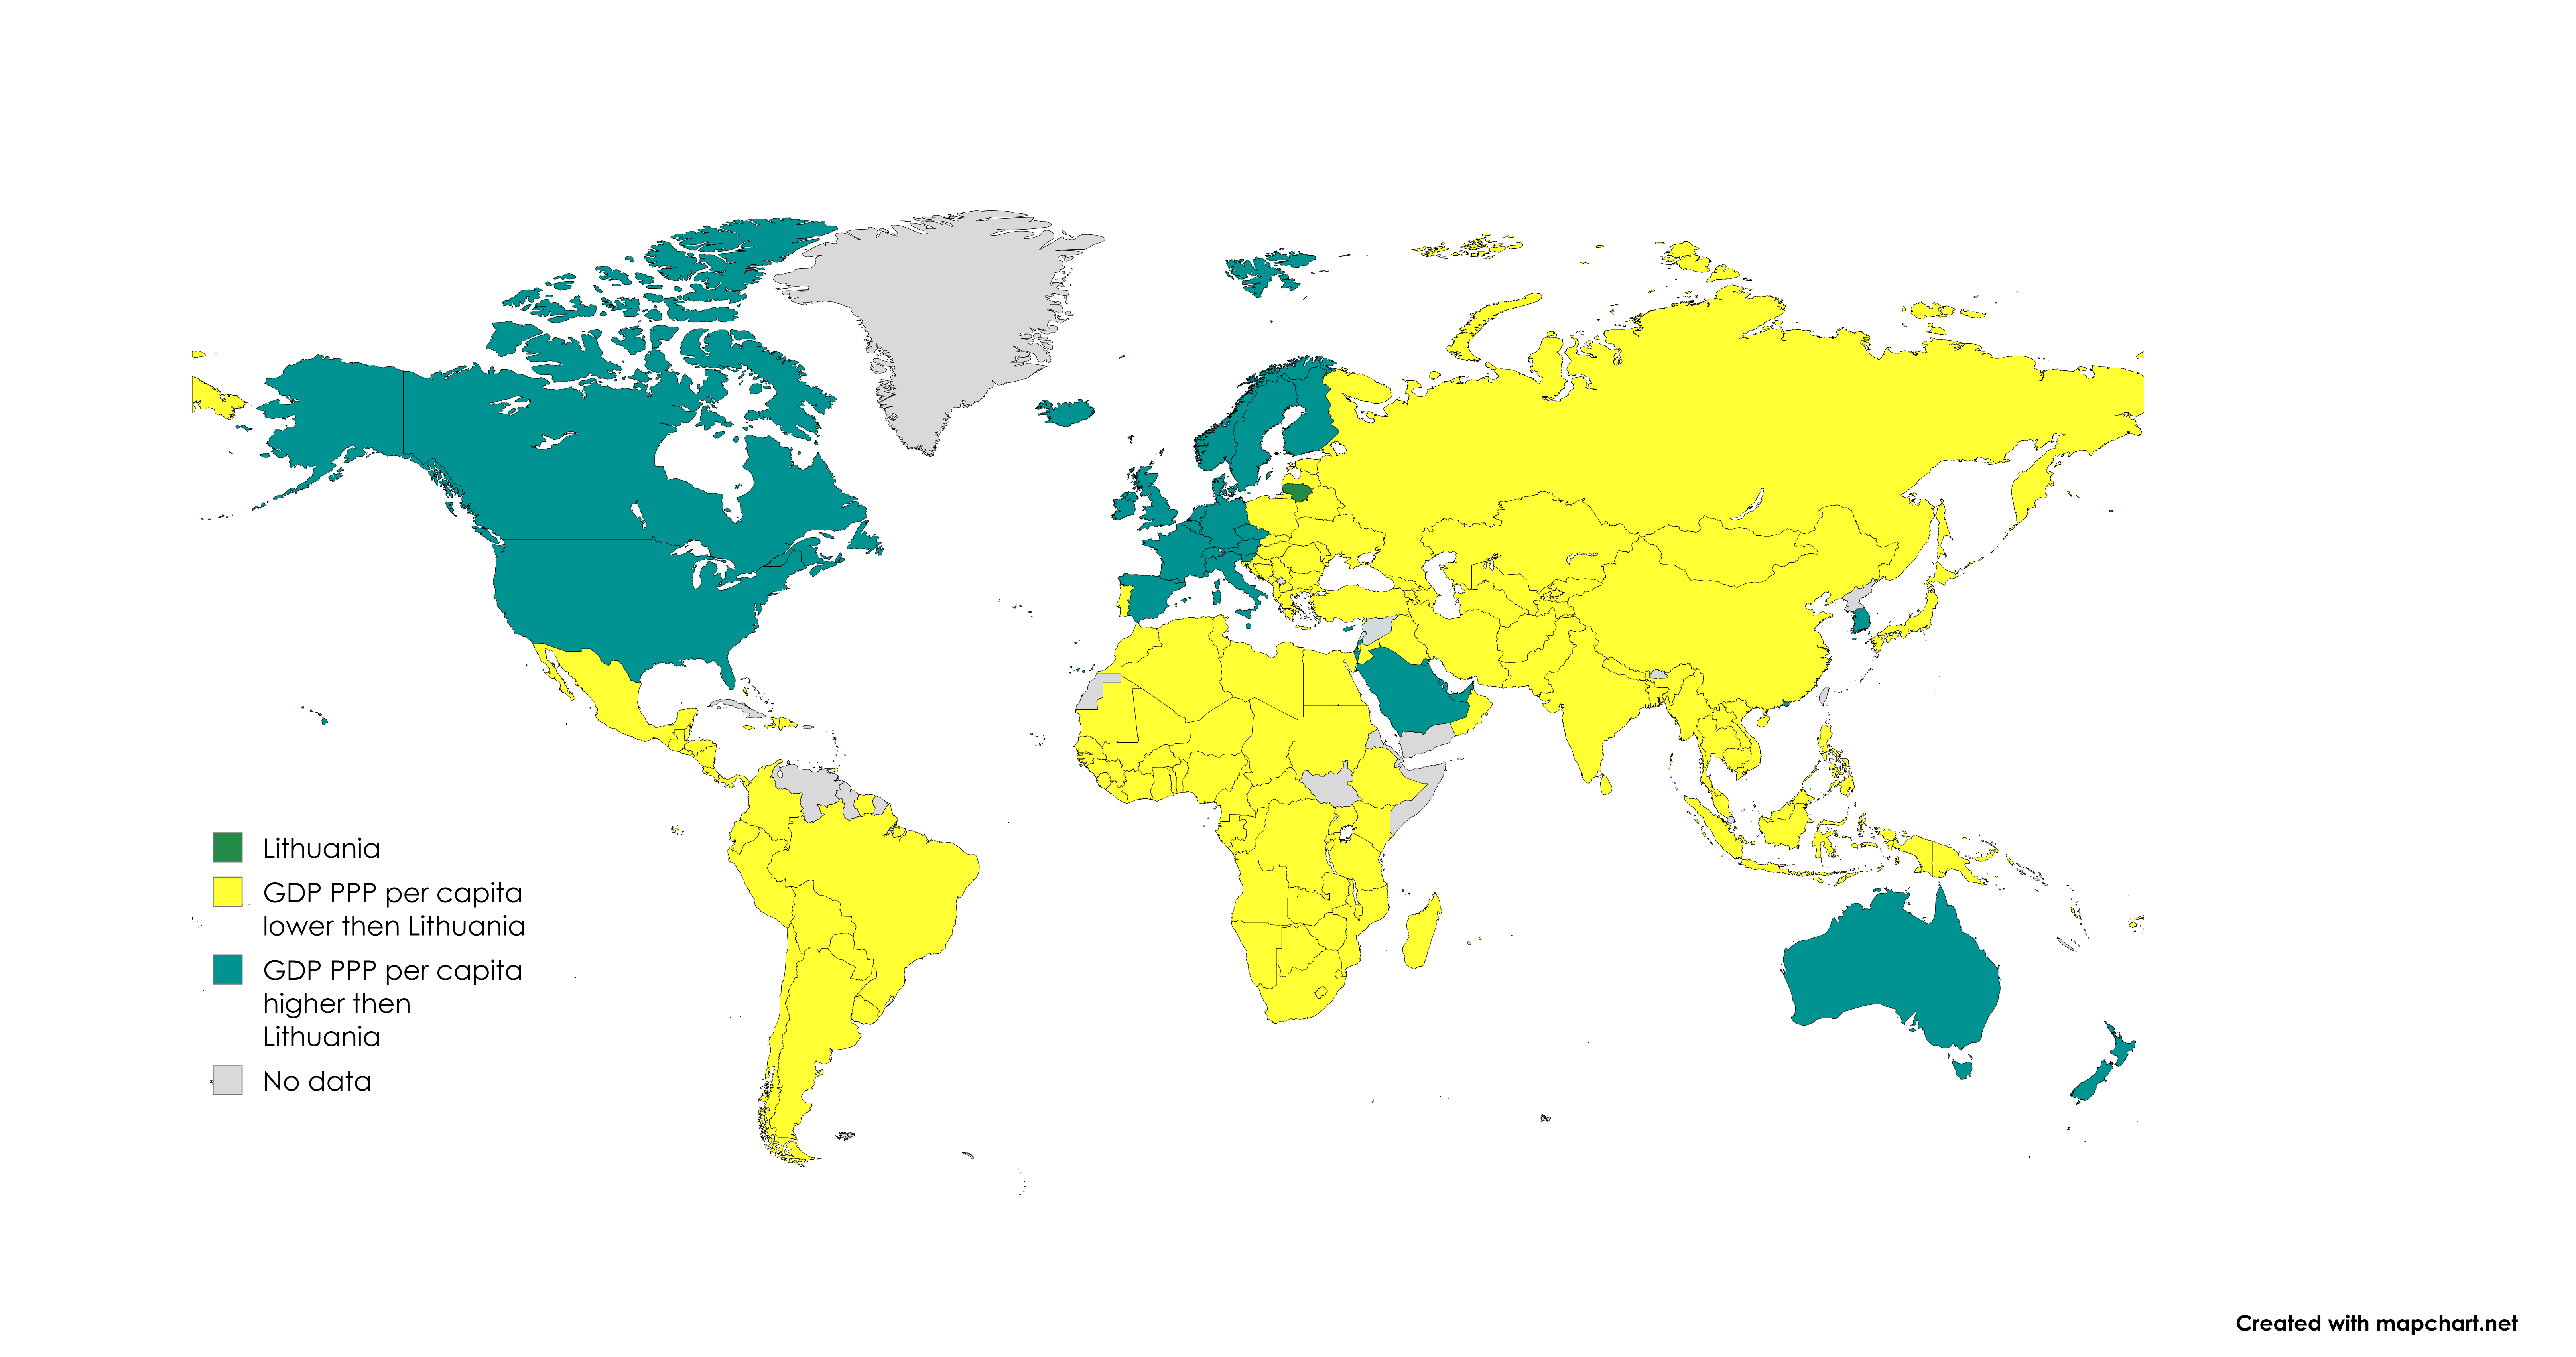
GDP (PPP) Per Capita Lithuania Map
The GDP (PPP) per capita Lithuania map provides a visual representation of the economic performance of Lithuania, expres...
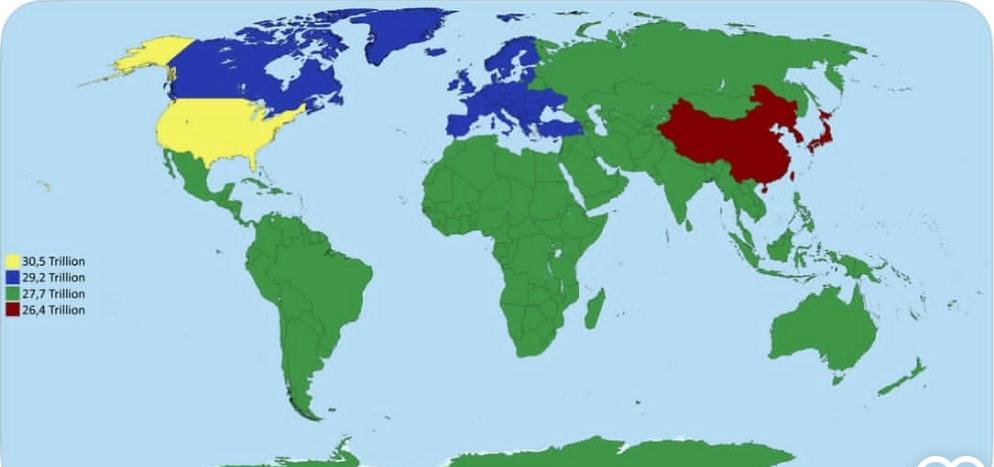
Equal GDP Distribution Map by Region
The visualization titled "Dividing the World into 4 Regions with Equal GDP" presents a unique perspective on the global ...
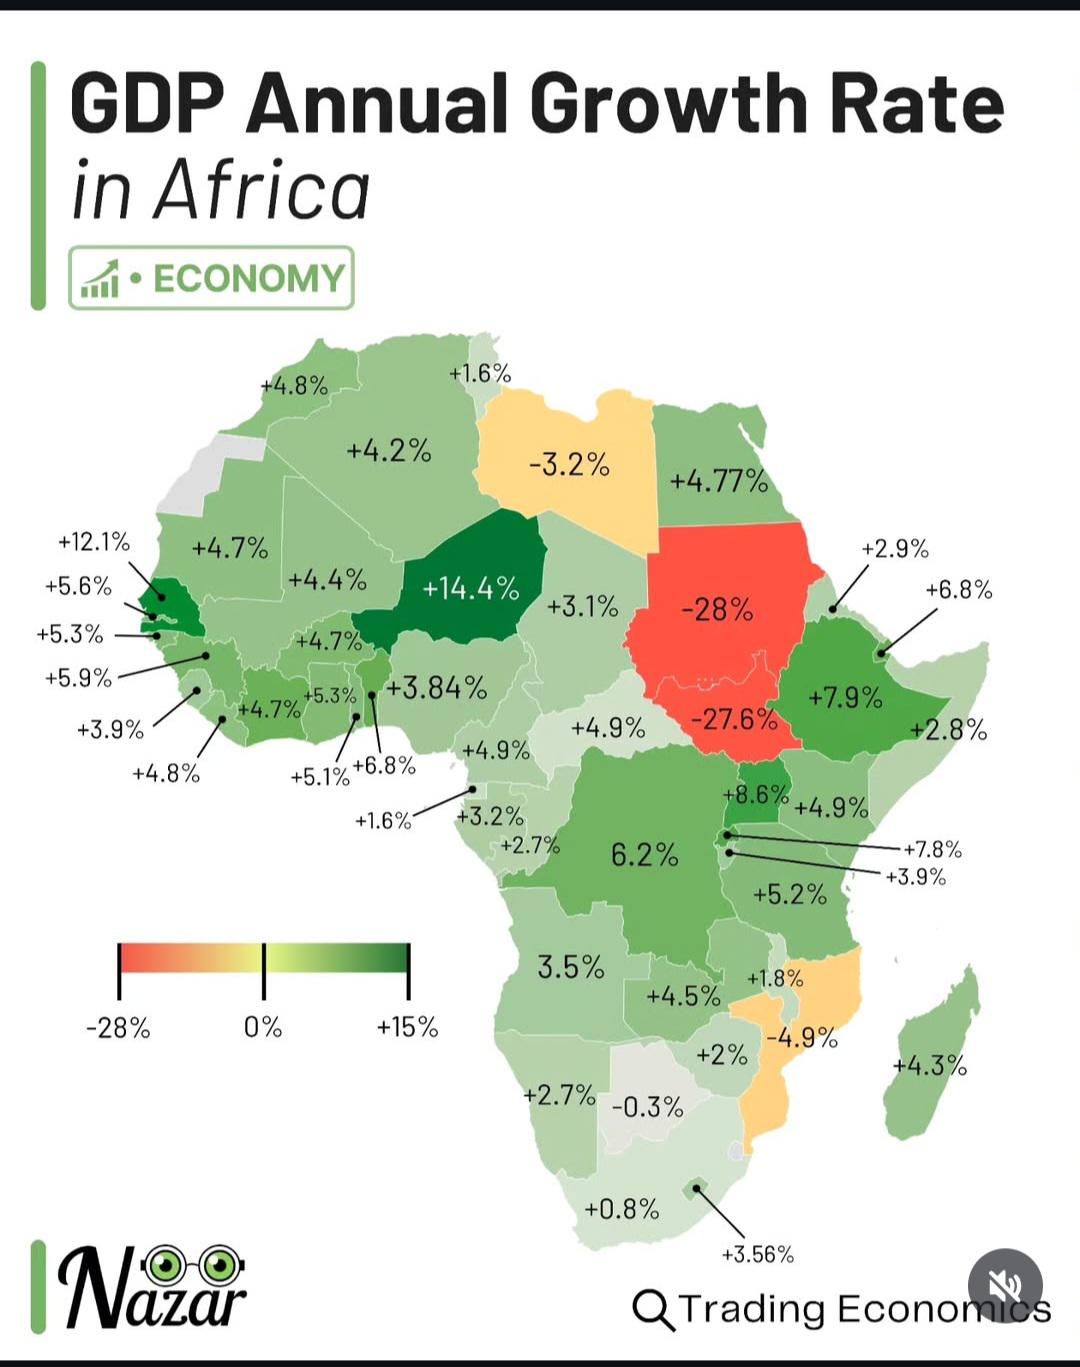
GDP Annual Growth Rate Map for 2024
The GDP Annual Growth Rate Map for 2024 illustrates the projected economic growth rates of various countries around the ...

GDP Per Capita by Italian Regions Map
Interestingly, regions like Lombardy, home to Milan, the financial capital of Italy, showcase a robust economy driven by...
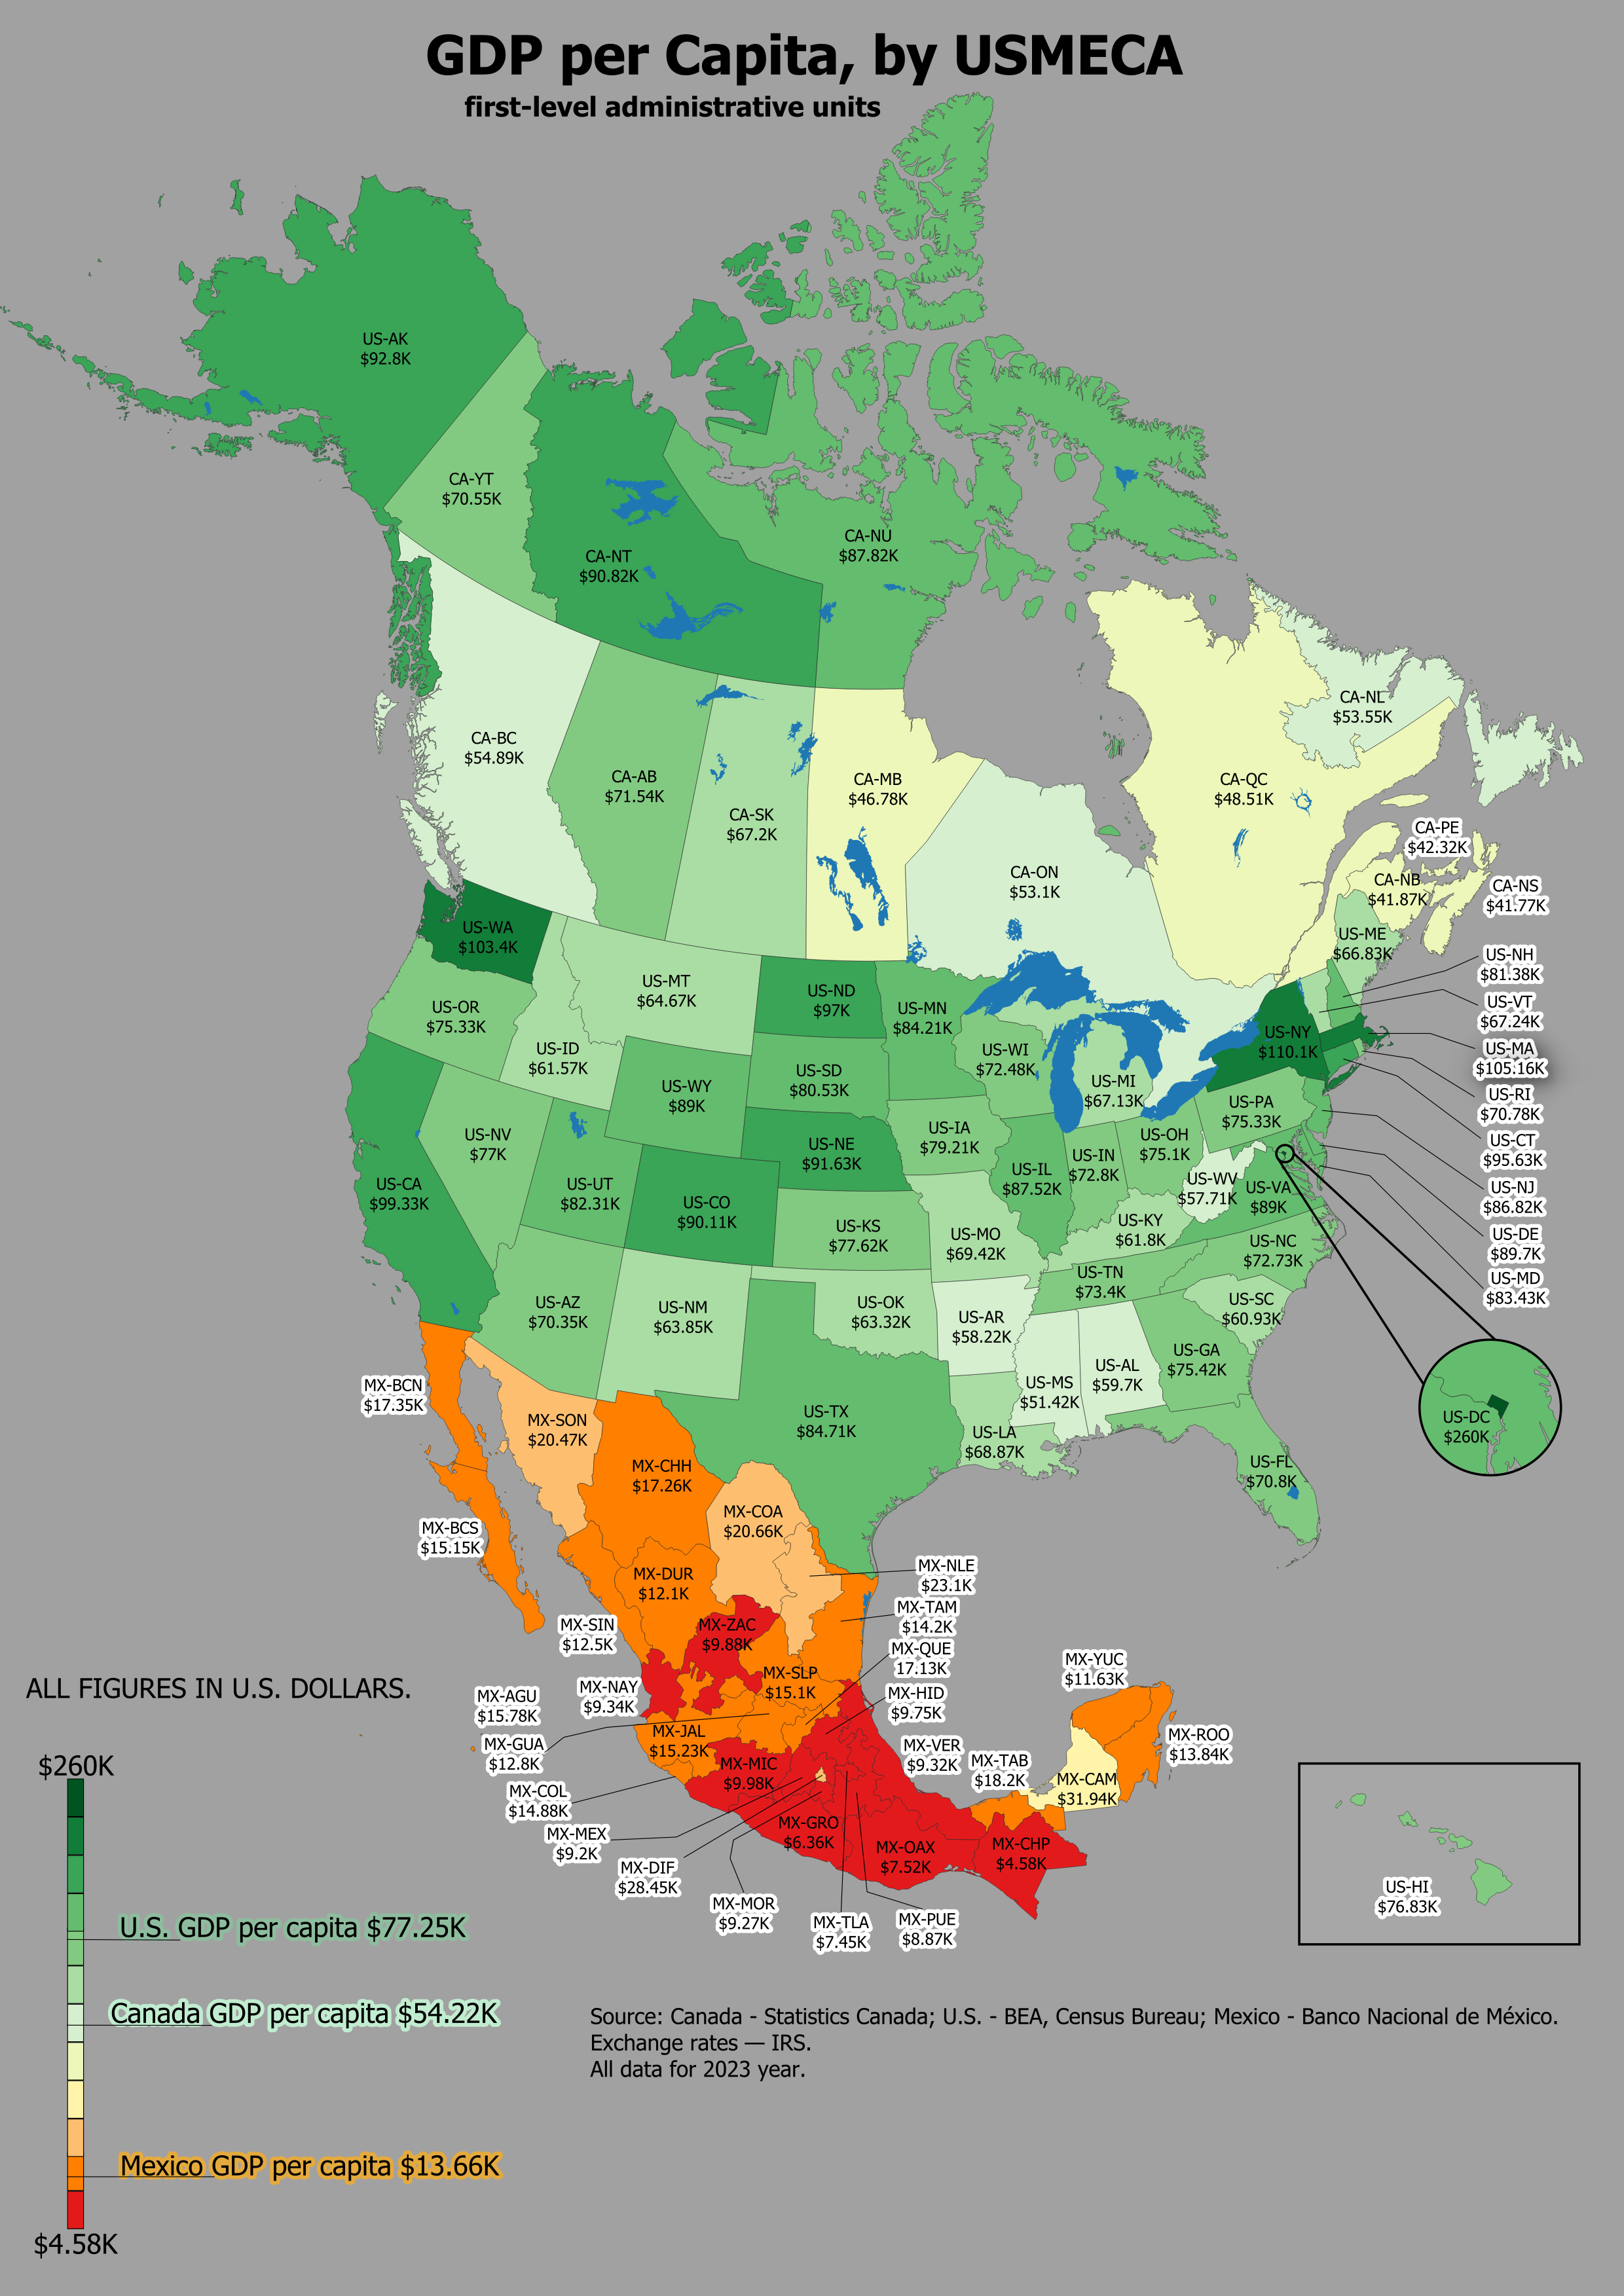
GDP Per Capita by USMECA Map
The visualization titled 'GDP per Capita, by USMECA first-level administrative units, 2023' highlights the economic perf...
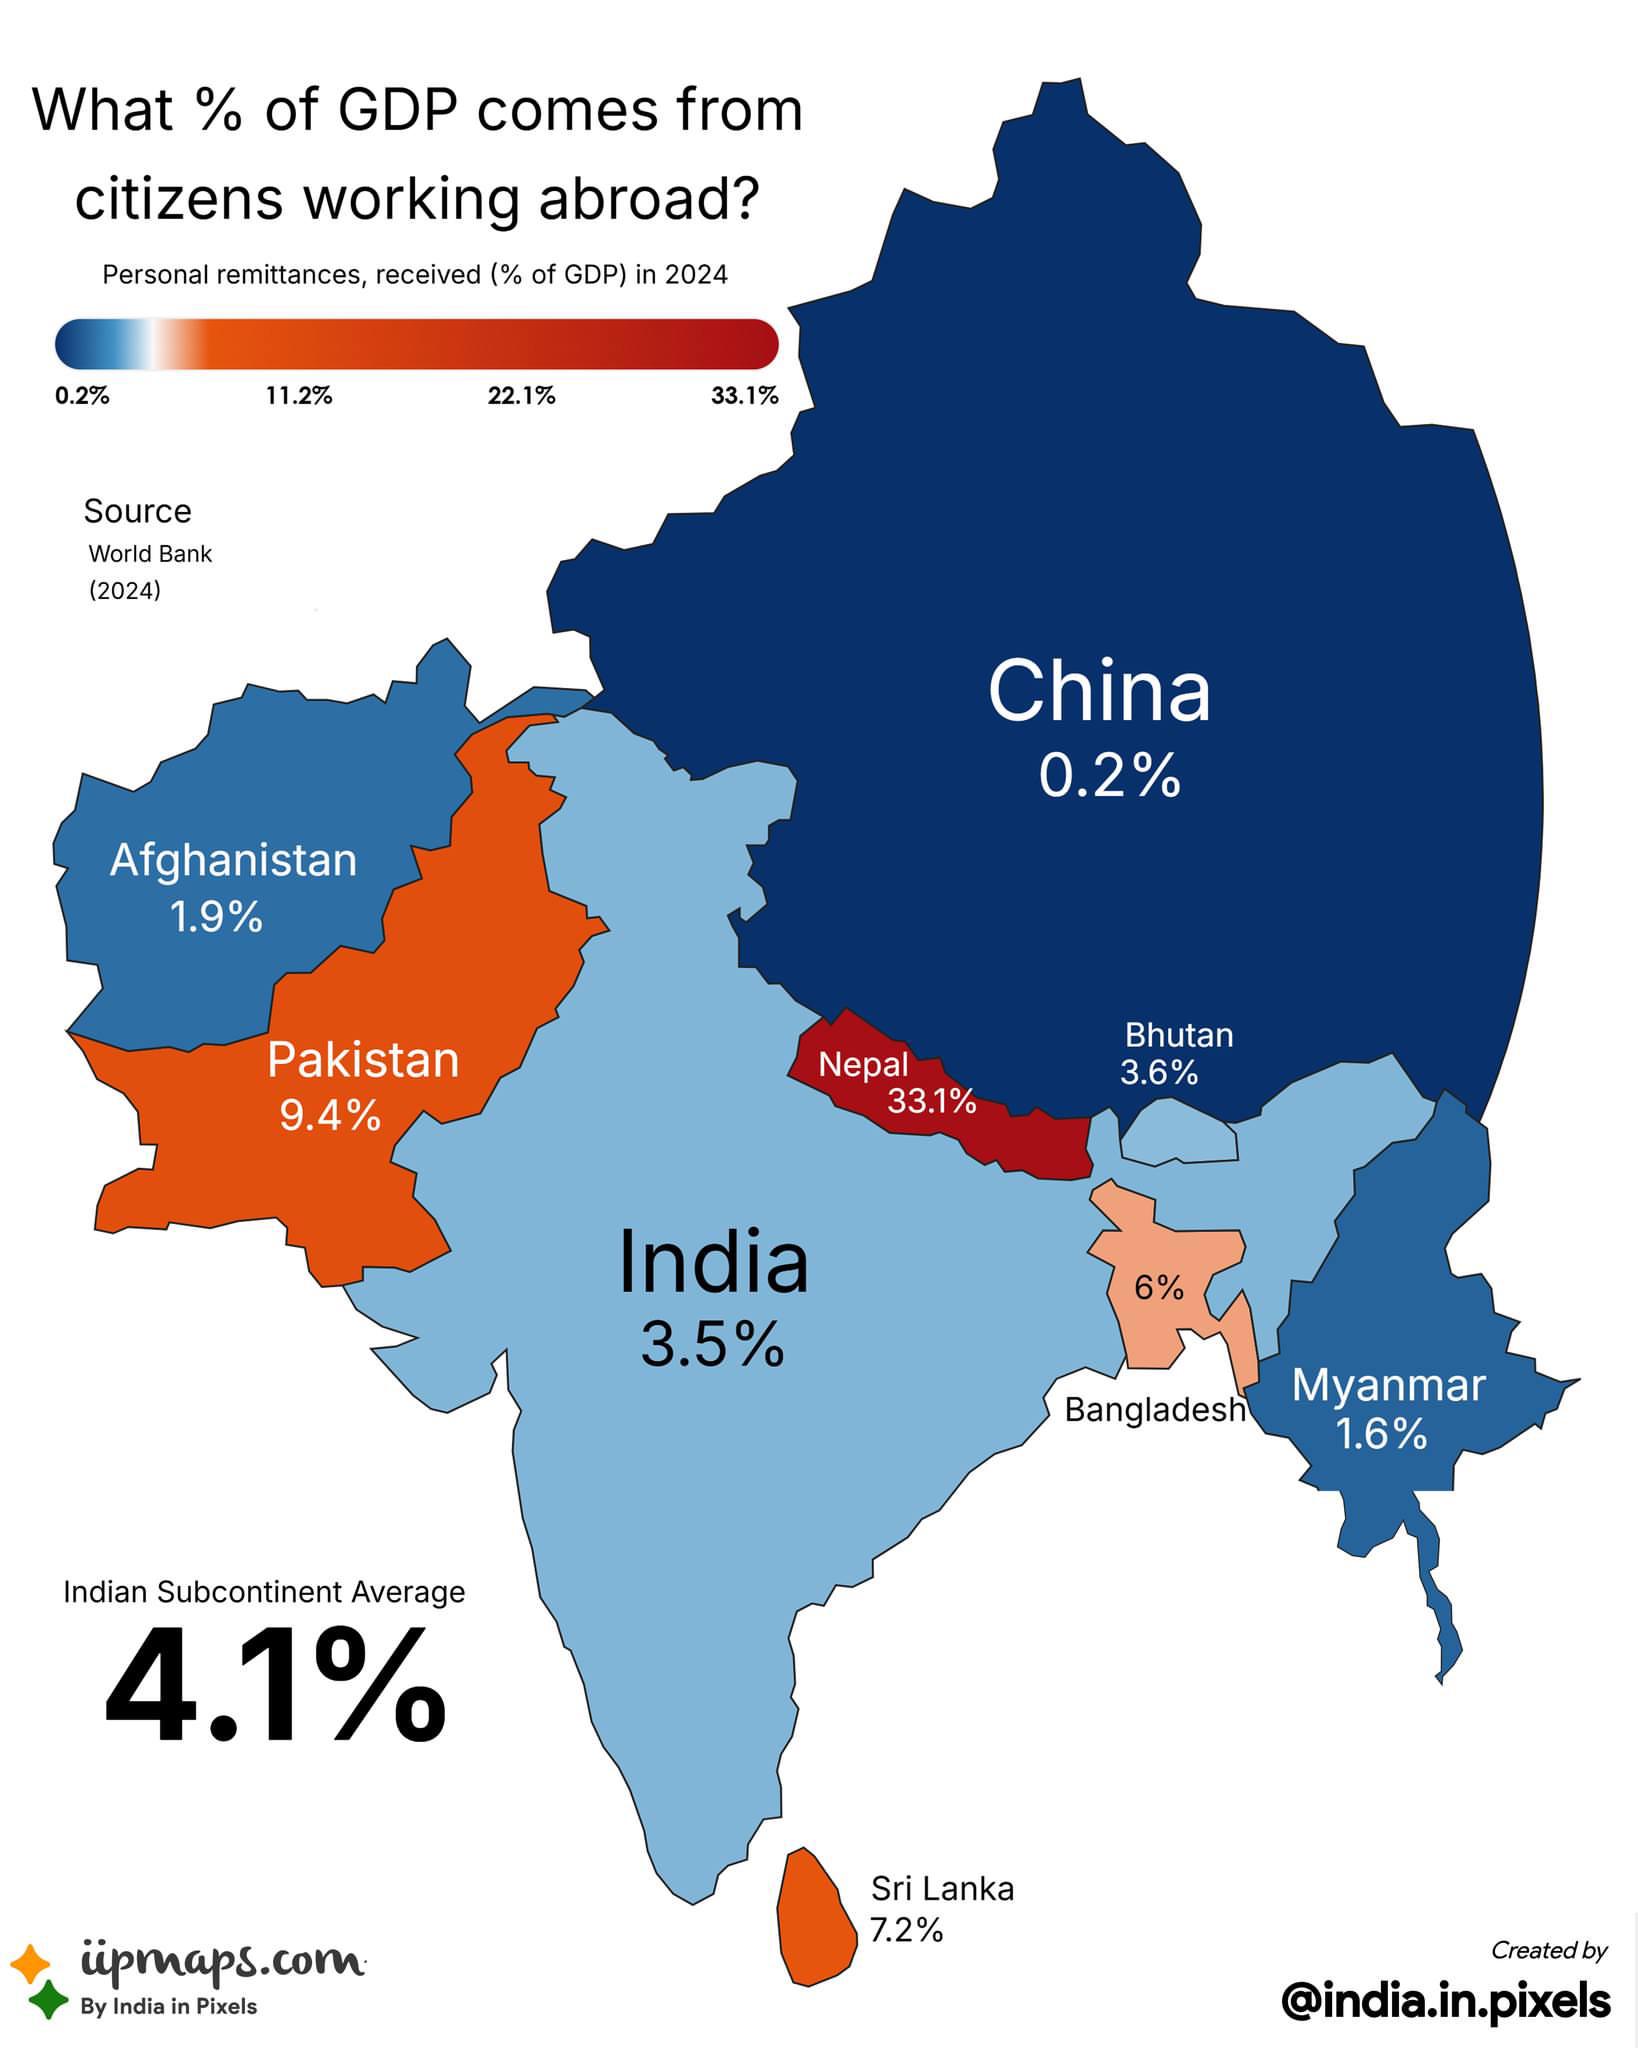
Foreign Remittance as Percentage of GDP Map
The dynamics of remittance flows are influenced by various factors, including labor market conditions, immigration polic...
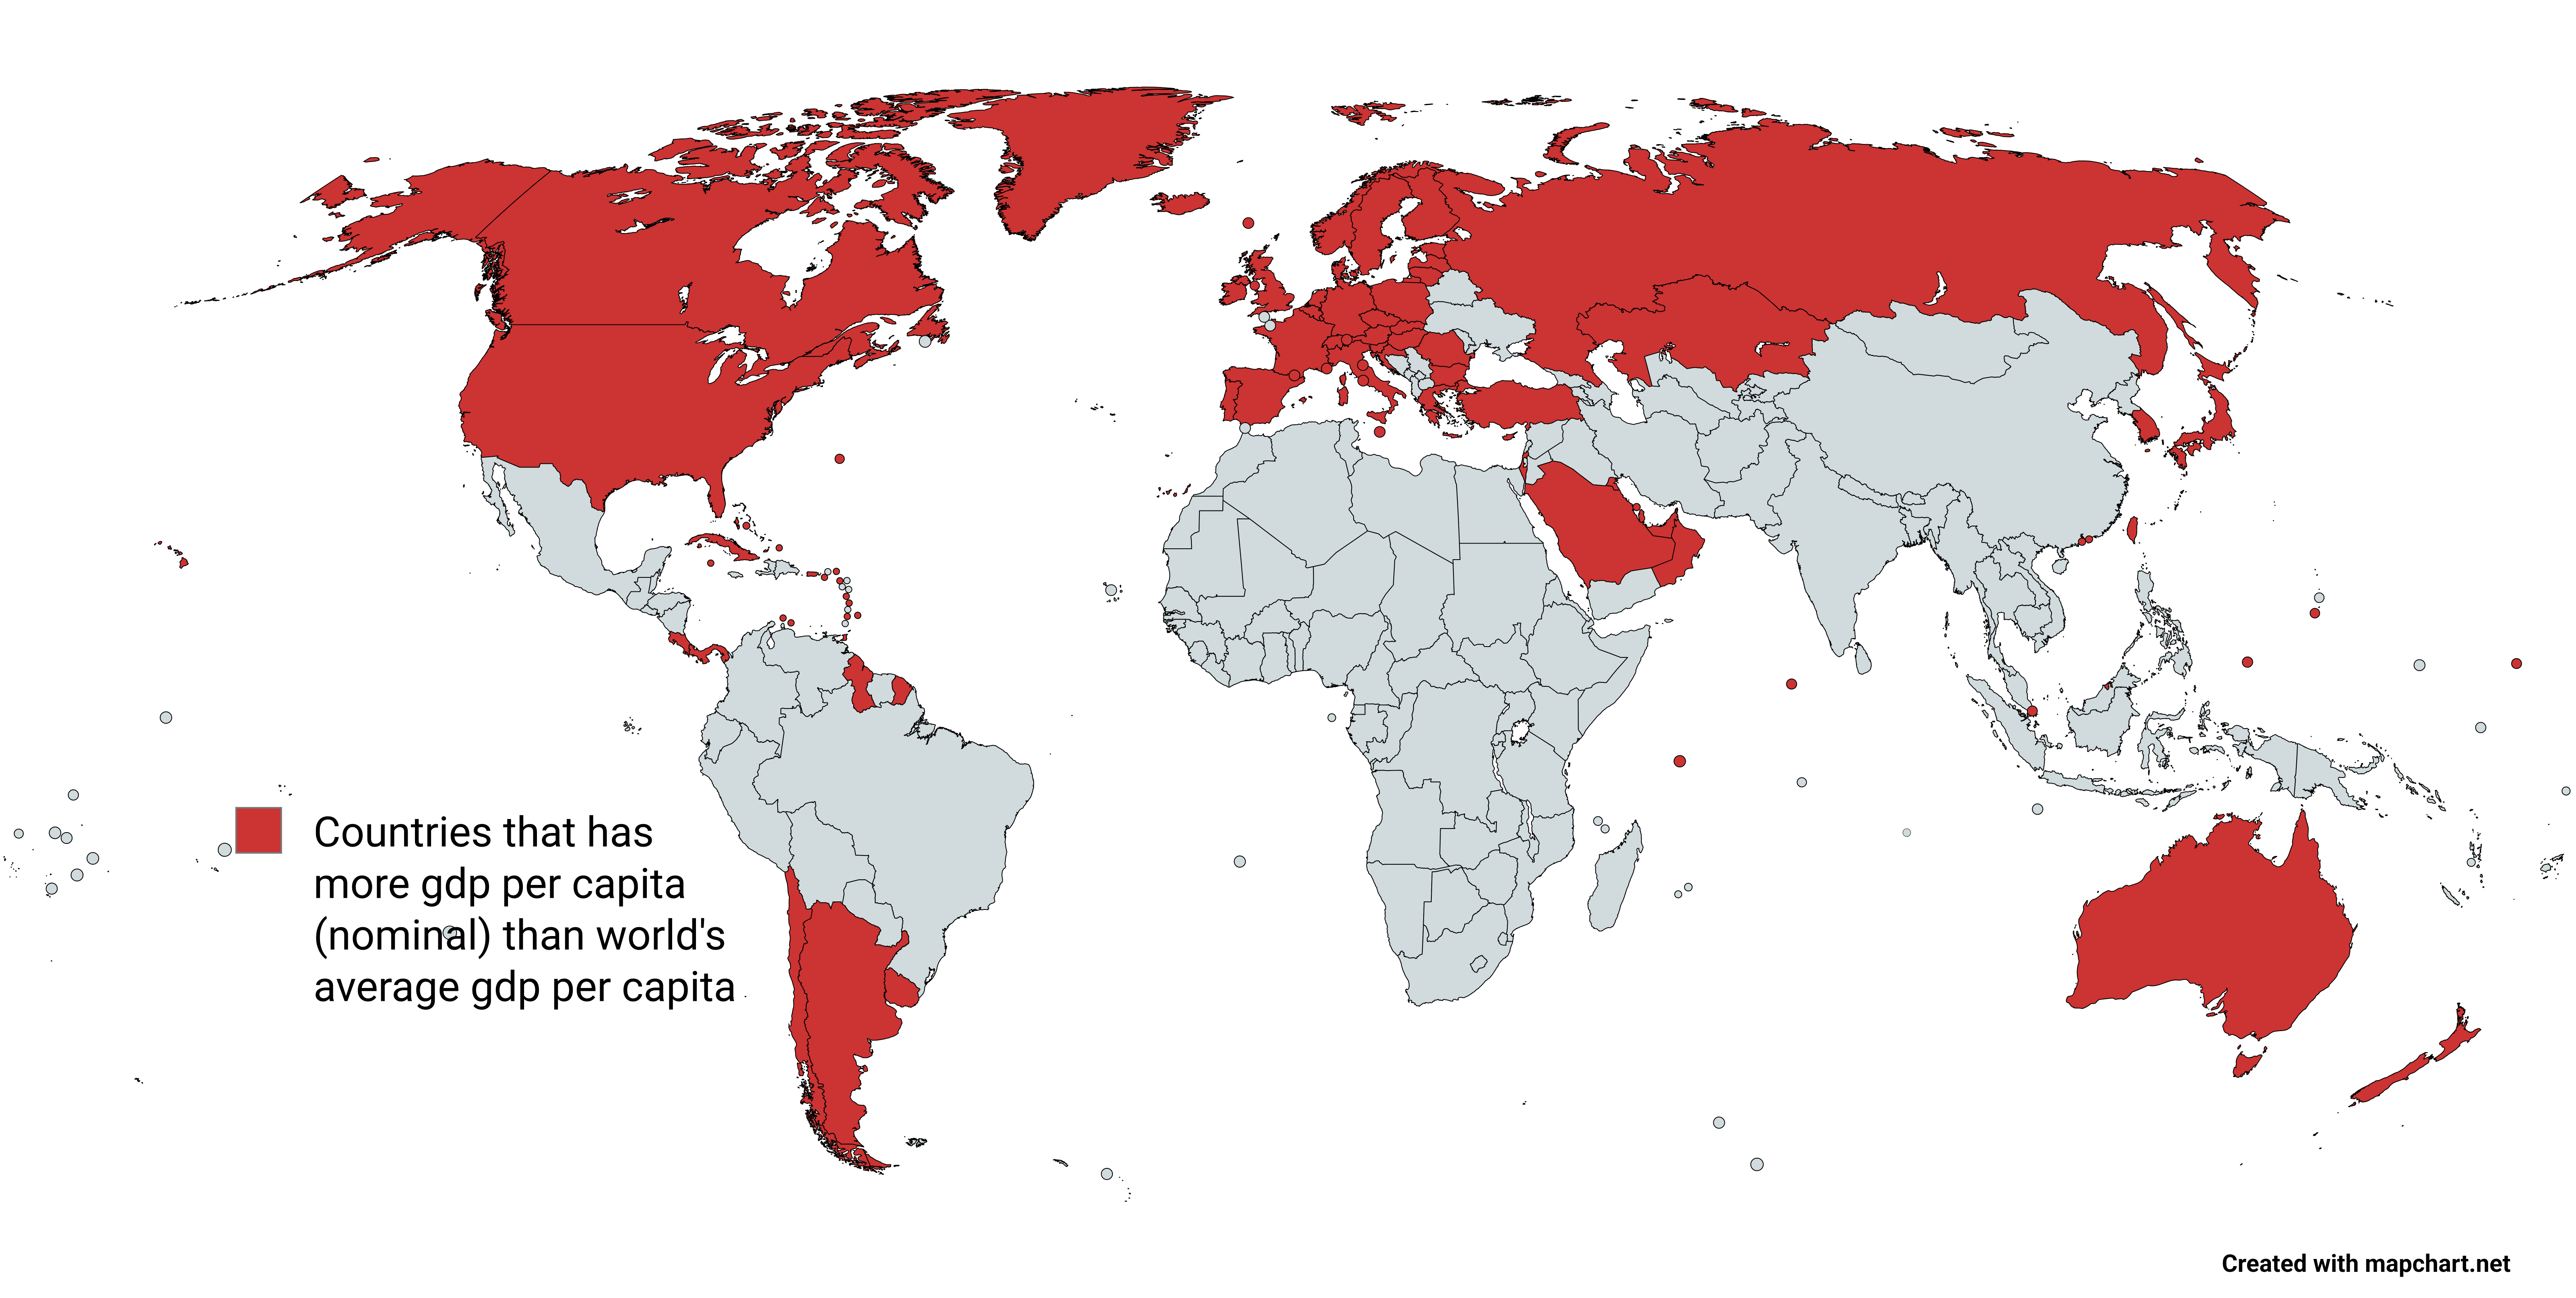
GDP Per Capita by Country Map
This map provides a clear visual representation of the countries with a GDP per capita exceeding the world’s average, wh...
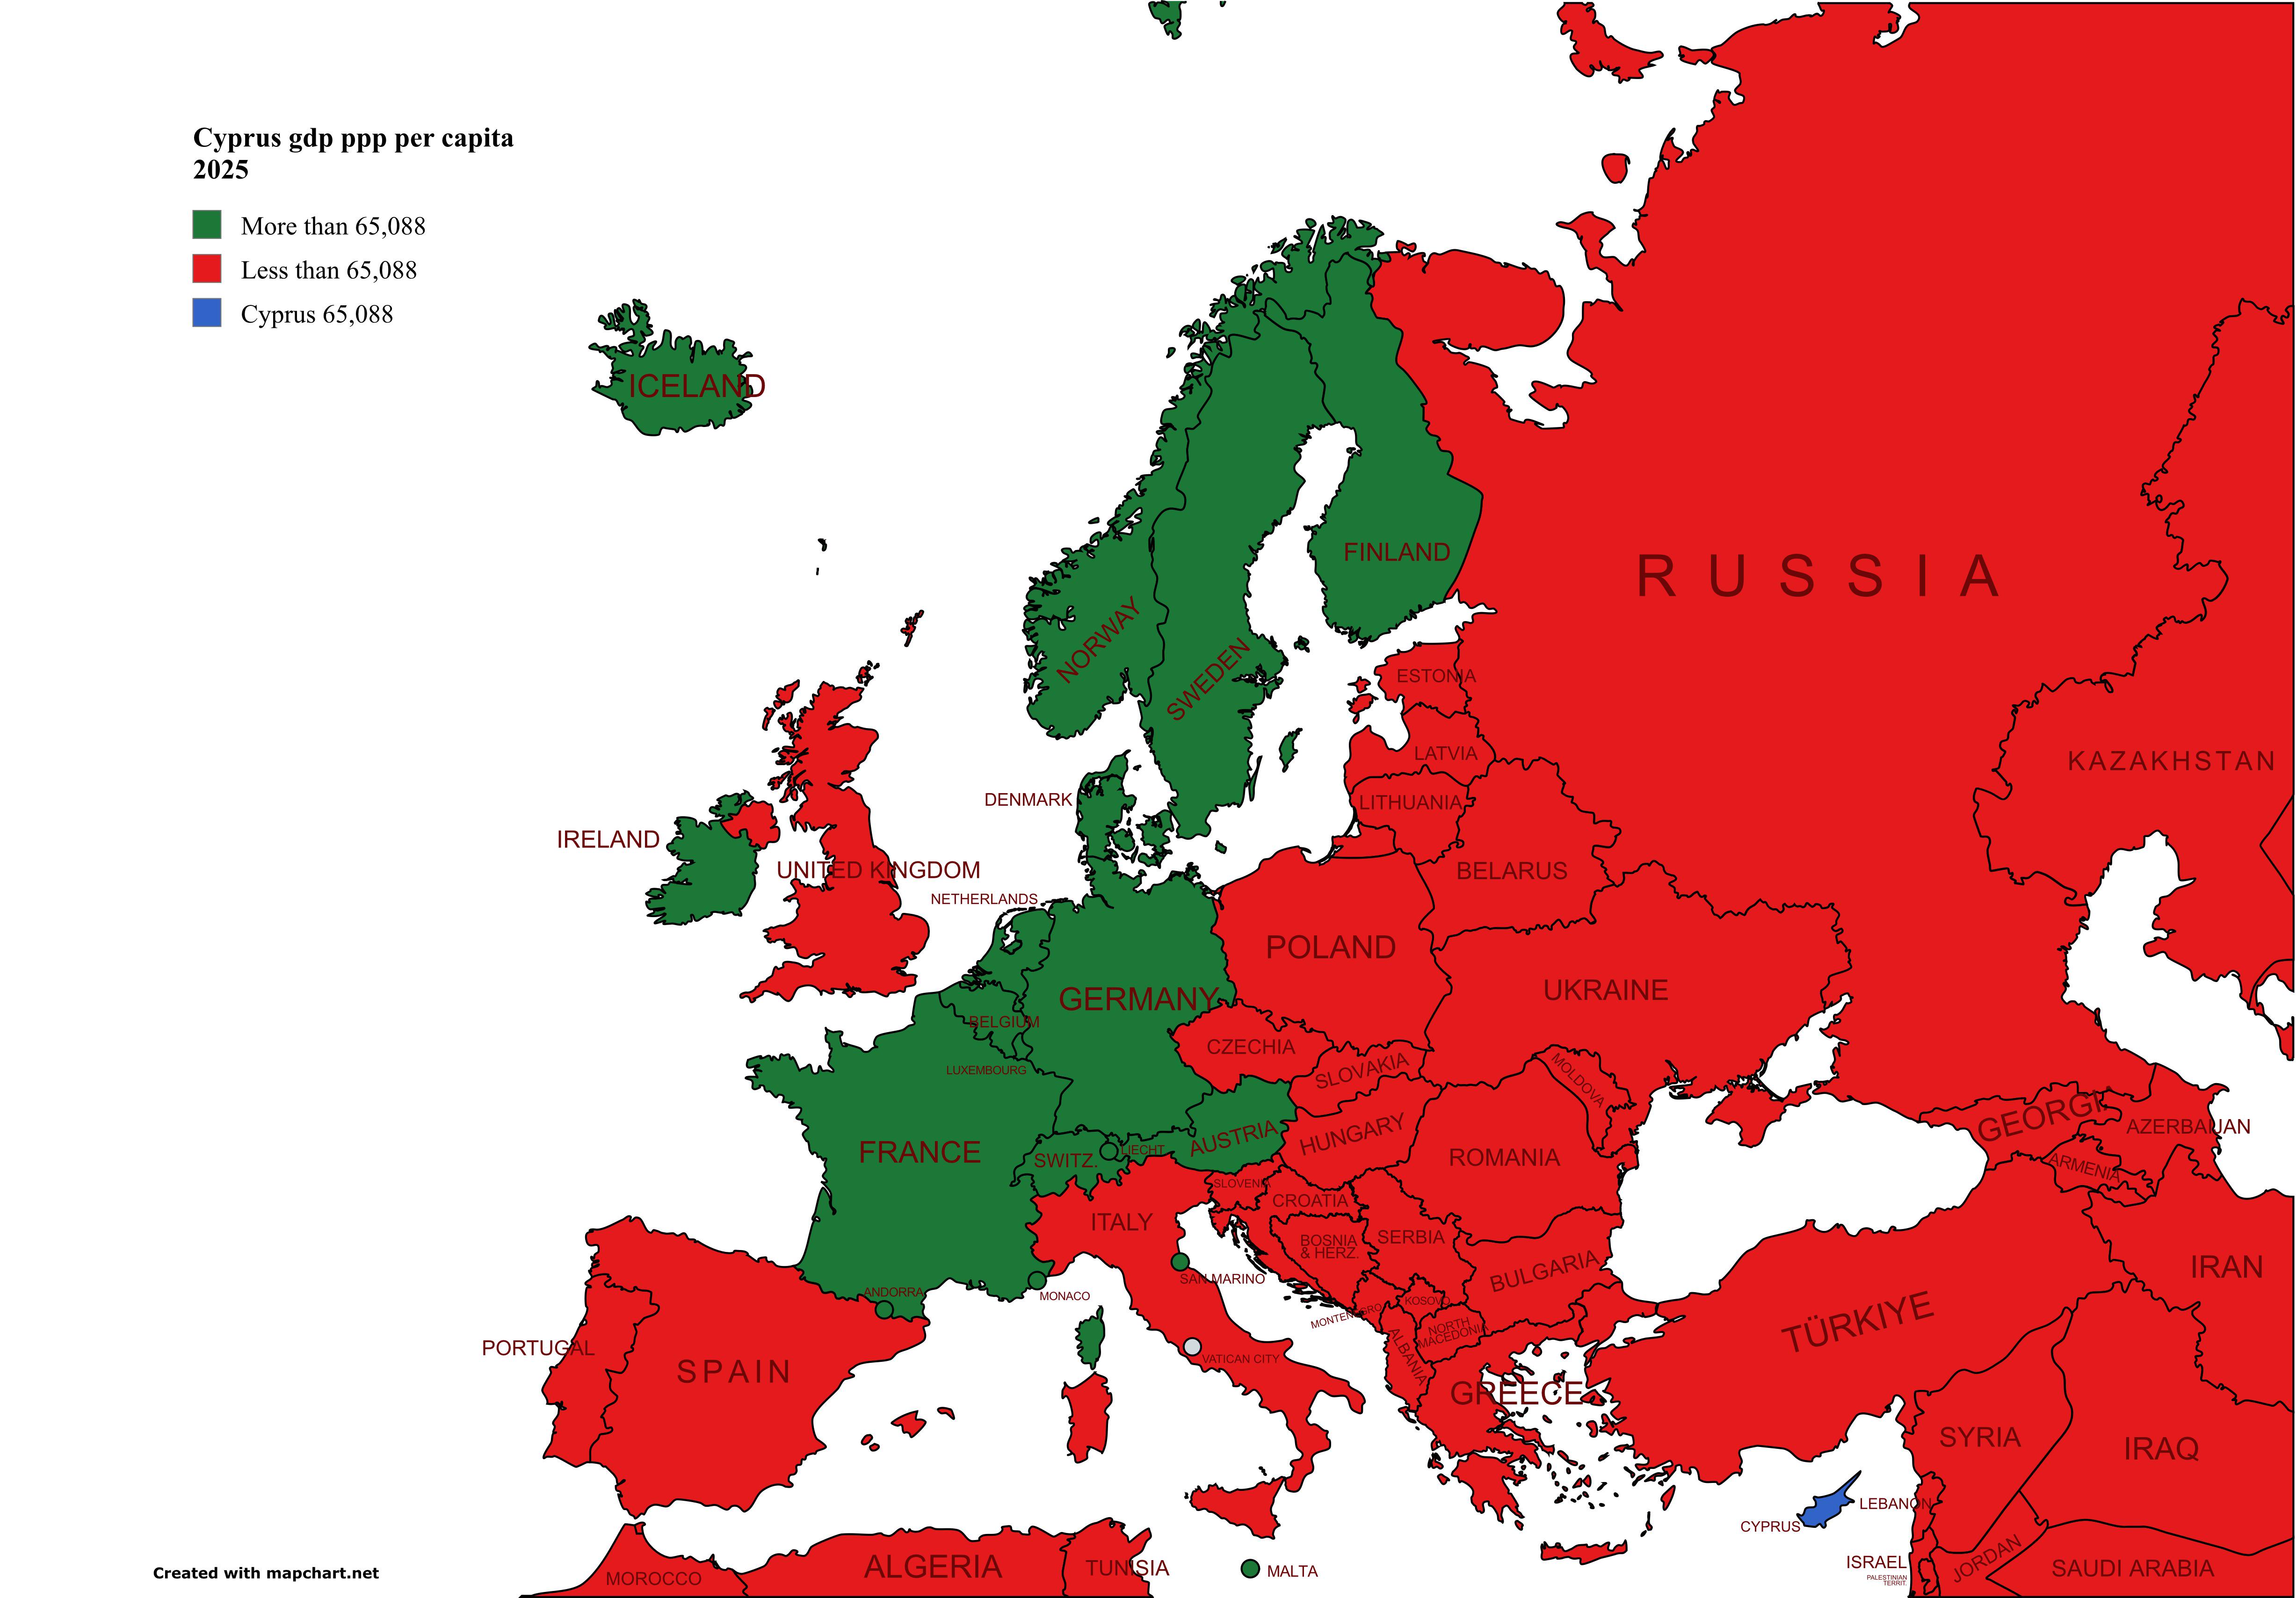
GDP Per Capita by Country Map
The visualization titled "European and Neighboring Countries Compared to Cyprus by GDP (PPP) per Capita – IMF 2025" prov...
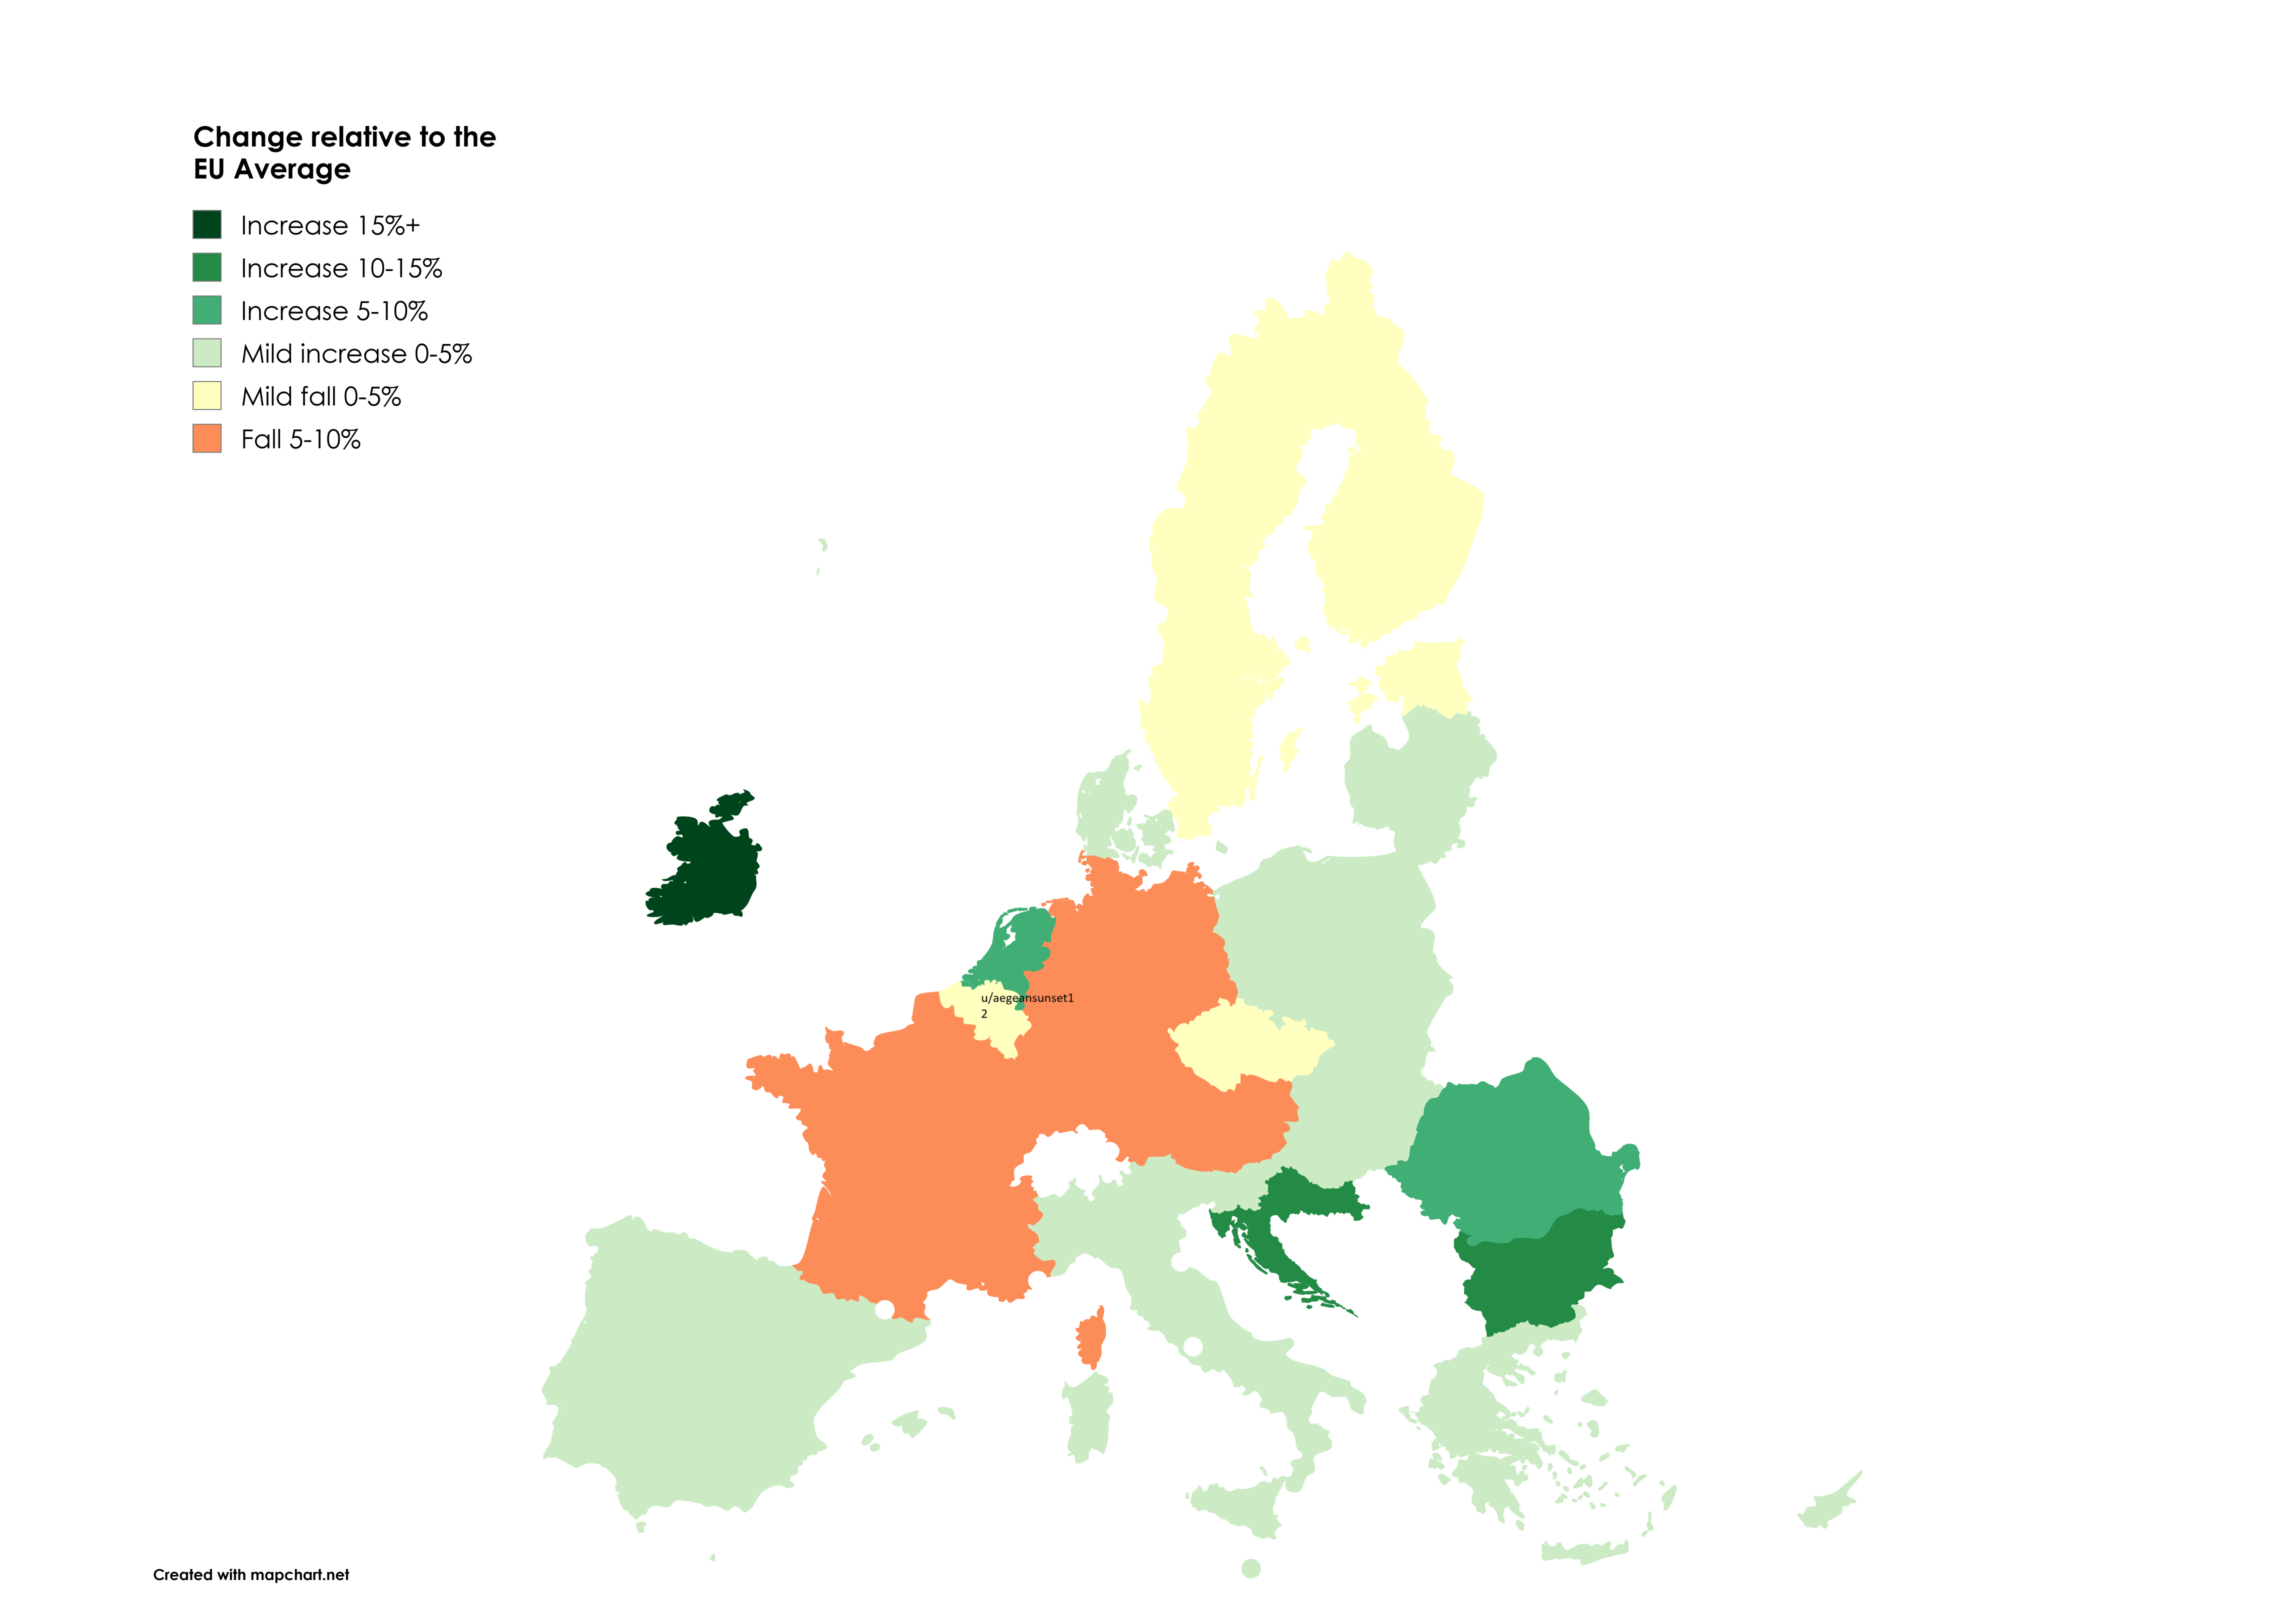
GDP Per Capita Compared to EU Average Map
The visualization titled "Europe in Flux: How COVID, Inflation, and War Reshaped GDP Per Capita vs EU Average (2019-2024...
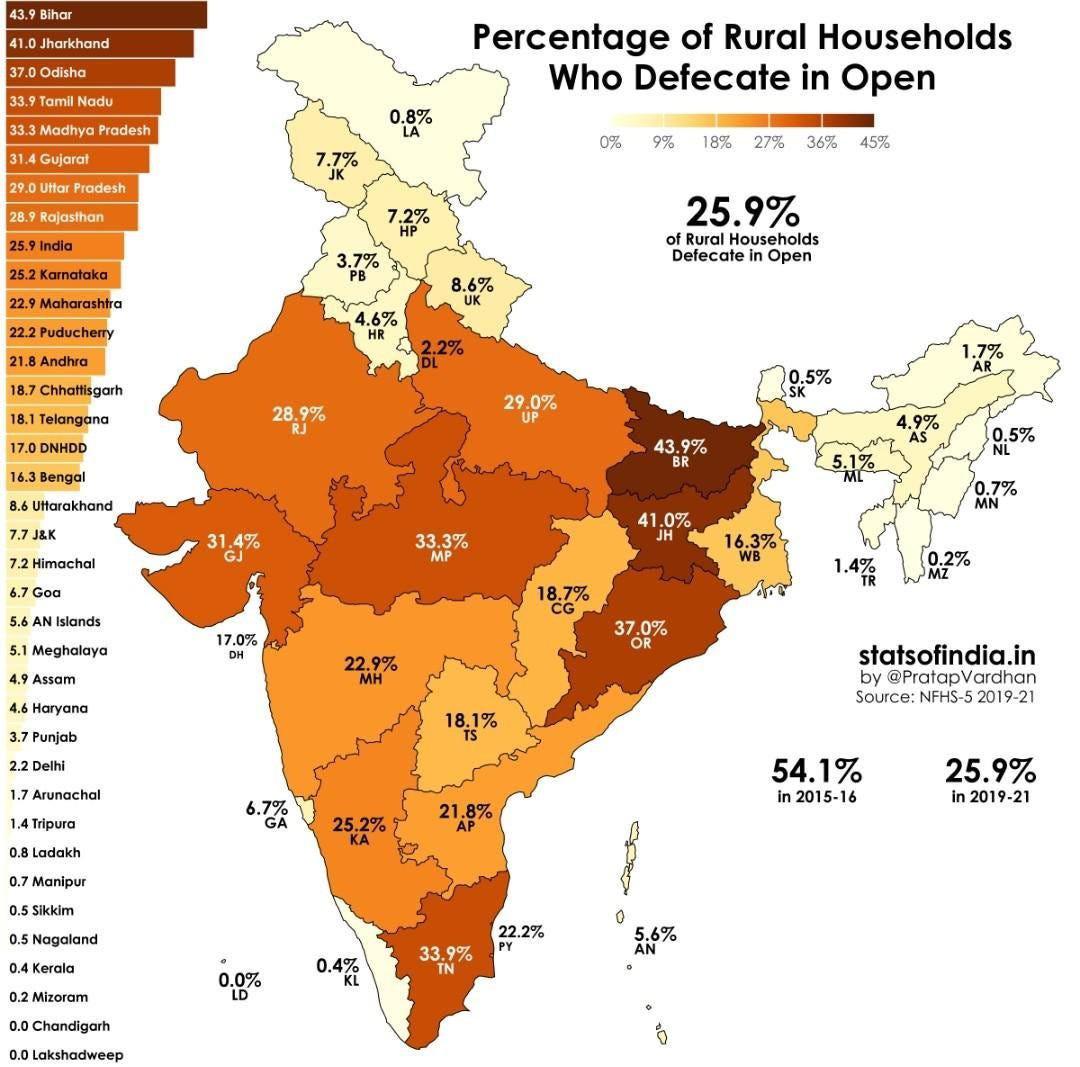
Economic Improvement Map by Country
The visualization titled "Shit’s crazy but I guess they are improving" offers an intriguing glimpse into economic improv...
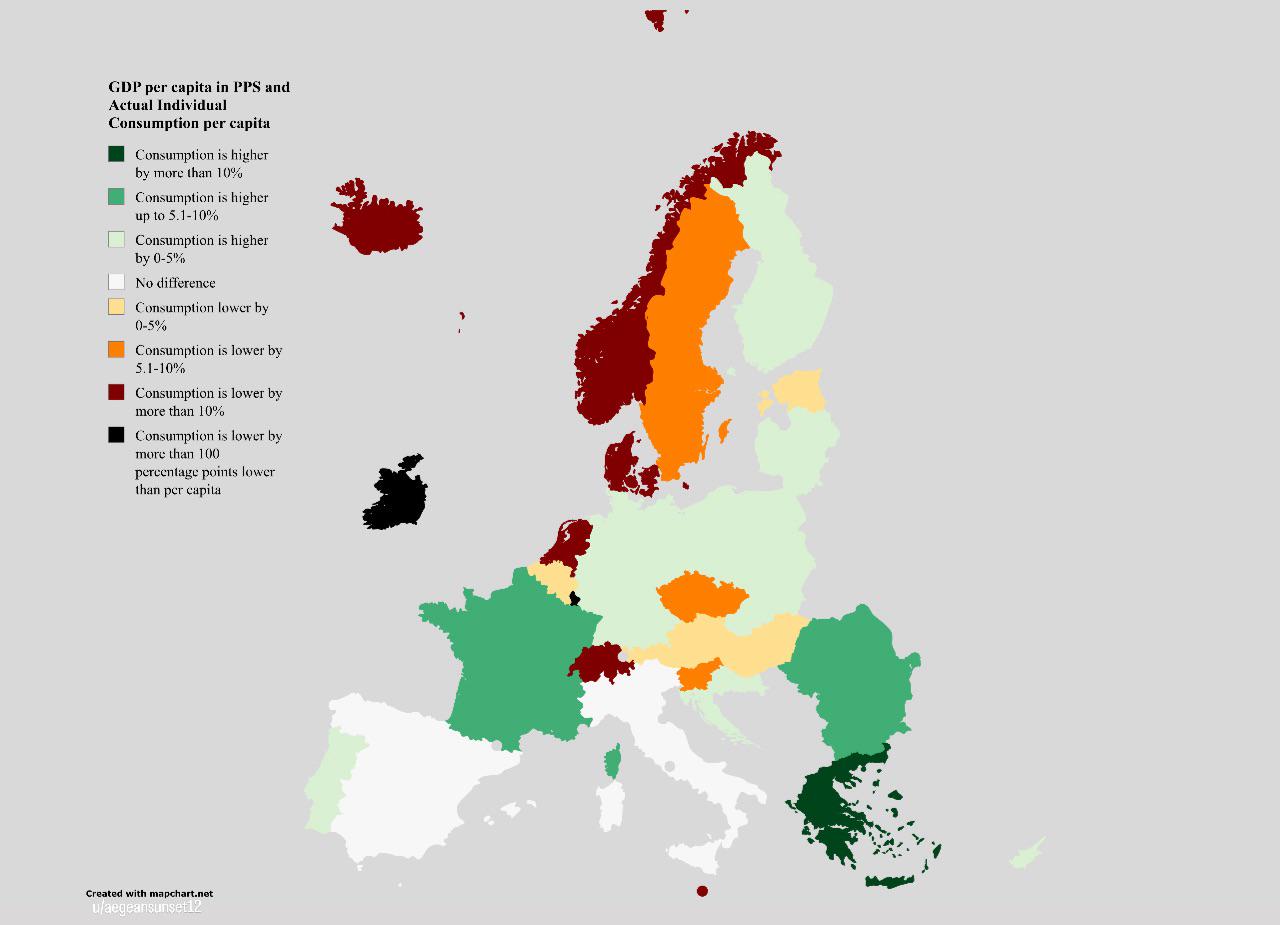
GDP vs. Consumption Map in the EU
The visualization titled "Paper Wealth vs. Plate Wealth: GDP vs. Consumption in the EU" provides an insightful compariso...