GDP Per Capita (PPP) in Europe Map

David Chen
Data Visualization Specialist
David Chen is an expert in transforming complex geographic datasets into compelling visual narratives. He combines his background in computer science ...
Geographic Analysis
What This Map Shows
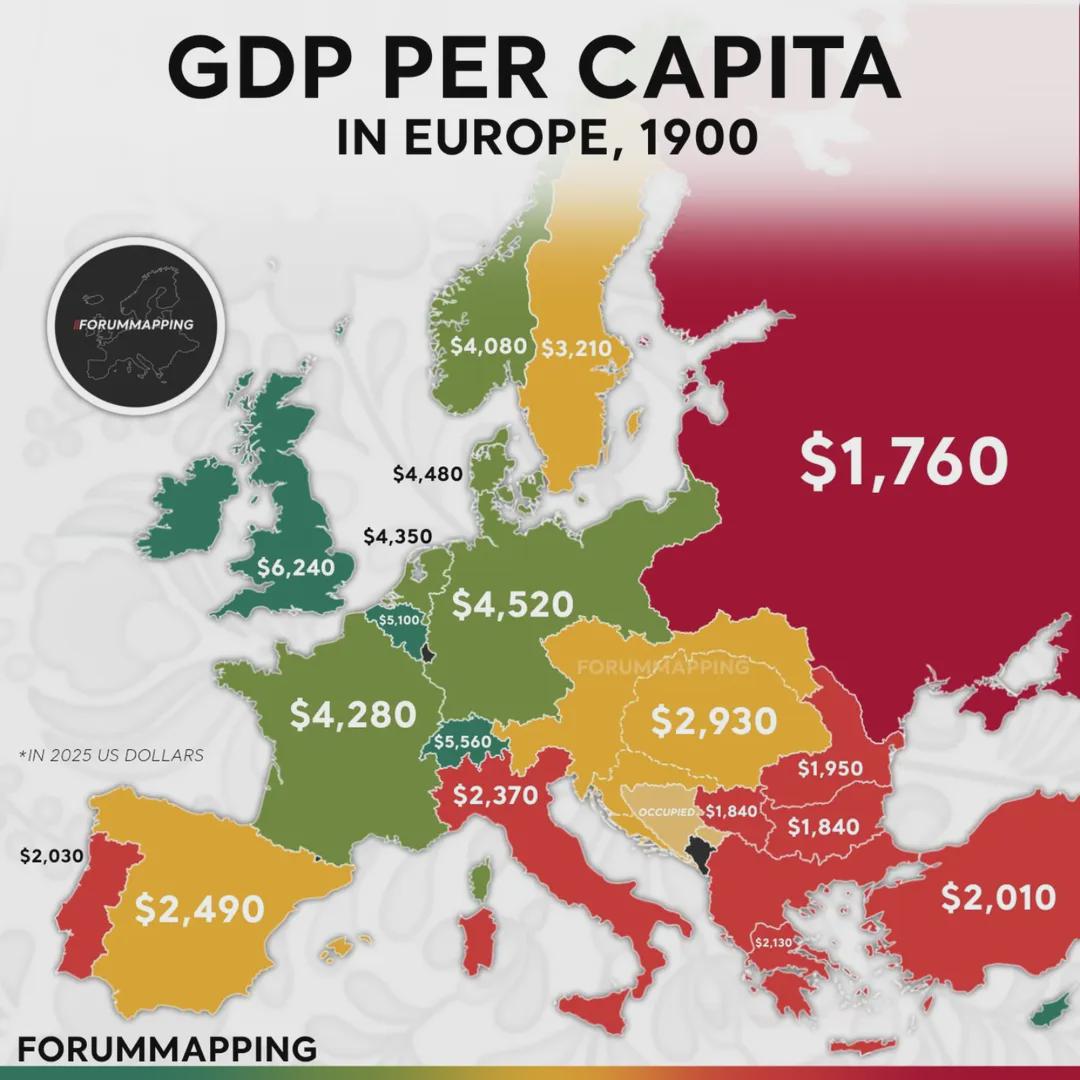
The map titled "GDP per Capita (PPP) in Europe (1900)" provides a compelling snapshot of economic disparities across the continent at the turn of the 20th century. By using Purchasing Power Parity (PPP) to measure GDP per capita, this visualization allows us to understand not just the wealth of nations, but how that wealth translates into purchasing power for individuals. As we look at this map, we see varying shades representing different levels of economic output per person, revealing the economic landscape of Europe in a period marked by significant social and political changes.
Deep Dive into GDP and Economic Disparities
Gross Domestic Product (GDP) is a critical indicator that economists use to gauge the economic performance of a country. However, when measured in nominal terms, GDP can be misleading due to differences in the cost of living and inflation rates. This is where Purchasing Power Parity (PPP) comes into play. By adjusting GDP figures based on local purchasing power, we can achieve a more accurate reflection of living standards and economic well-being.
In 1900, Europe was experiencing profound transformations. The Industrial Revolution was in full swing, leading to significant urbanization and economic growth, particularly in Western European countries. Interestingly, countries like the United Kingdom and Germany stood out with notably high GDP per capita figures, reflecting their advanced industrial economies. For instance, the UK, with its burgeoning textile industry and expansive trade networks, showcased a robust economic output, while Germany's rapid industrialization positioned it as a European powerhouse.
Conversely, Eastern European nations such as Poland and Russia exhibited much lower GDP per capita figures. These disparities were largely due to their agrarian economies, which lagged in industrial development during this period. The stark contrast between Western and Eastern Europe not only highlights economic divisions but also foreshadows the geopolitical tensions that would arise in the following decades.
What's fascinating is that these historical economic patterns have long-lasting implications. Many of the wealth disparities from over a century ago still echo in today’s economic landscape, influencing everything from migration patterns to regional development policies.
Regional Analysis
When we break down the map by region, it is evident that Western Europe was the economic leader in 1900. Countries like France, the Netherlands, and Belgium displayed higher GDP per capita, indicating a strong industrial base and a relatively high standard of living. For example, Belgium, with its rich resources and developed manufacturing sector, thrived economically, showcasing a GDP per capita that was significantly higher than many of its neighbors.
In contrast, Southern Europe, including nations like Italy and Spain, showed moderate GDP per capita figures. These countries were still transitioning from agrarian economies and faced challenges such as political instability and slower industrial growth compared to their northern counterparts.
Eastern Europe presented a stark picture of economic struggle. Nations like Hungary and the Balkans were primarily agrarian, and their GDP per capita reflected this reality. The economic lag in these regions can be attributed to a variety of factors, including lack of access to capital, underdeveloped infrastructure, and historical political challenges.
Significance and Impact
Understanding the GDP per capita (PPP) in Europe in 1900 is not merely an academic exercise; it provides insight into the socio-economic fabric of the continent. These historical economic conditions served as precursors to many of the conflicts and alliances that would shape Europe in the 20th century, including two World Wars.
Today, as we navigate a global economy increasingly defined by technology and globalization, the economic disparities highlighted in this map remind us of the importance of equitable development. Current trends indicate that while some nations have made significant strides in closing the economic gap, others continue to face challenges that hinder their growth potential.
As we reflect on the lessons from the past, one might wonder how today’s economic policies can be influenced by historical data. The shifts in GDP per capita can serve as a roadmap for addressing current inequalities and ensuring that the prosperity of one region does not come at the expense of another. Understanding these economic dynamics is crucial for policymakers and scholars alike as we strive for a more balanced and equitable future across Europe and beyond.
Visualization Details
- Published
- August 10, 2025
- Views
- 88
Comments
Loading comments...