Map of Countries with Lower GDP Per Capita than Mississippi

Alex Cartwright
Senior Cartographer & GIS Specialist
Alex Cartwright is a renowned cartographer and geographic information systems specialist with over 15 years of experience in spatial analysis and data...
Geographic Analysis
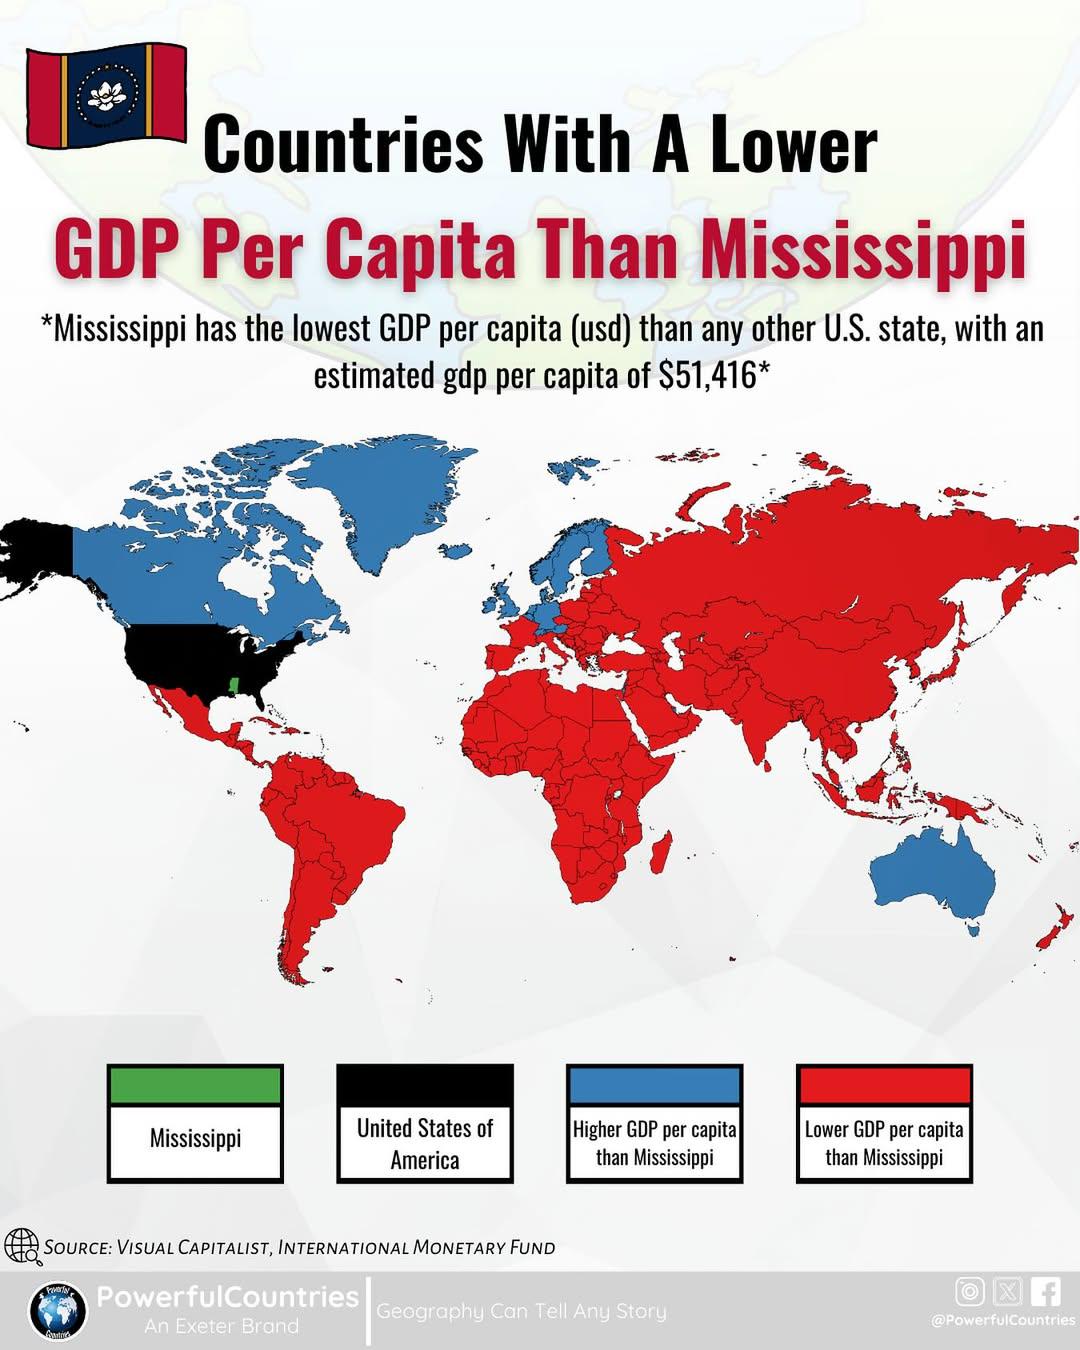
What This Map Shows
This map provides a striking visual representation of countries whose GDP per capita falls below that of Mississippi, which currently stands at approximately $48,000. It highlights a range of nations, particularly in regions like sub-Saharan Africa, South Asia, and parts of Latin America. This visualization prompts an essential conversation about economic disparities and the factors influencing wealth distribution globally.
Deep Dive into GDP Per Capita
Gross Domestic Product (GDP) per capita is a crucial indicator of a country's economic performance, representing the average economic output per person. It serves as a vital measure of living standards and economic well-being. Interestingly, while Mississippi may be a state within the United States, its GDP per capita surpasses that of several countries, showcasing significant economic disparities on a global scale.
The GDP per capita figure is calculated by dividing the country's GDP by its population. A higher GDP per capita typically correlates with better living standards, access to healthcare, education, and overall quality of life. For instance, countries like Burundi, South Sudan, and Malawi appear on this map with GDP per capita figures that are significantly lower than Mississippi’s. These nations often face challenges such as political instability, limited access to resources, and inadequate infrastructure.
For example, Burundi, one of the poorest countries in the world, has a GDP per capita of around $265. This stark contrast emphasizes the economic struggles faced by many in the nation. Factors contributing to such low GDP include high population growth rates, reliance on subsistence agriculture, and limited access to international markets. Additionally, historical elements, such as colonial legacies, have left lasting impacts on their economic structures.
Moreover, South Sudan, a nation that has been embroiled in conflict since its independence in 2011, has a GDP per capita of approximately $300. The ongoing civil war has severely hampered economic development and has led to a humanitarian crisis, illustrating how conflict can devastate a nation’s economic potential.
Interestingly, the countries that fall below Mississippi’s GDP per capita are not just limited to the poorest regions. Some nations in Latin America also feature in this category, demonstrating that economic challenges can arise in various forms and are not confined to a single continent.
Regional Analysis
When we dissect the map further, we can see patterns emerge in different regions. In sub-Saharan Africa, many countries, including the Democratic Republic of the Congo and Zimbabwe, have GDP per capita figures well below that of Mississippi. The challenges faced by these nations are multifaceted—ranging from resource management issues to governance and corruption.
In South Asia, countries like Afghanistan and Nepal also fall below Mississippi's GDP per capita. These nations struggle with poverty, limited industrialization, and, in some cases, geographical challenges that hinder economic growth. For instance, Nepal, despite its stunning natural beauty and potential for tourism, still grapples with infrastructural deficits that impede economic progress.
Latin America presents a different scenario, with nations like Nicaragua and Honduras showing lower GDP per capita figures. The economic struggles in these countries are often tied to political instability, historical inequalities, and challenges in governance. What's fascinating is that despite the vast resources in some of these nations, systemic issues prevent them from achieving higher economic outputs.
Significance and Impact
Understanding the implications of this map goes beyond mere statistics. It underscores the importance of addressing economic inequality on a global scale. The disparity in GDP per capita reveals not just economic challenges but also highlights issues such as poverty, education, and healthcare access. Countries with lower GDP per capita often face higher rates of malnutrition, limited educational opportunities, and poorer health outcomes.
The implications for global policy are significant. Addressing these disparities involves international cooperation, investment in infrastructure, and sustainable development initiatives. Interestingly, with the rise of global organizations focused on development, such as the United Nations and various NGOs, there is hope that targeted efforts can help lift these nations out of poverty and improve their GDP per capita.
As we look to the future, the trends suggest that while some regions may gradually see improvements, others may continue to struggle due to persistent challenges. Therefore, this map serves as a reminder of the work still needed to ensure equitable economic growth worldwide.
The disparities highlighted by this map also evoke questions about our interconnected world. Have you noticed that the global economy is often discussed in terms of averages, but these figures can obscure the realities faced by those living in lower GDP countries? Understanding the nuances behind these statistics is essential in addressing global poverty and fostering sustainable development.
Visualization Details
- Published
- September 13, 2025
- Views
- 68
Comments
Loading comments...