economics Maps
64 geographic visualizations tagged with "economics"
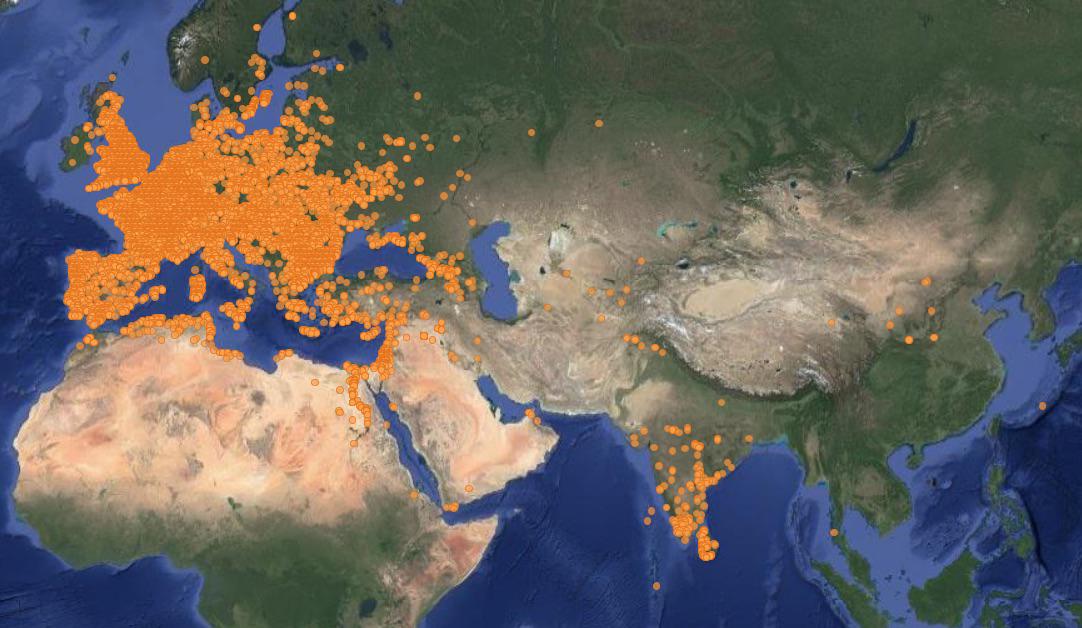
Map of Ancient Roman Coin Hoards Locations
This map provides a comprehensive visualization of every location where Ancient Roman coin hoards have been discovered a...
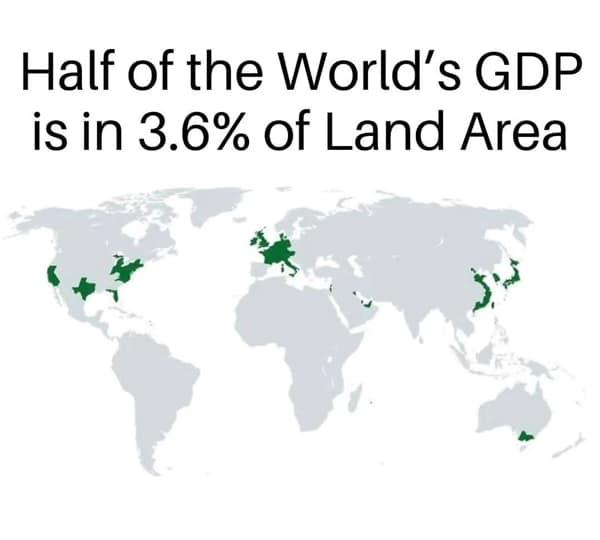
Global Economic Concentration Map
The "Global Economic Concentration Map" illustrates the distribution of economic activity across the globe, highlighting...
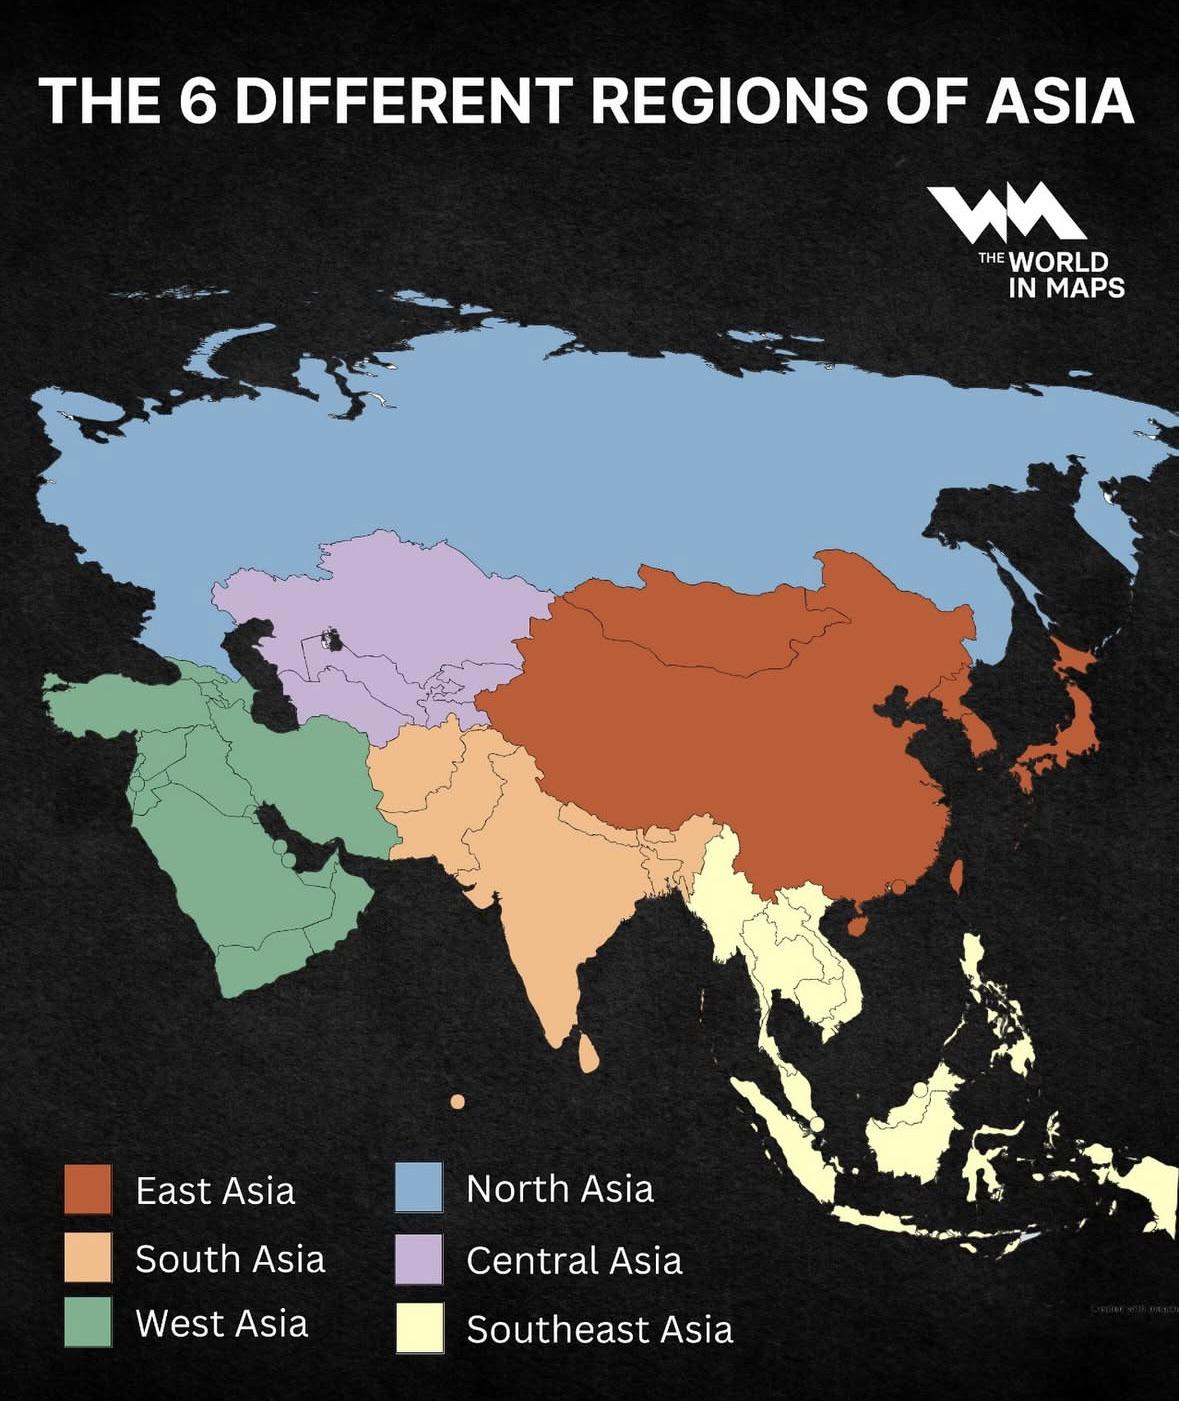
Regions of Asia Map
The "Regions of Asia Map" provides a comprehensive overview of the six distinct geographical regions that comprise the A...
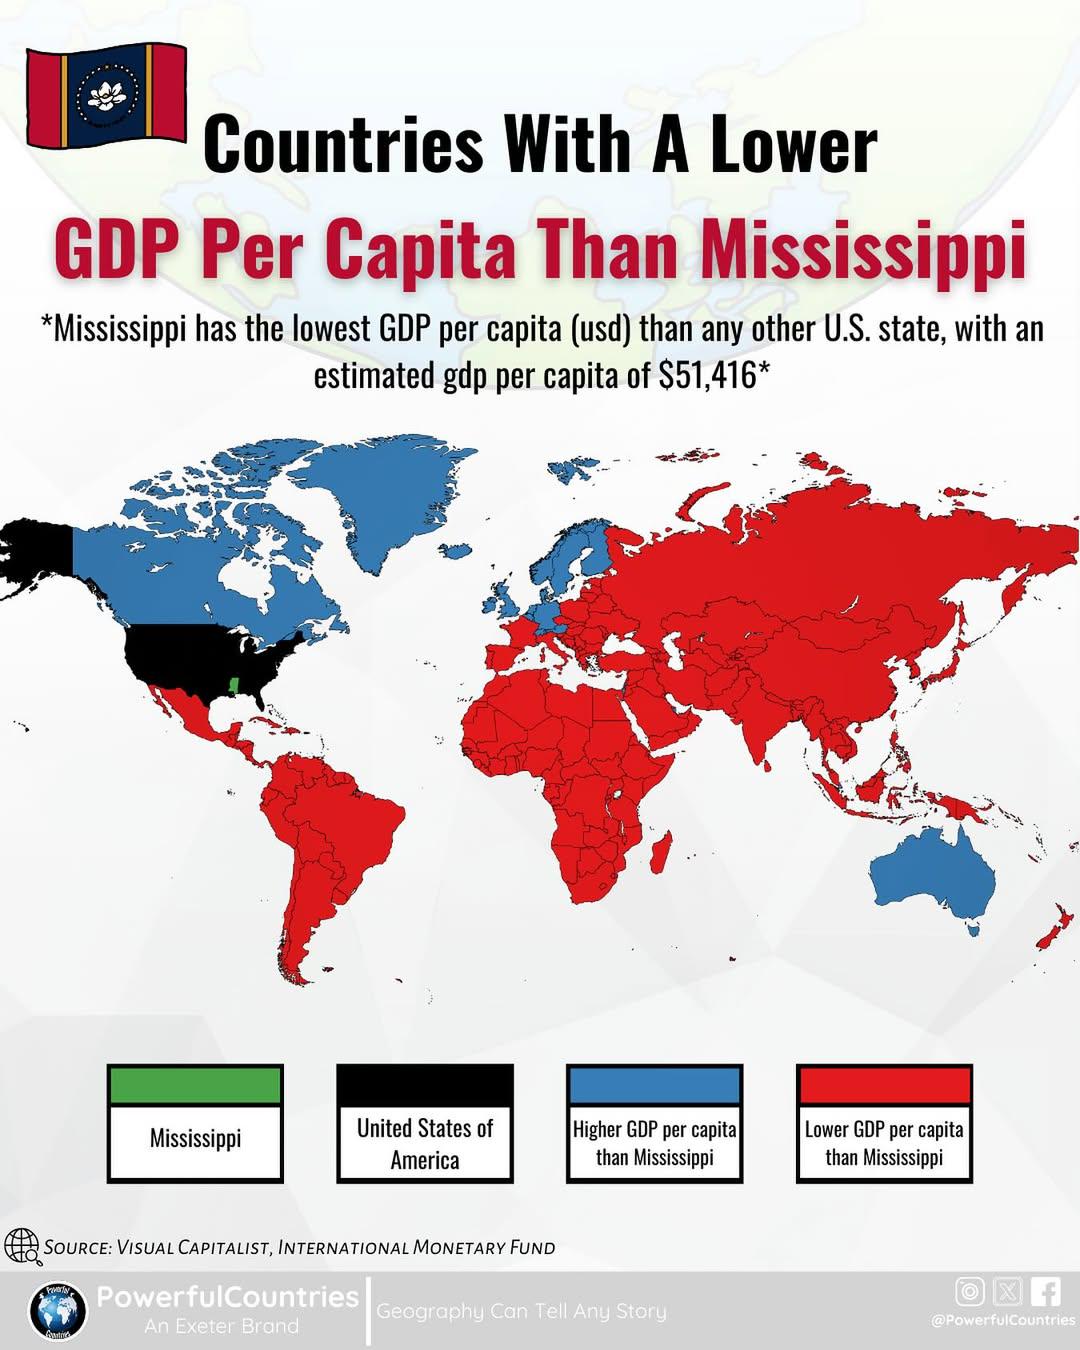
Map of Countries with Lower GDP Per Capita than Mississippi
This map provides a striking visual representation of countries whose GDP per capita falls below that of Mississippi, wh...
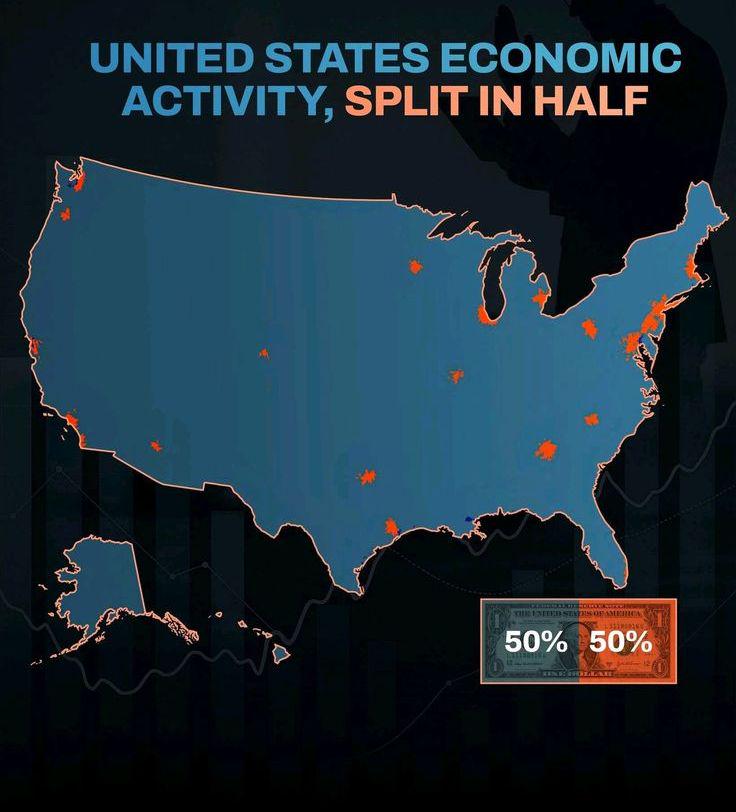
Metro Areas Economic Contribution Map
The visualization titled "Crazy how half the U.S. economy fits into a few metro areas" illustrates the concentration of ...

Alcohol Preferences Map by Country
The "Alcohol Preferences" map provides a visual representation of the various alcoholic beverages favored in different c...

Best and Worst US States by Overall Well-Being Map
This map provides a comprehensive overview of the overall well-being of each U.S. state, ranking them based on various f...
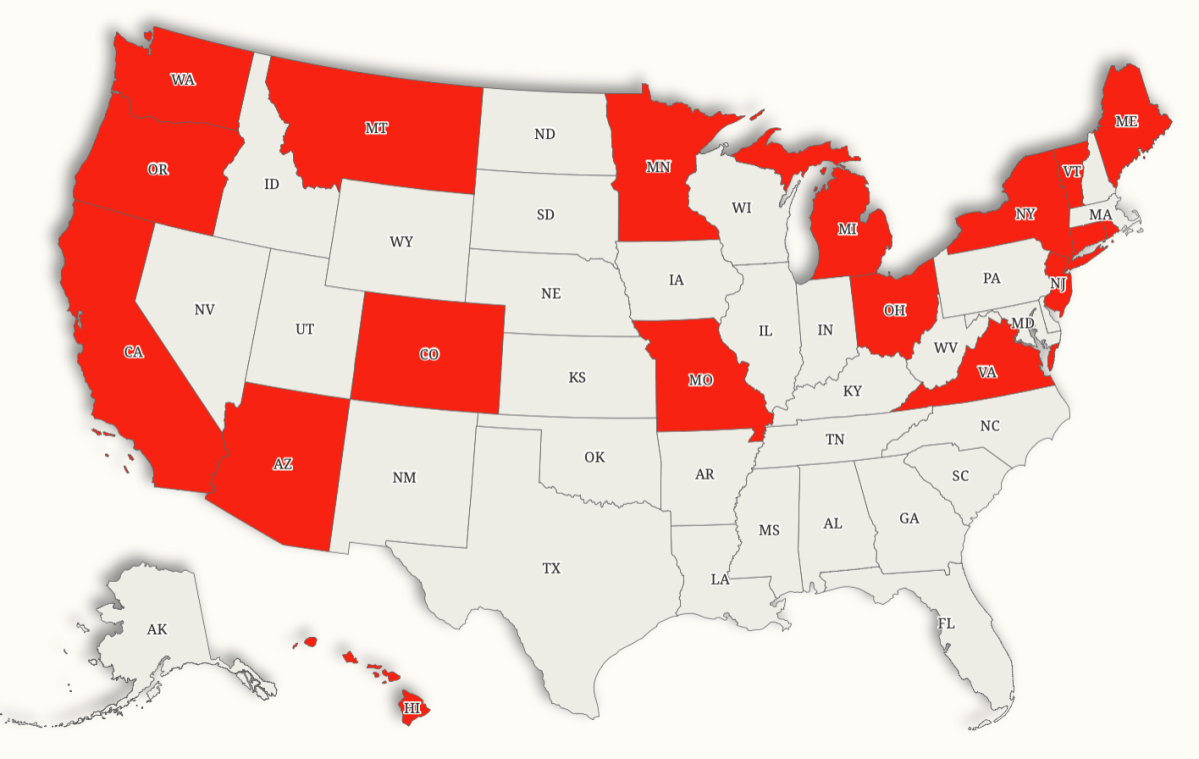
Minimum Wage Increases by State Map
This map illustrates the states in the U.S. that are scheduled to raise their minimum wage in 2026. It provides a clear ...
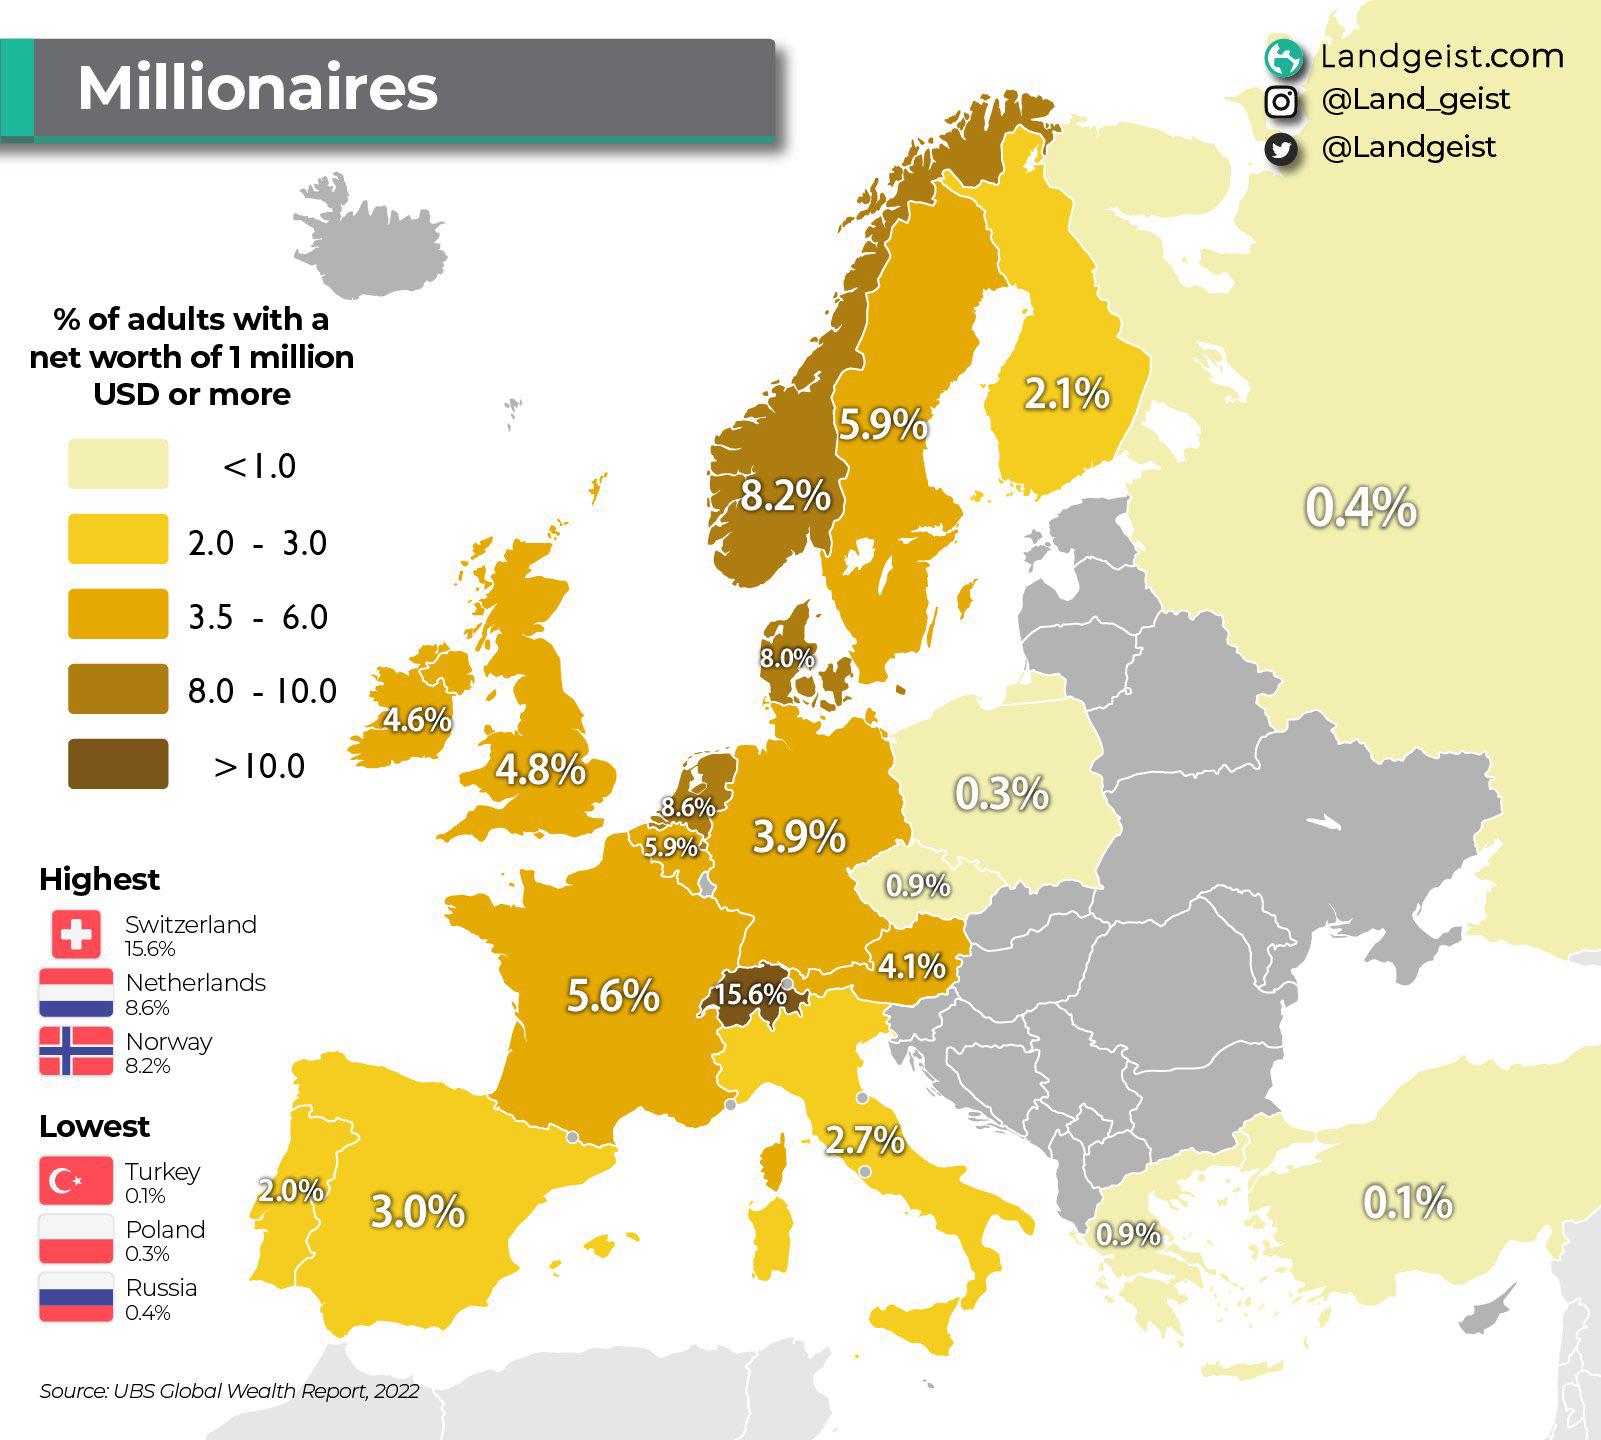
Millionaire Population Percentage Map of Europe
This map visualizes the percentage of millionaires within various European countries, offering a clear perspective on we...
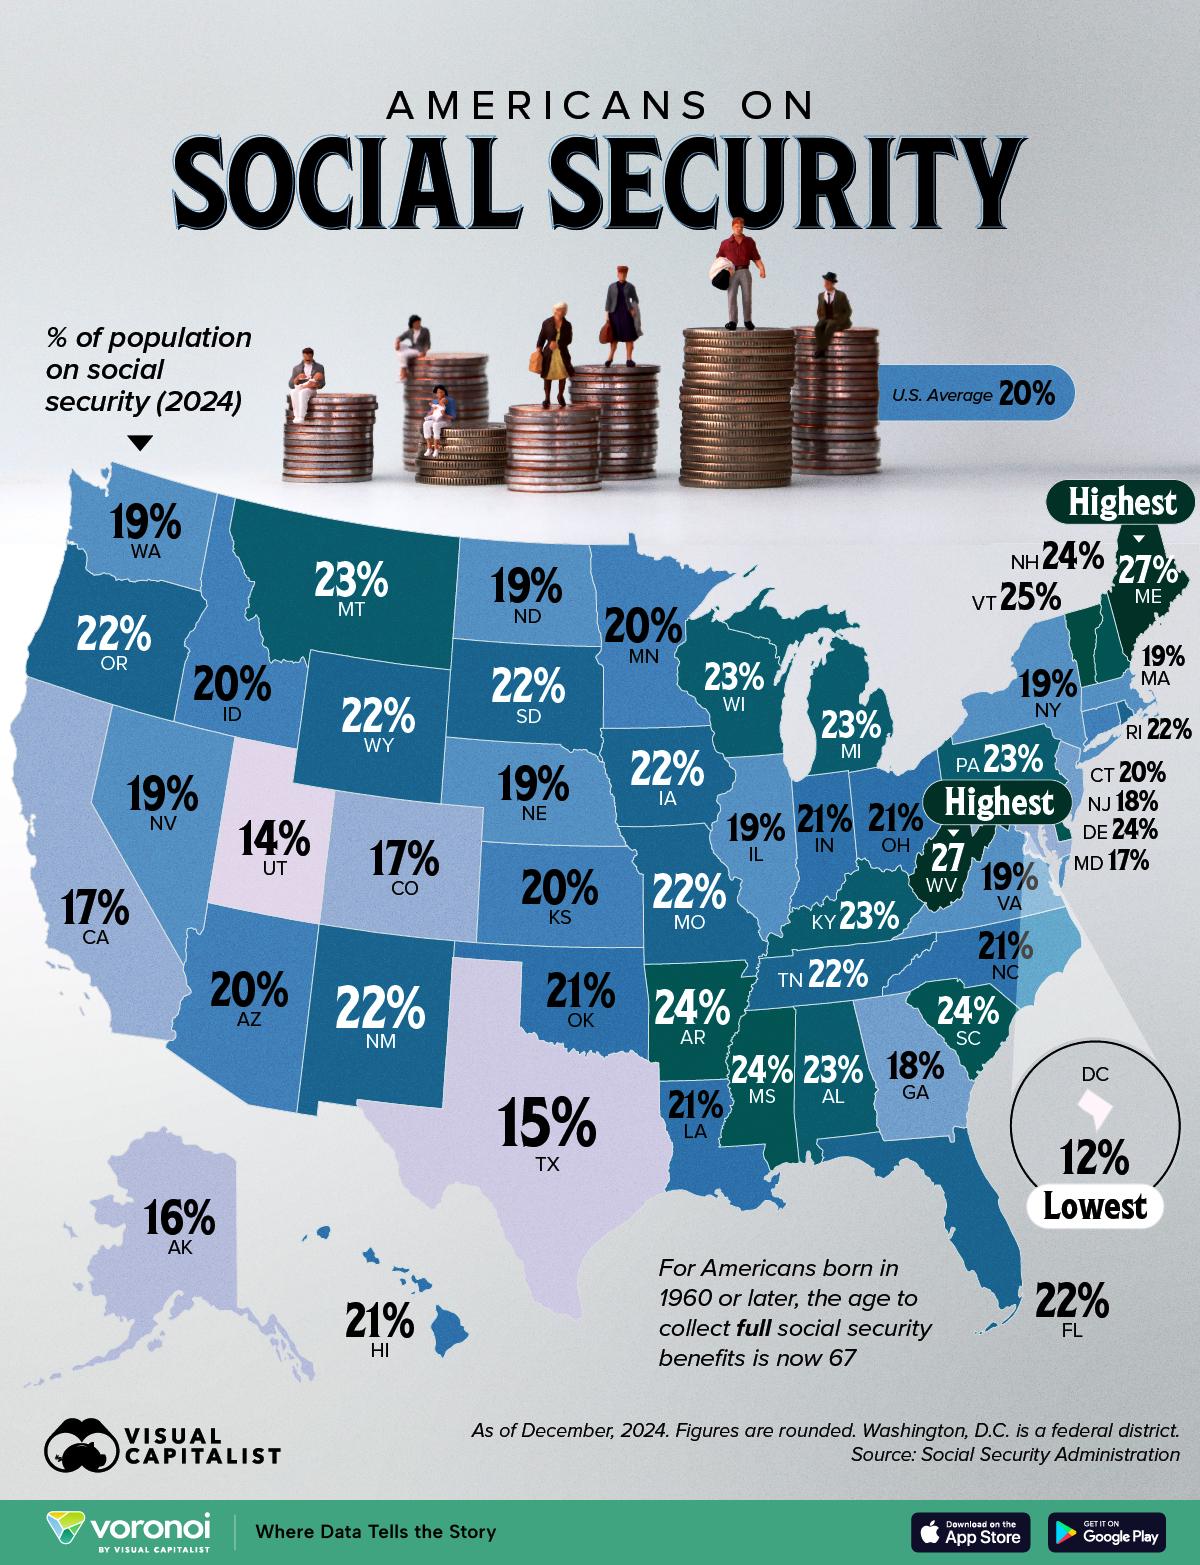
Social Security Recipients by State Map
The "Where Americans Receive Social Security, by State" map provides a visual representation of the distribution of Soci...
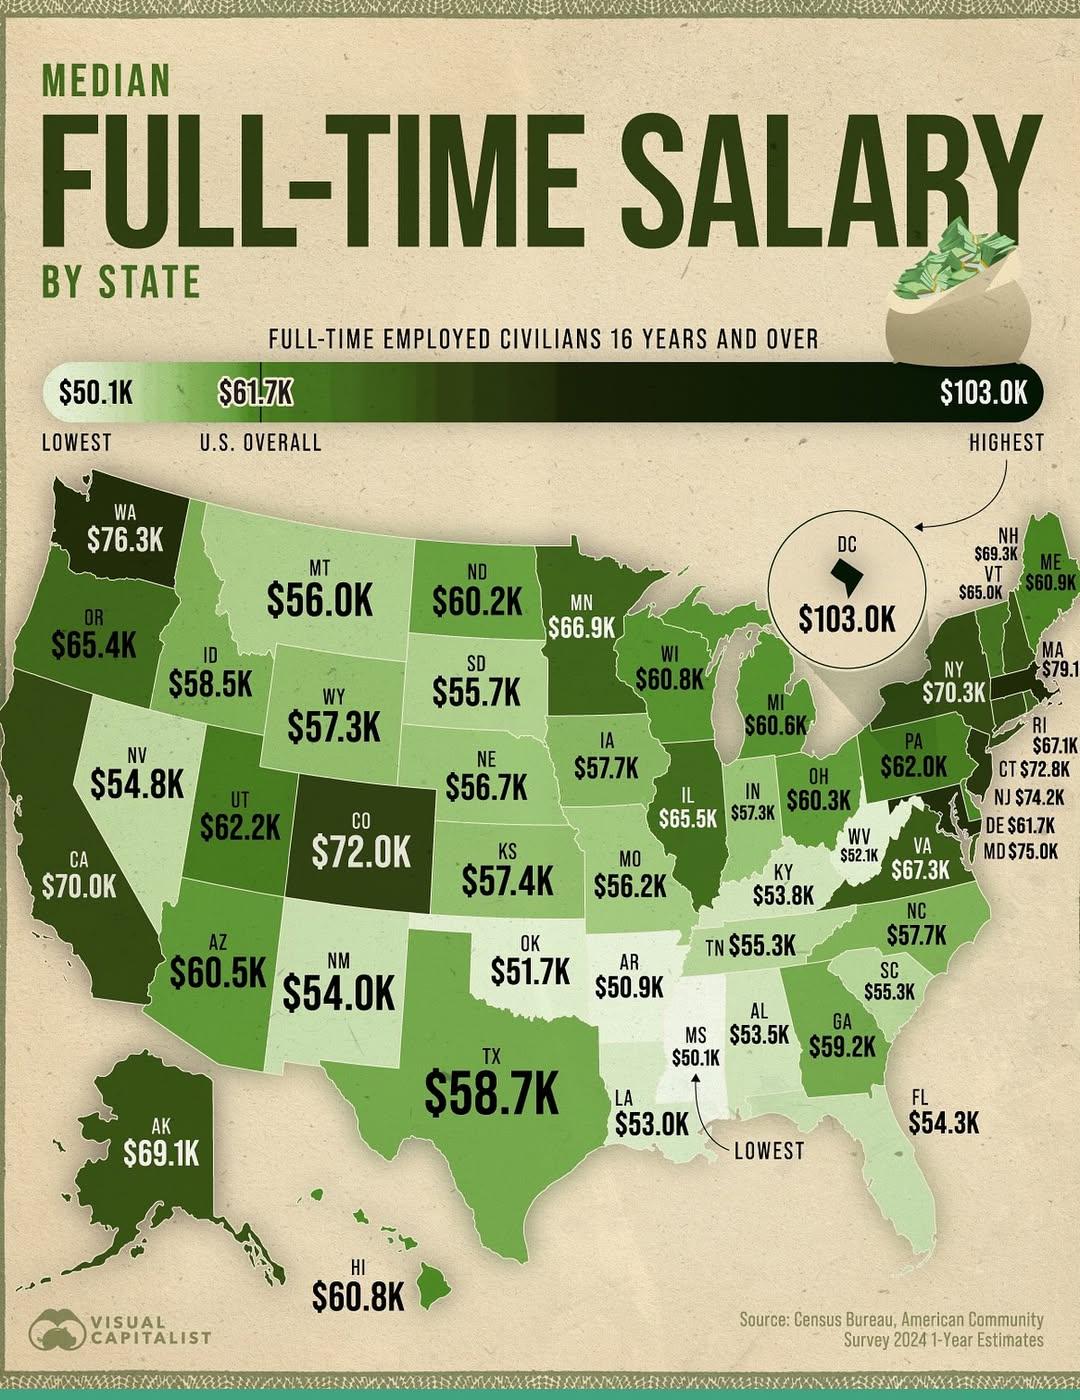
Median Full-Time Salary by State Map
This map presents a comprehensive view of the median full-time salary across the United States, highlighting the signifi...
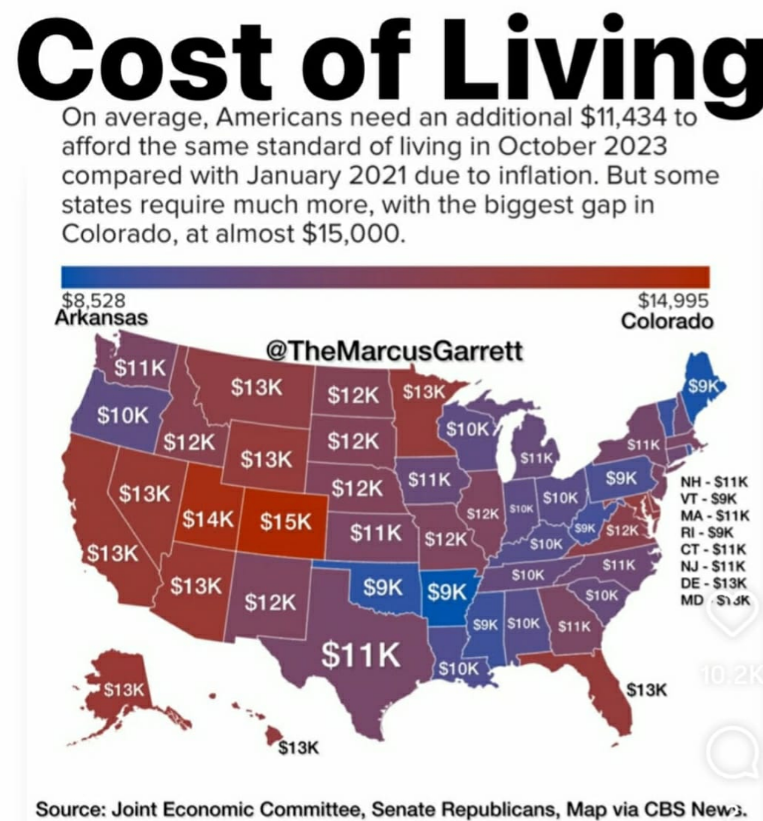
Cost of Living Increase by State Map
The visualization titled "The Shocking Difference in Cost of Living Increase Across U.S. States" effectively highlights ...
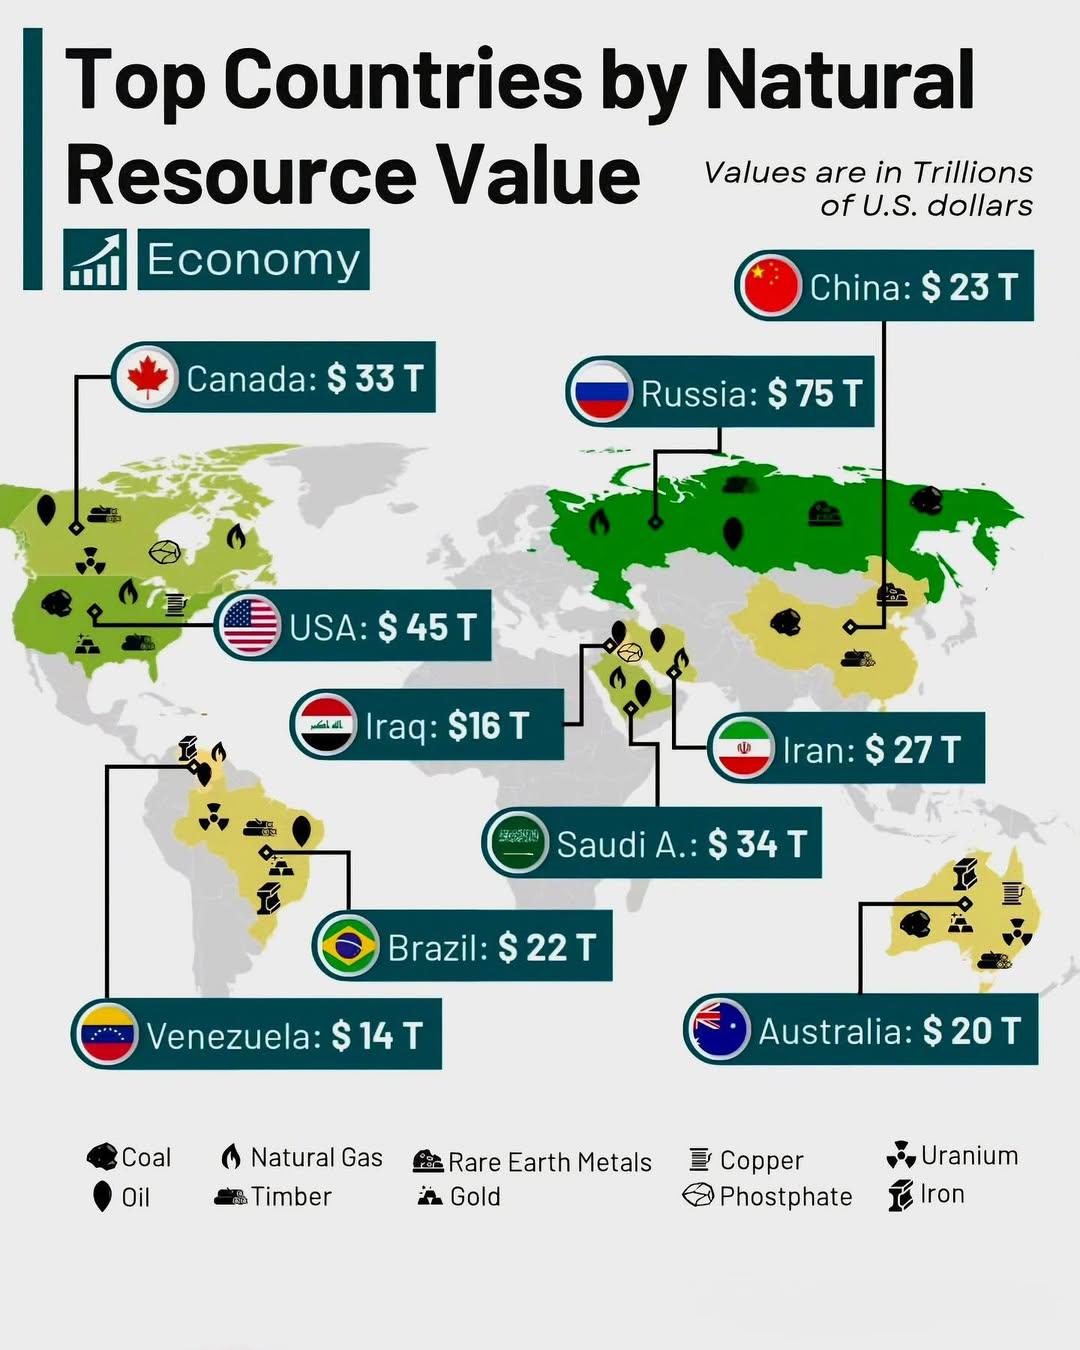
Top Countries by Natural Resources Value Map
The "Top Countries by Natural Resources Value Map" provides a comprehensive overview of the global distribution of natur...
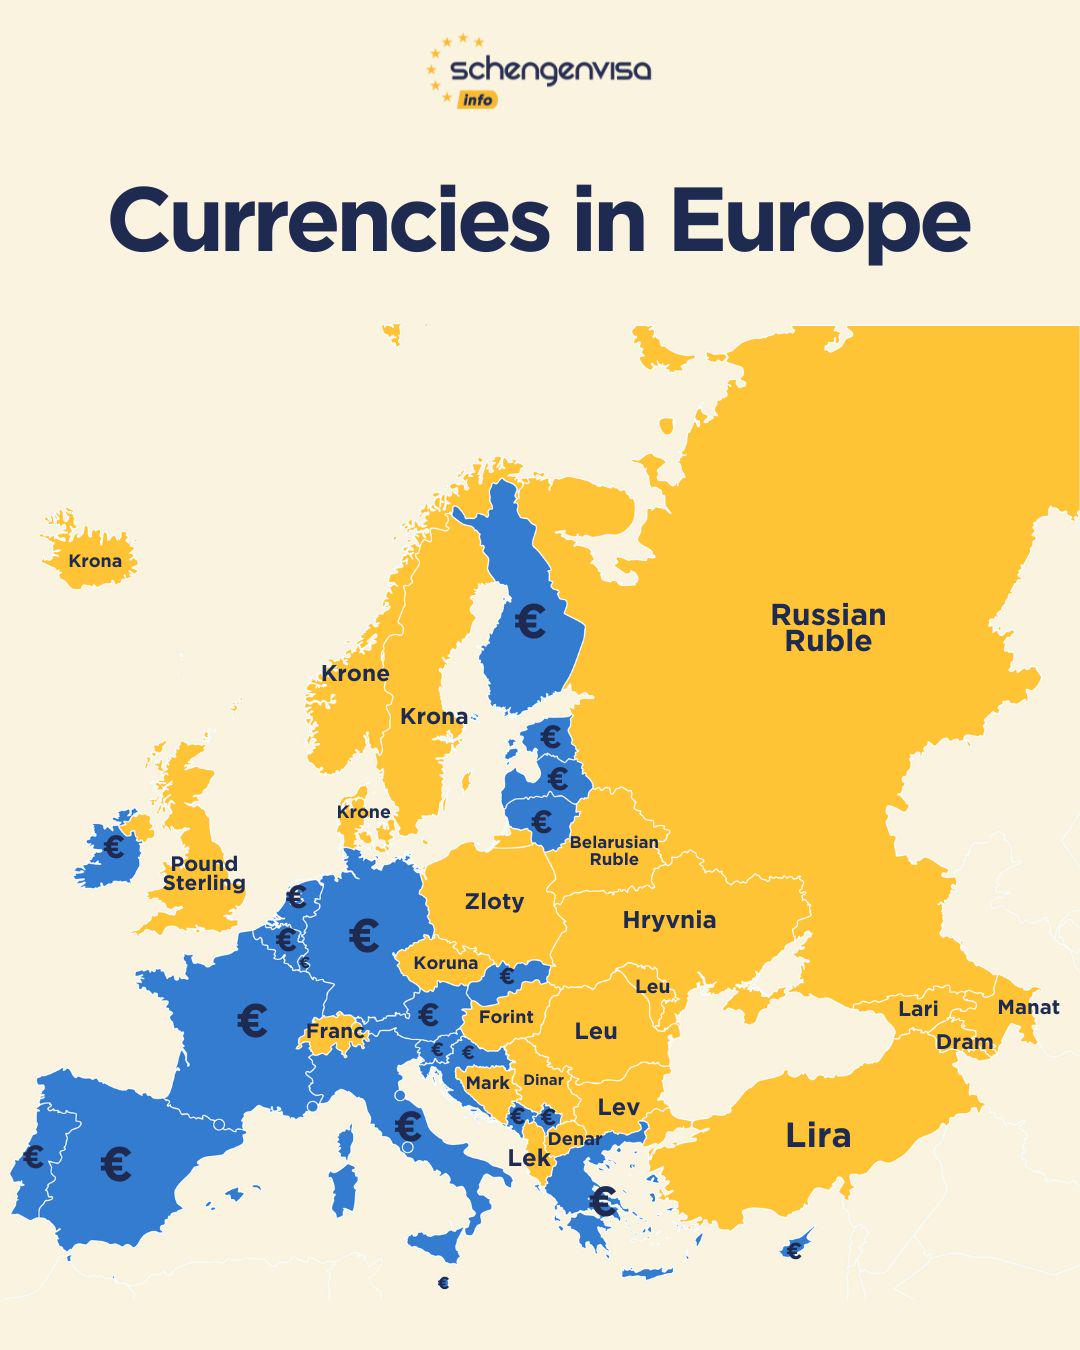
Currency Map of Europe 2025
The "Currencies in Europe (2025)" map visualizes the various currencies used across European countries, highlighting how...
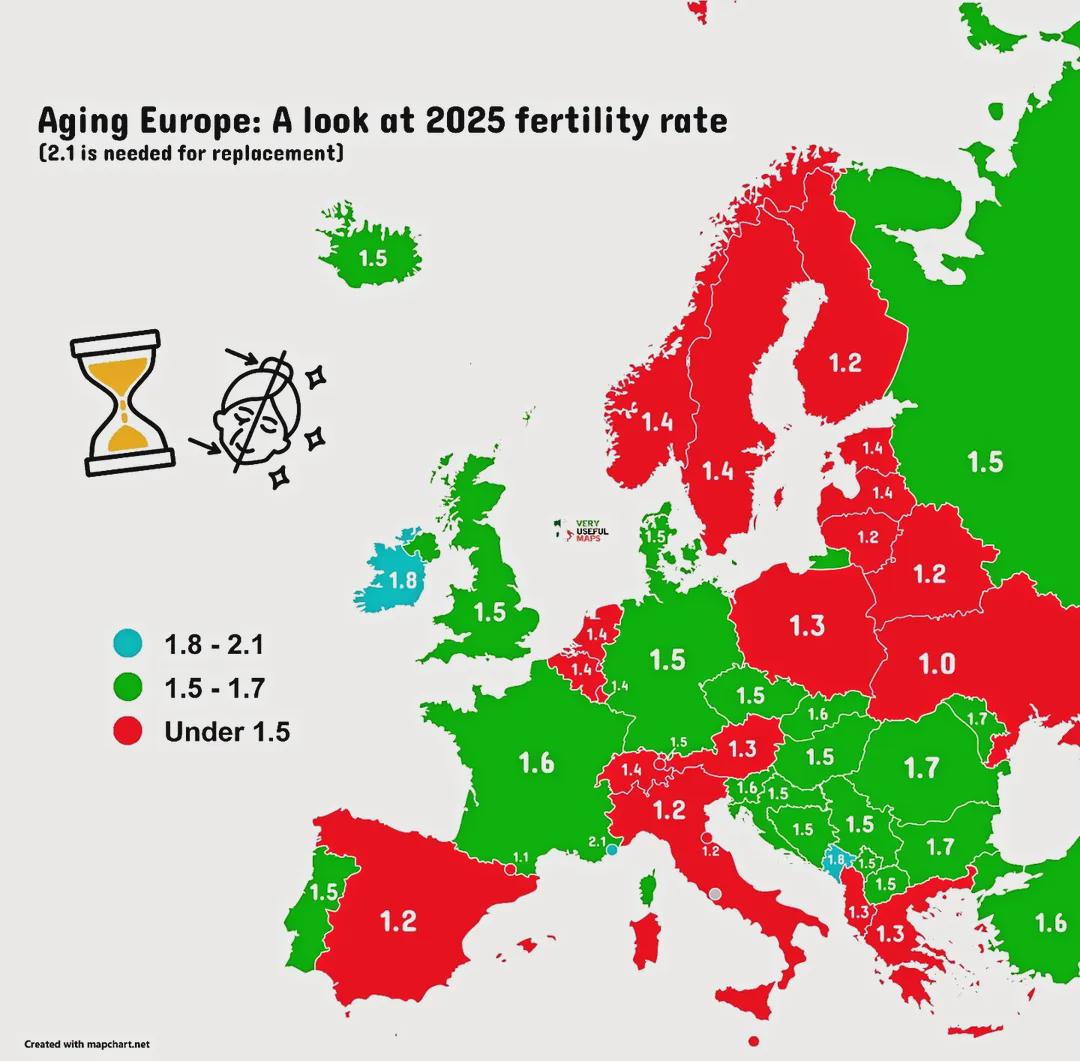
Ageing Population Map of Europe 2025
The "Ageing Population Map of Europe 2025" provides a comprehensive visualization of the demographic shifts occurring ac...
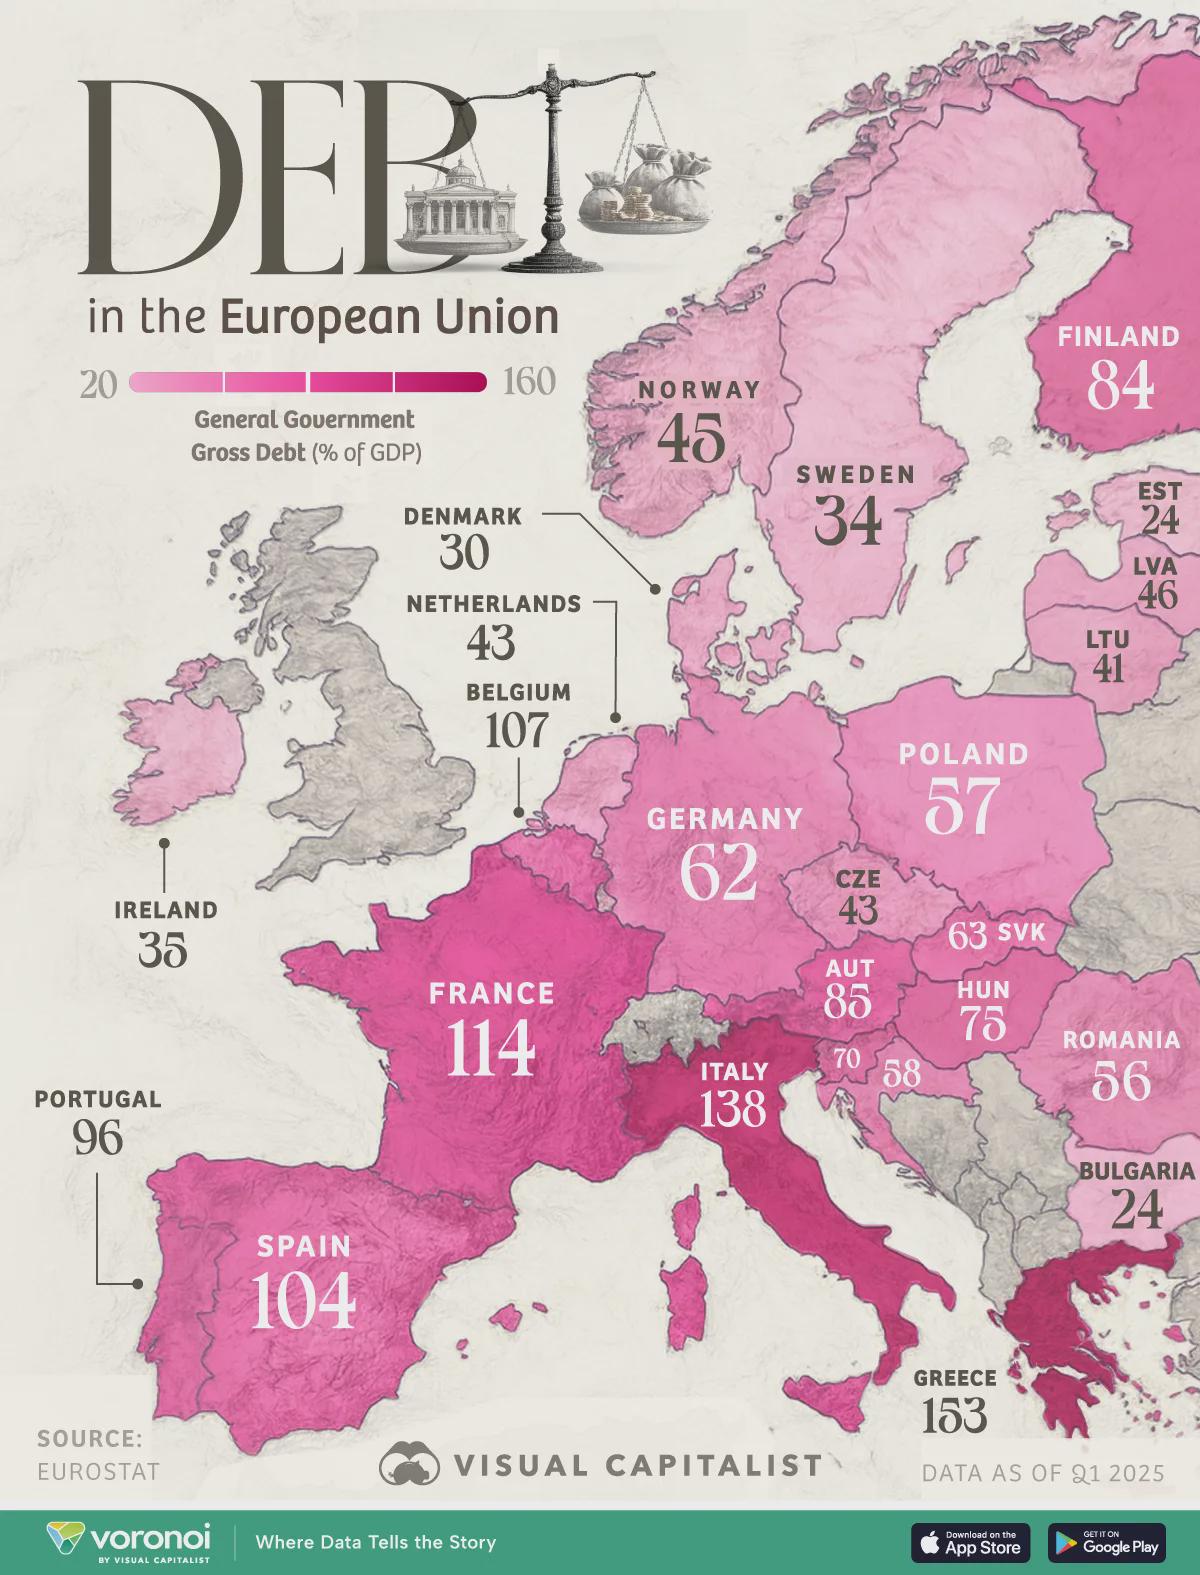
EU Countries Debt to GDP Ratio Map
The \...

US States with Strongest Pensions Map
The "US States with Strongest Pensions Map" provides a clear visualization of how well different states in the U.S. mana...
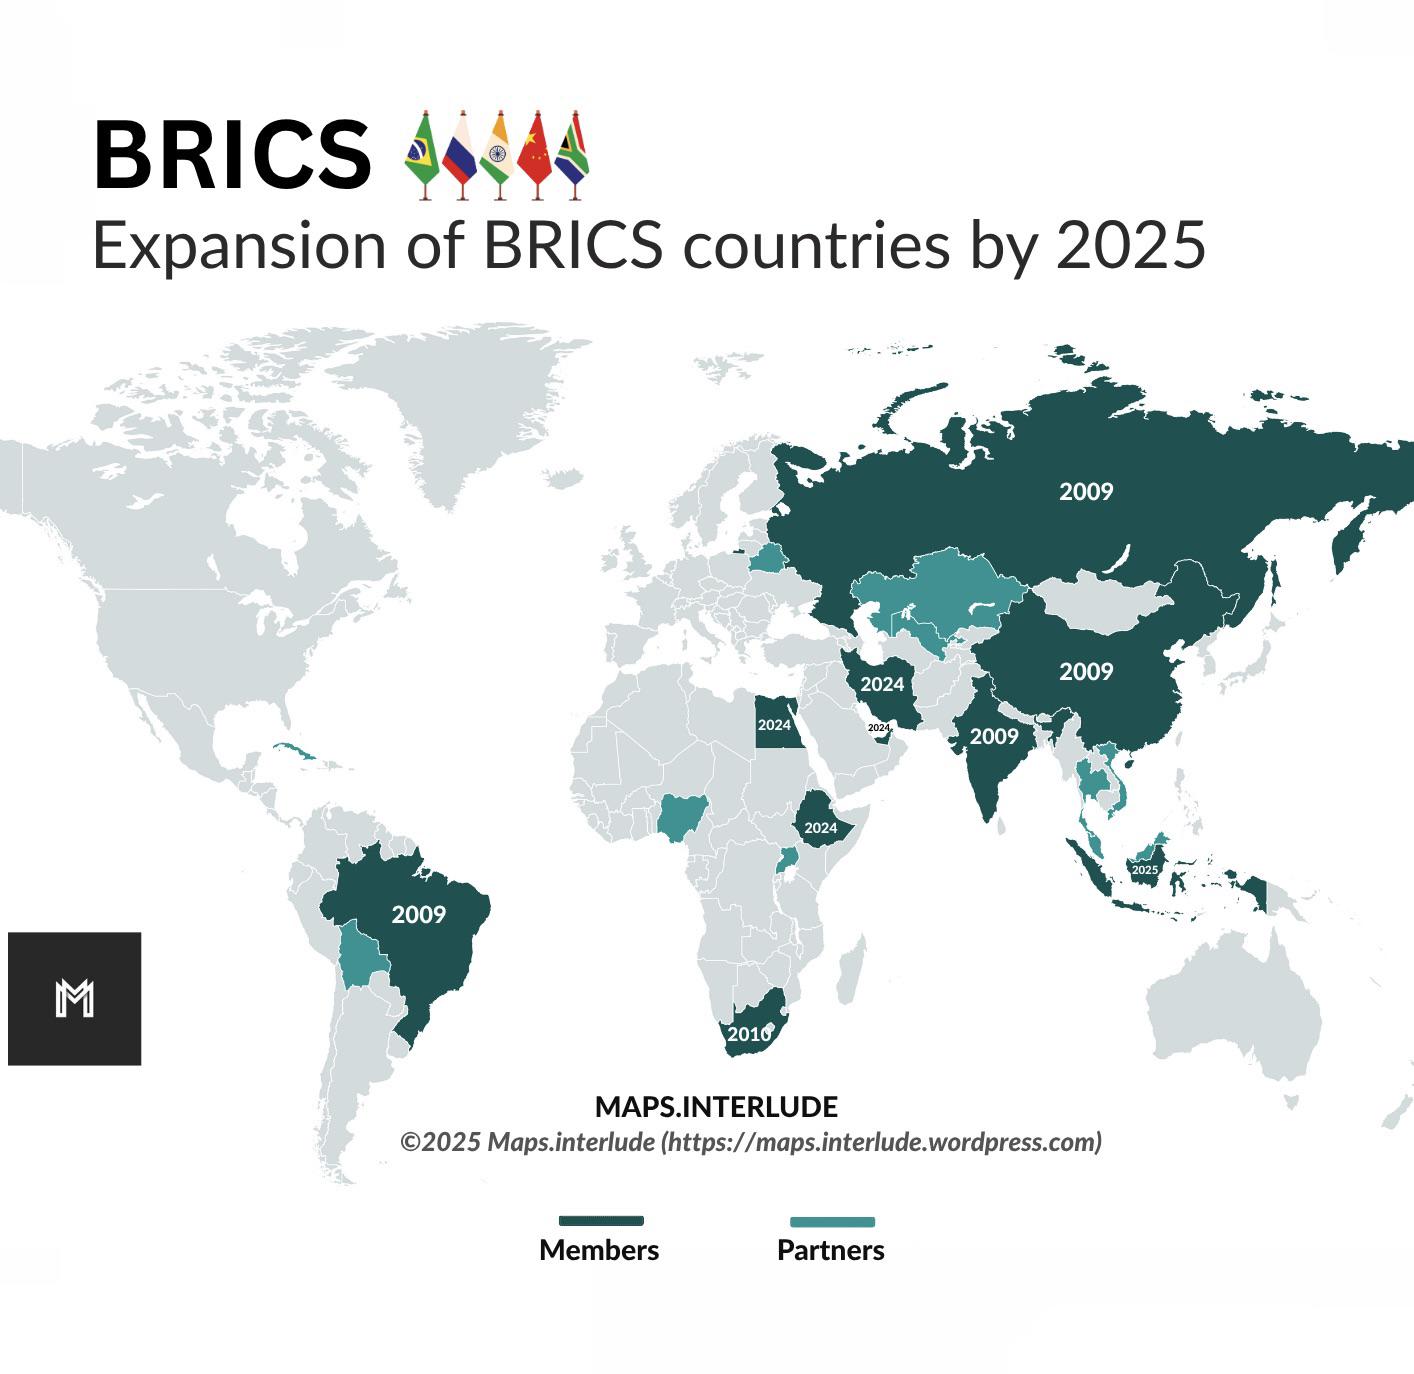
BRICS Countries Expansion Map
This map illustrates the expansion of the BRICS countries, which includes Brazil, Russia, India, China, and South Africa...
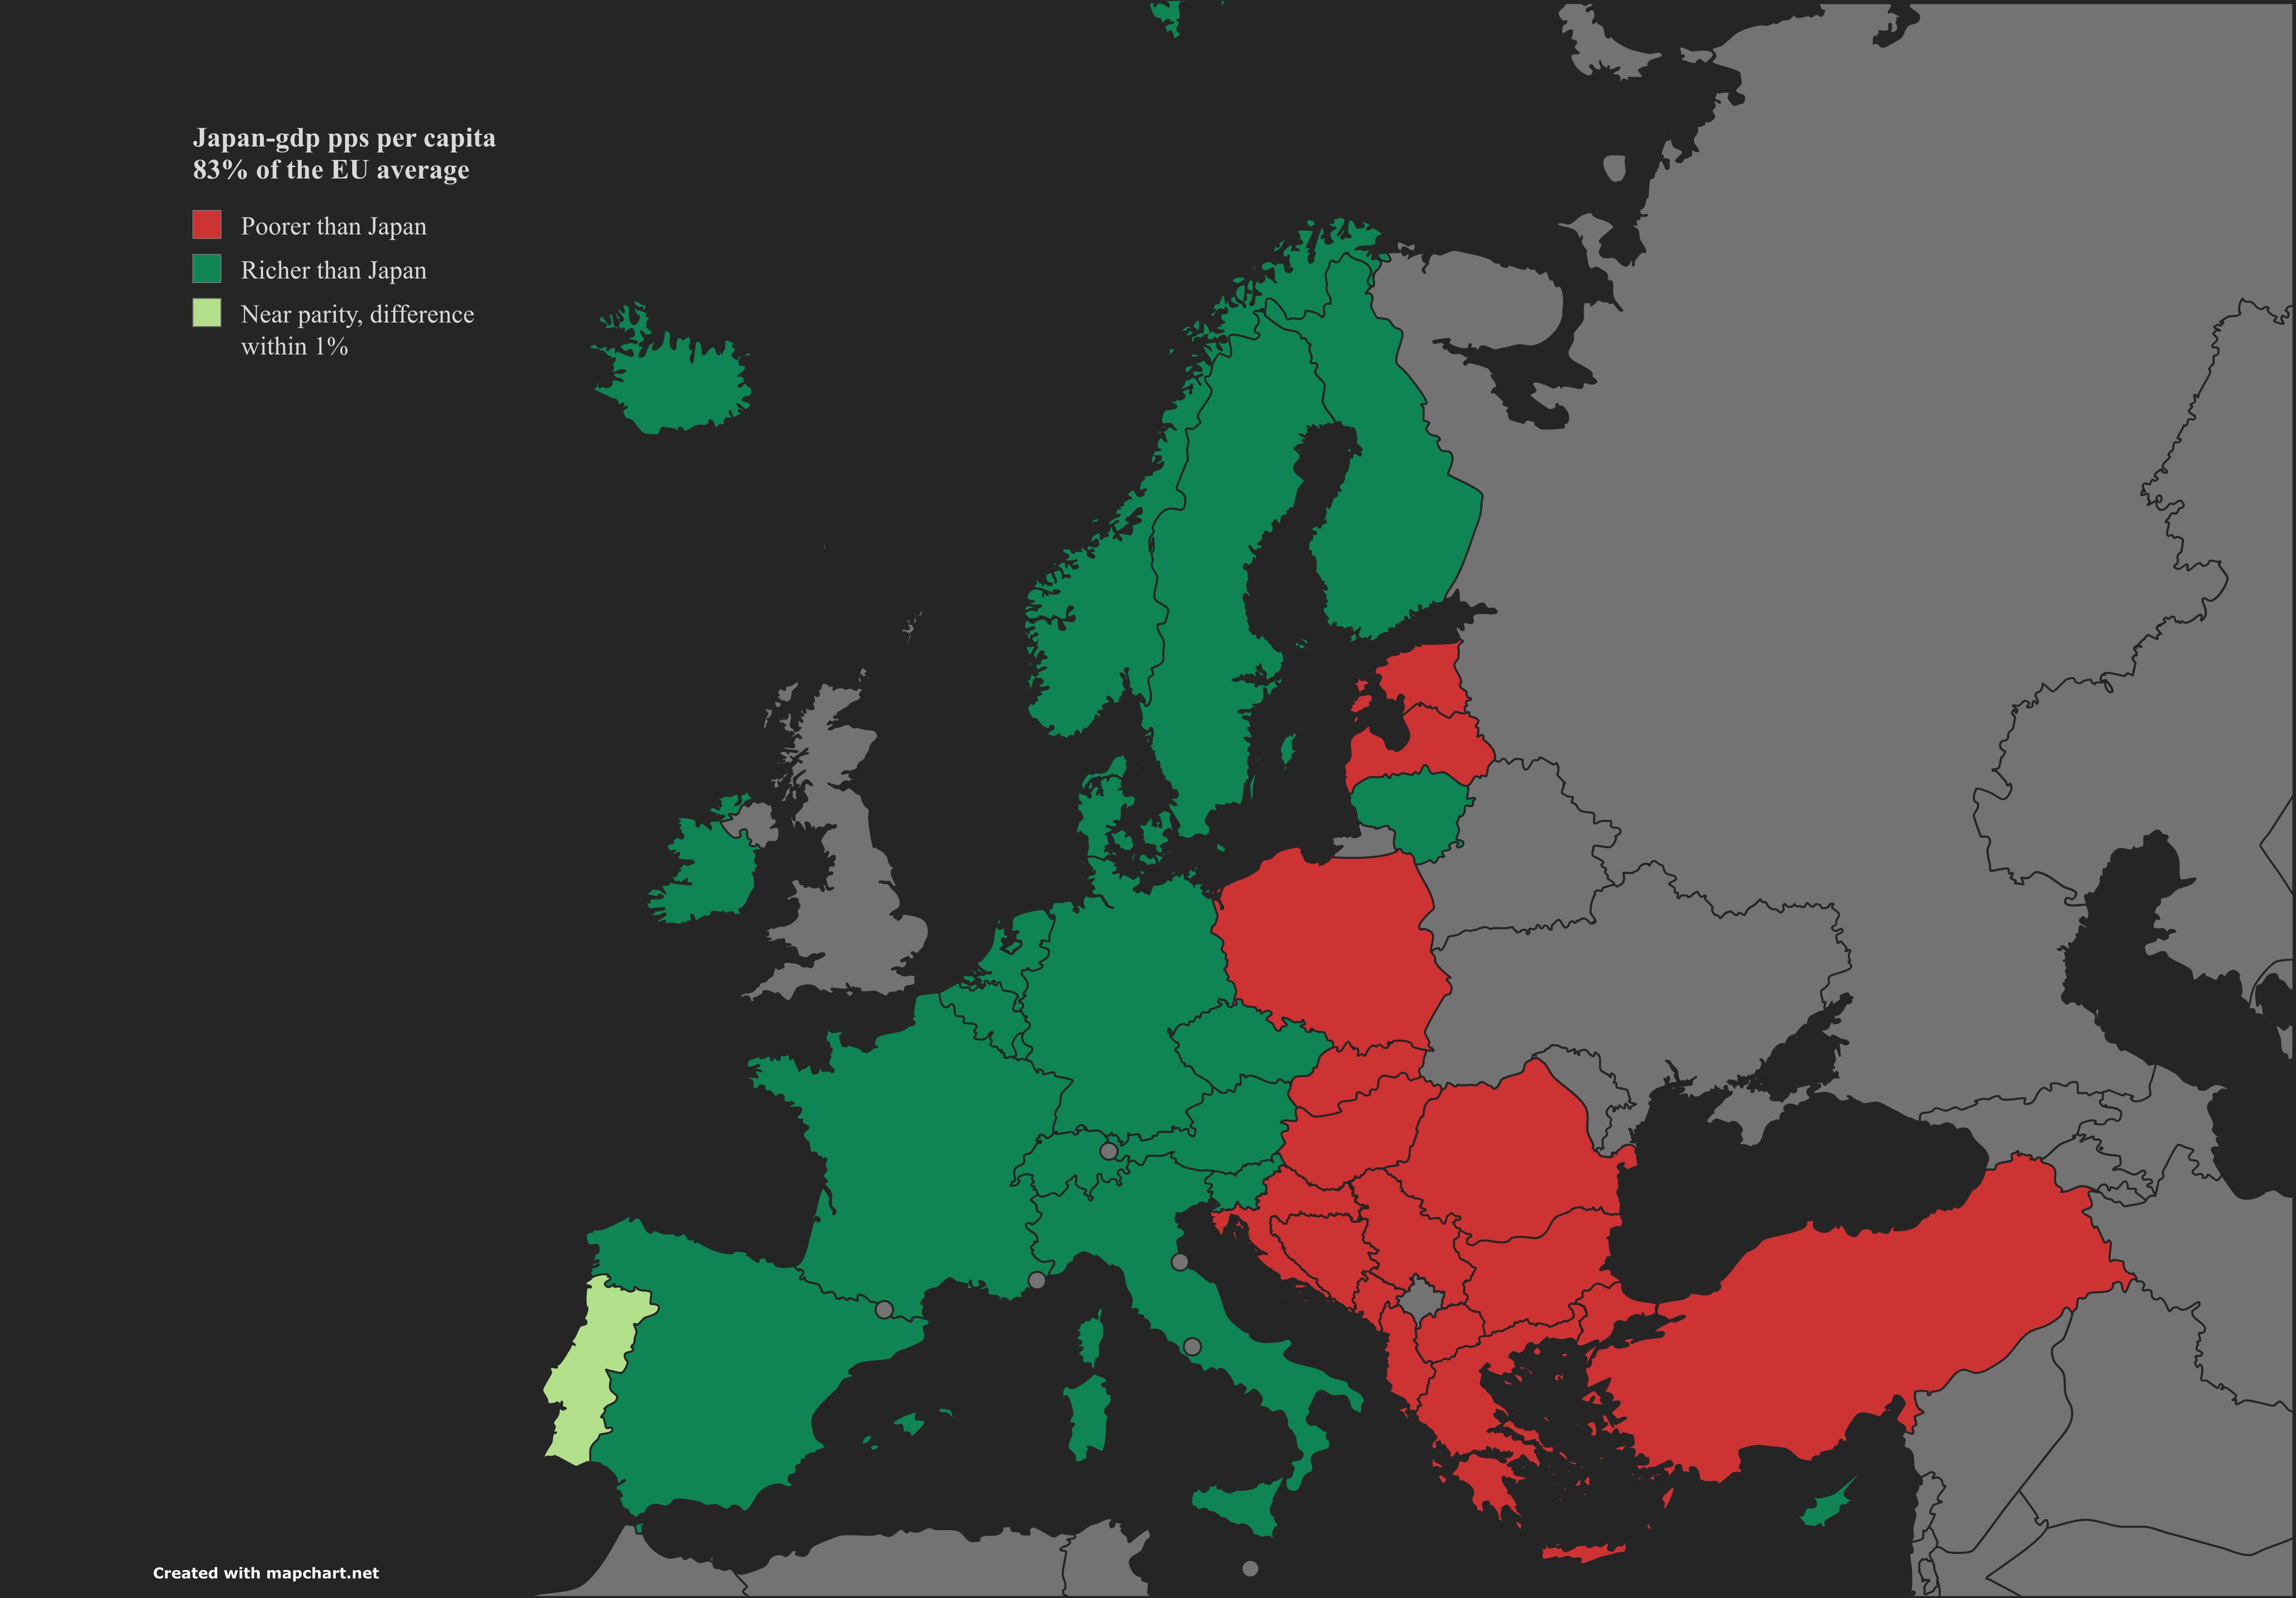
GDP PPS Per Capita Comparison Map: Japan and Europe
The visualization titled "Yen Meets Euro" presents a detailed comparison of Japan's GDP per capita in purchasing power s...
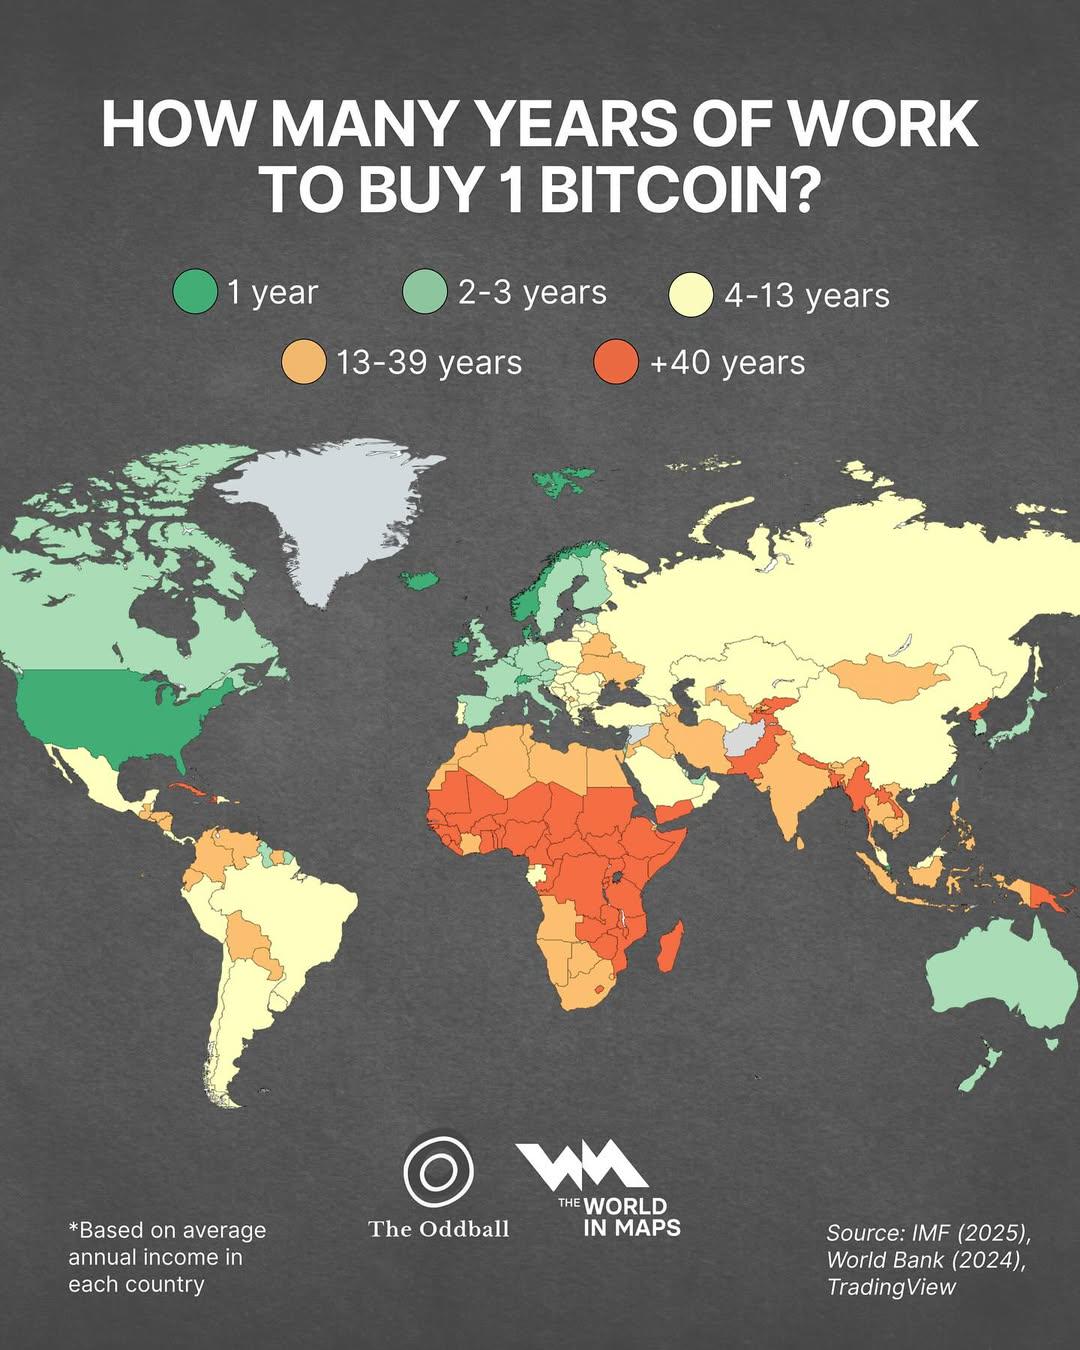
Map of Years of Work to Buy 1 Bitcoin
This map visualizes the number of years an average worker would need to work to afford one Bitcoin, highlighting signifi...
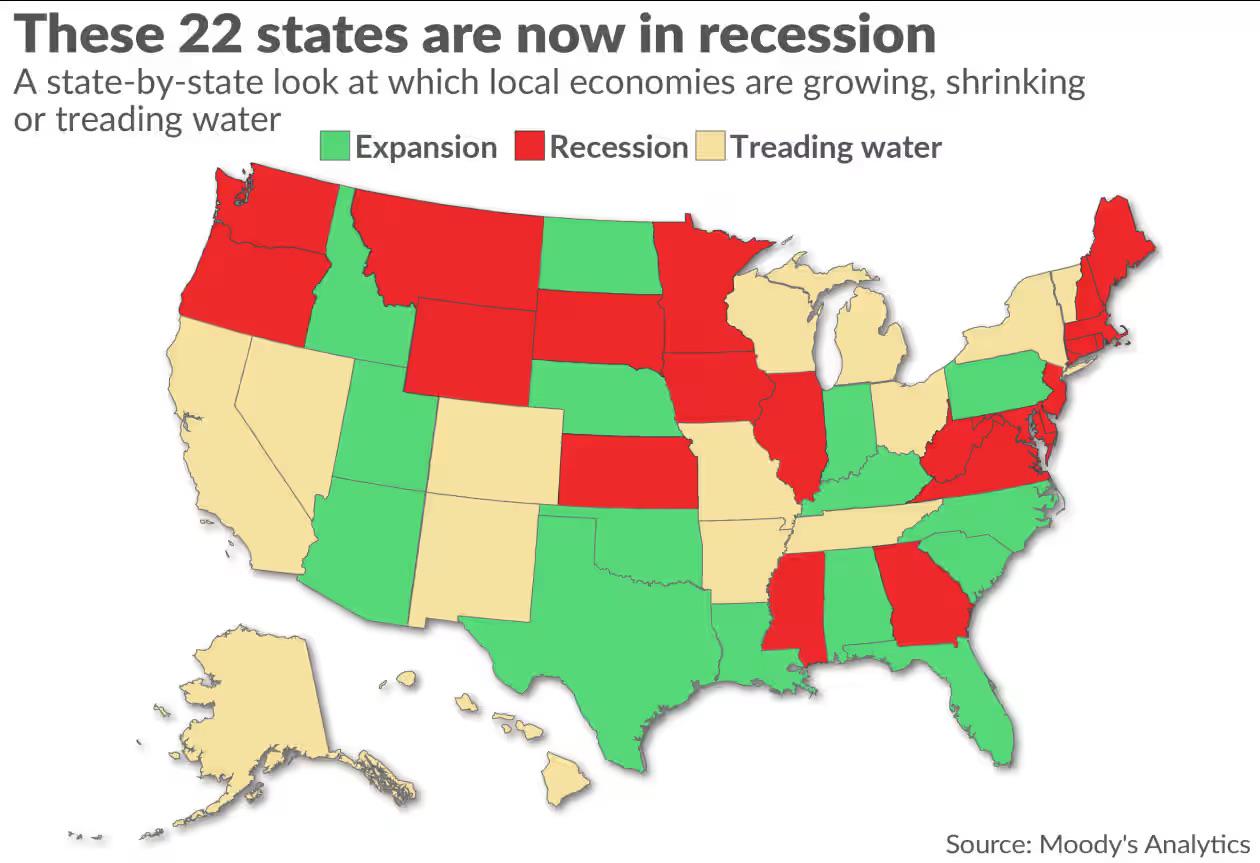
Recession States Map of America as of October 2025
This map provides a visual representation of the American states that are currently experiencing economic recession as o...
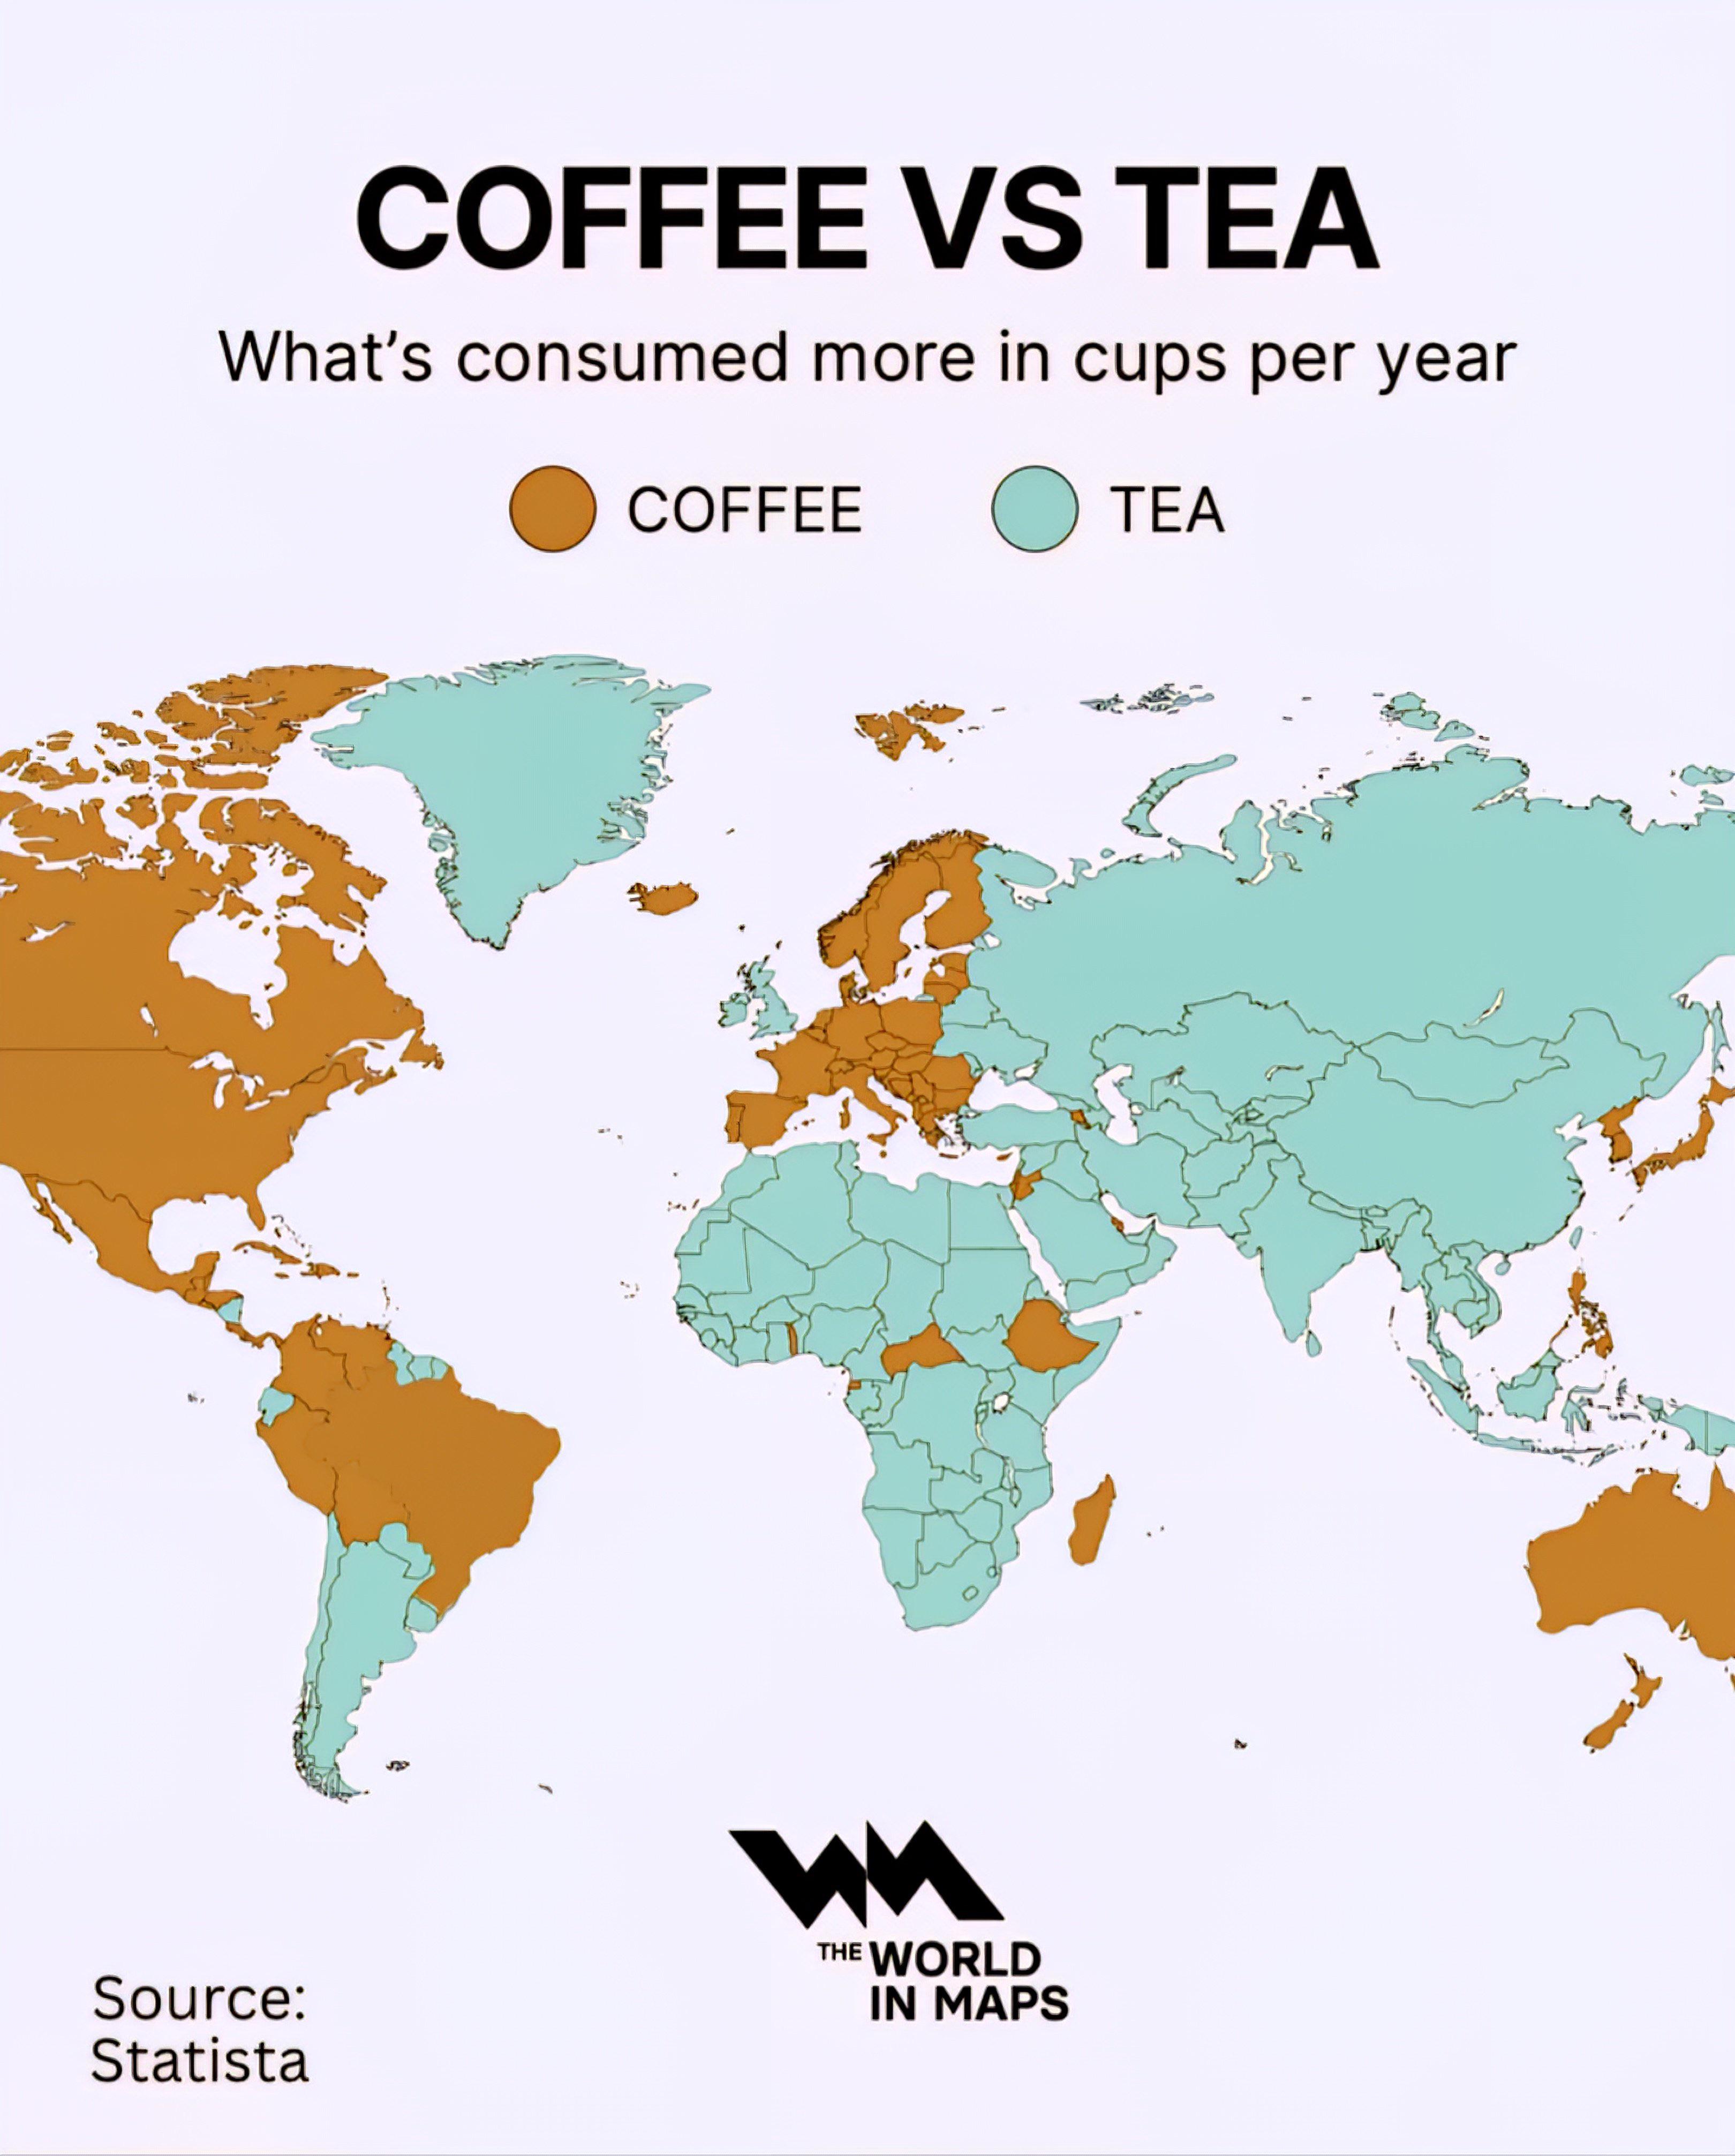
Coffee vs Tea Production Map
...
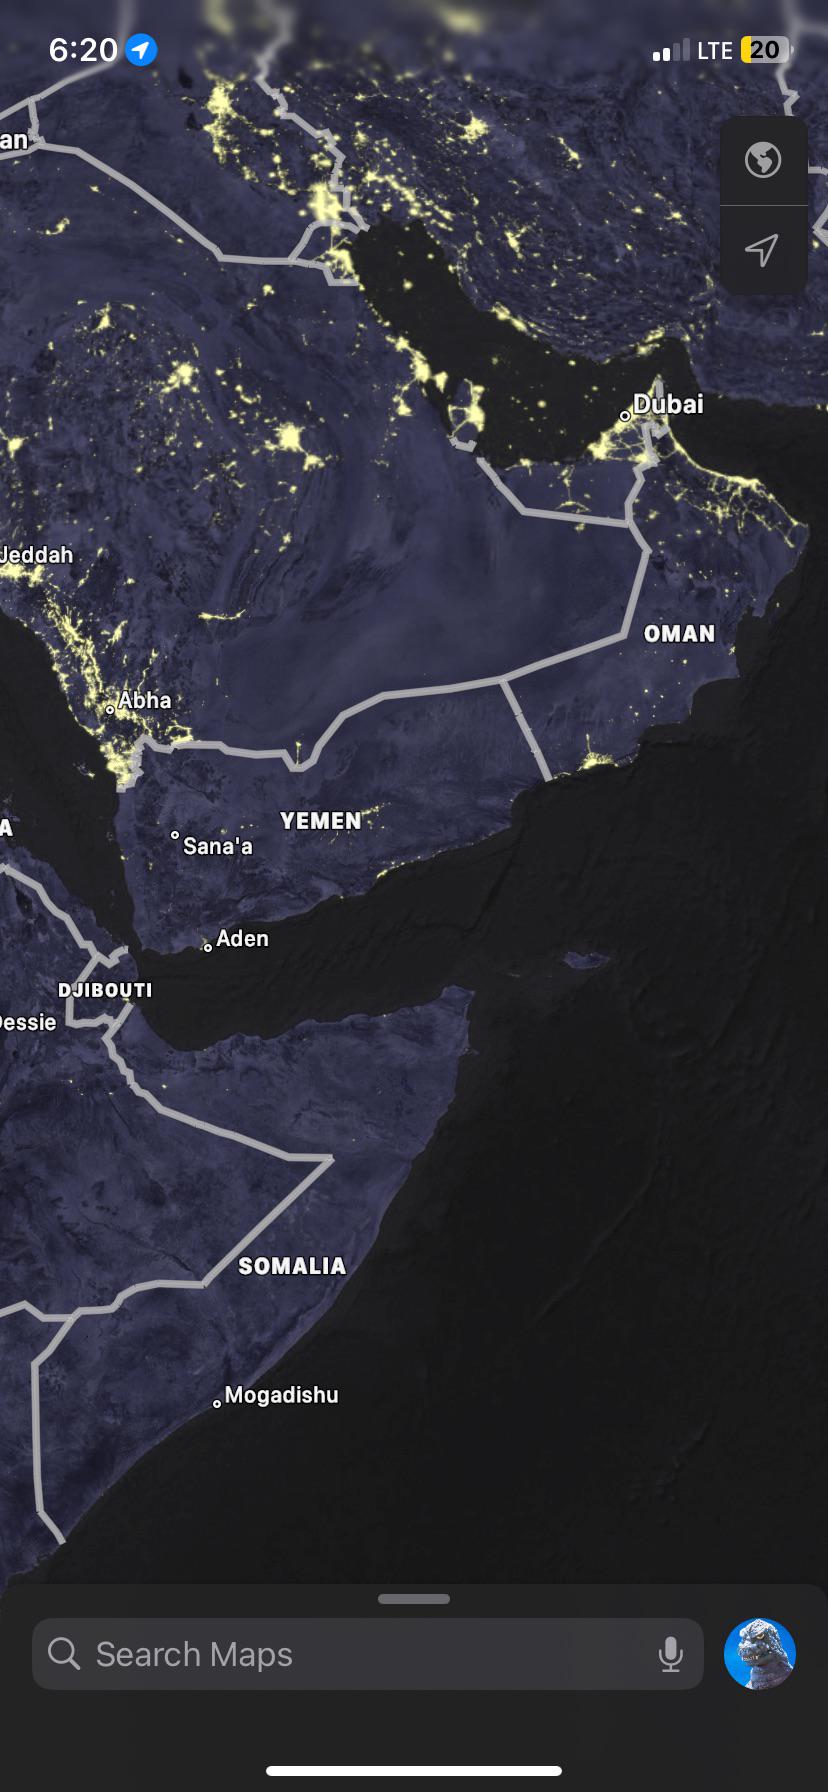
GDP and Population Comparison Map of Oman and Yemen
The visualization titled "Oman 100 Billion Dollar GDP and 5 Million Population vs Yemen 20 Billion GDP and 35 Million Po...
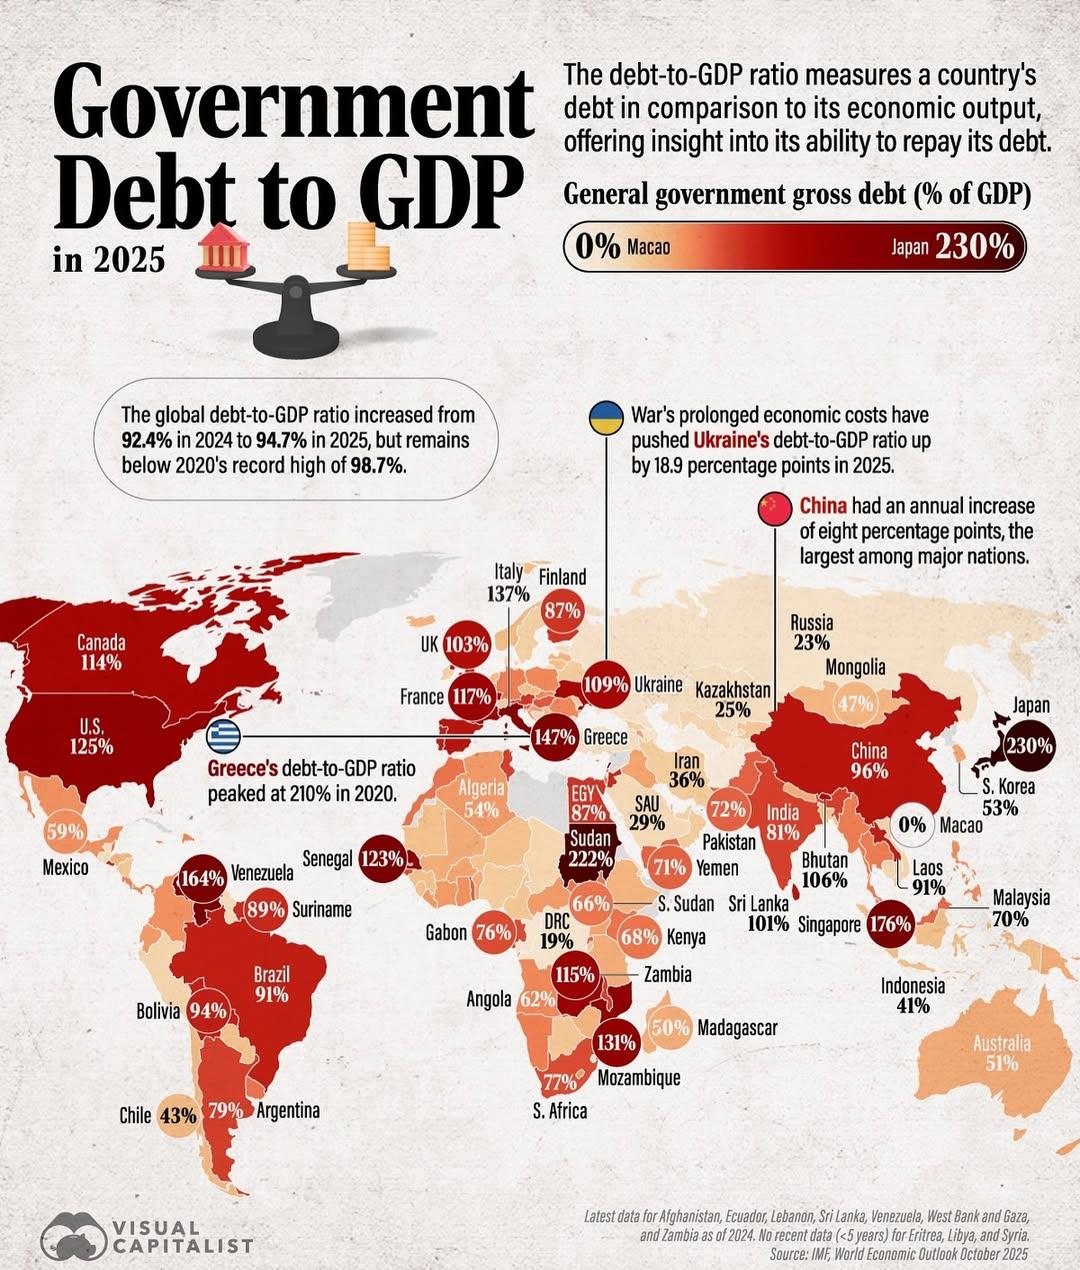
Government Debt to GDP in 2025 Map
The 'Government Debt to GDP in 2025 Map' provides a visual representation of the expected ratio of government debt to Gr...
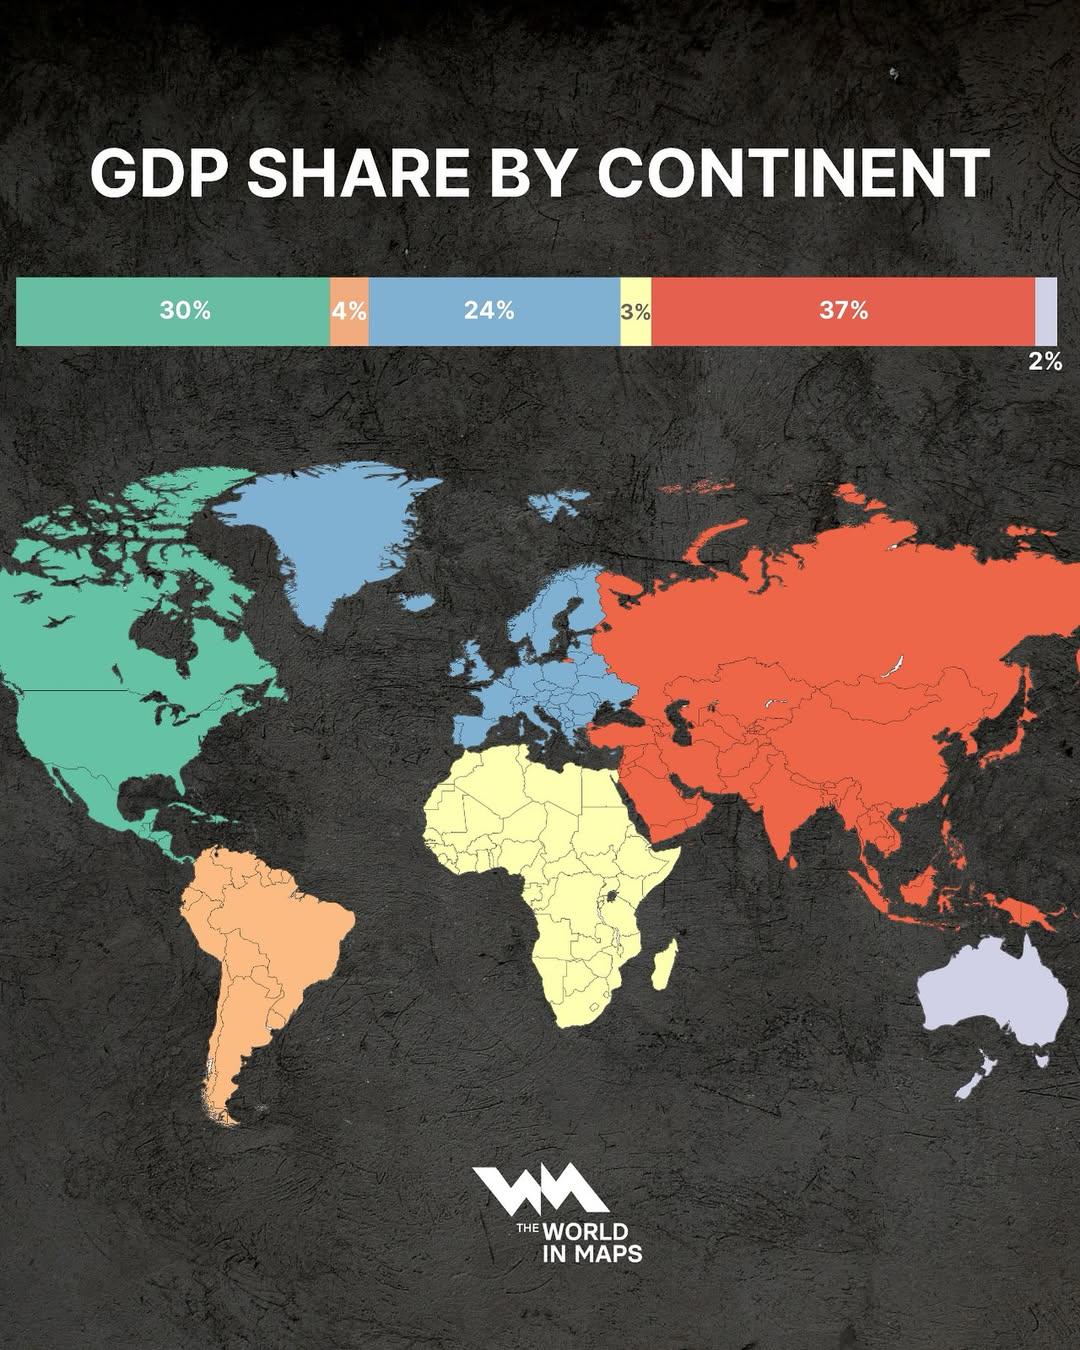
GDP Share by Continent Map
The "GDP Share by Continent Map" provides a clear visual representation of the economic output of different continents a...
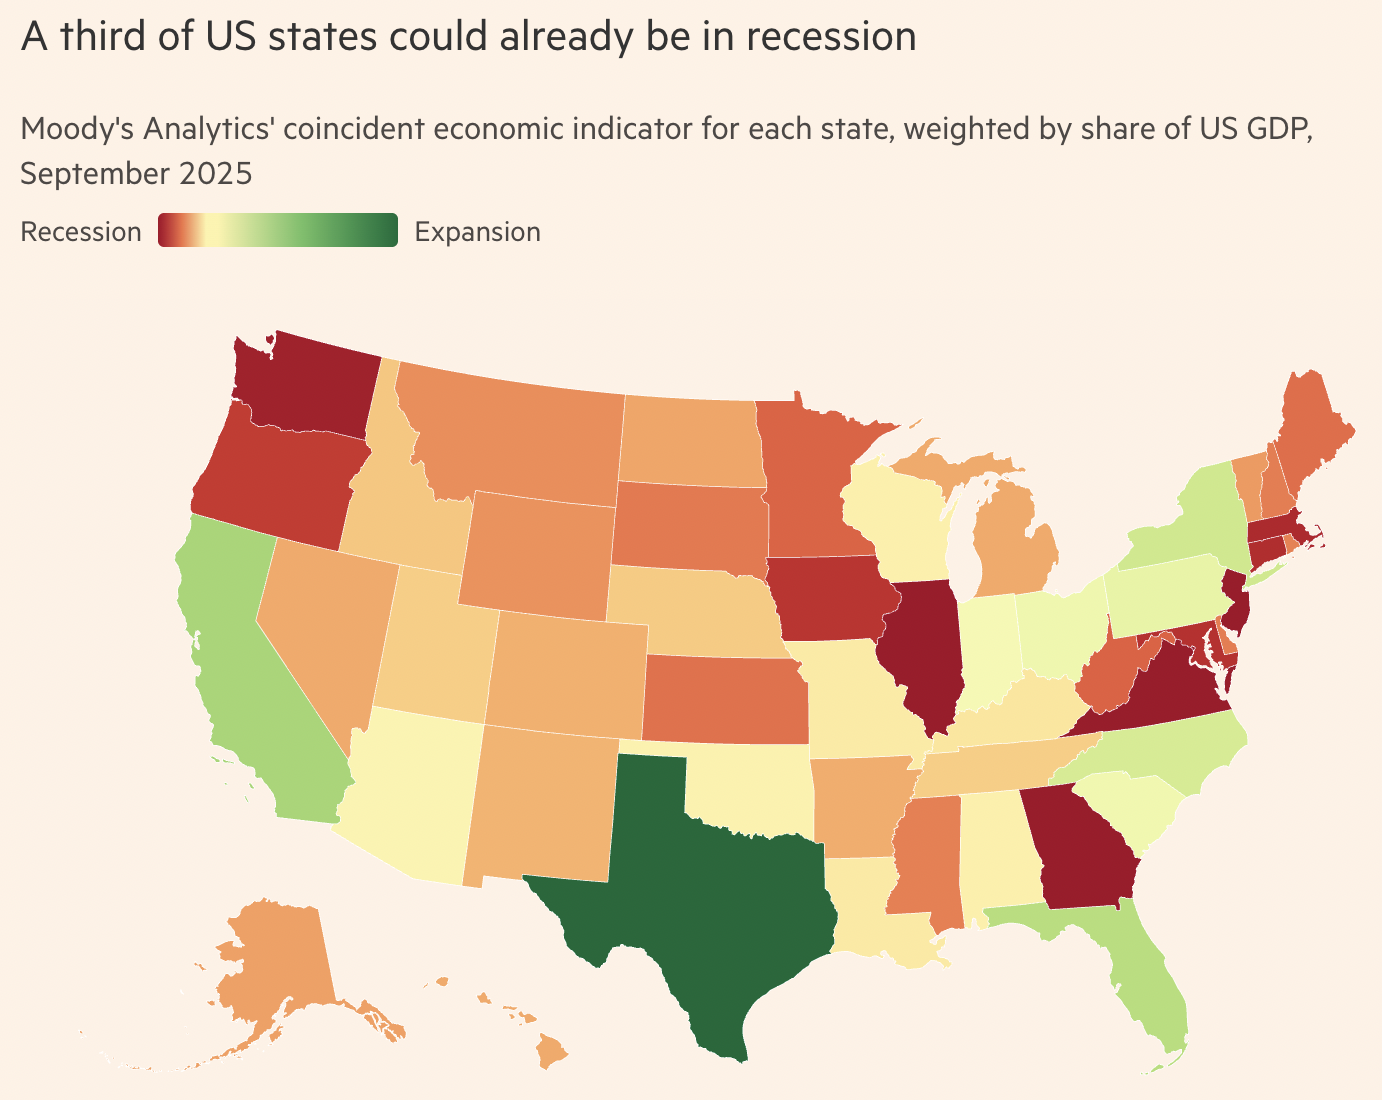
US States Recession Status Map
The map titled "Many US States are Already in Recession" provides a visual representation of the economic conditions acr...
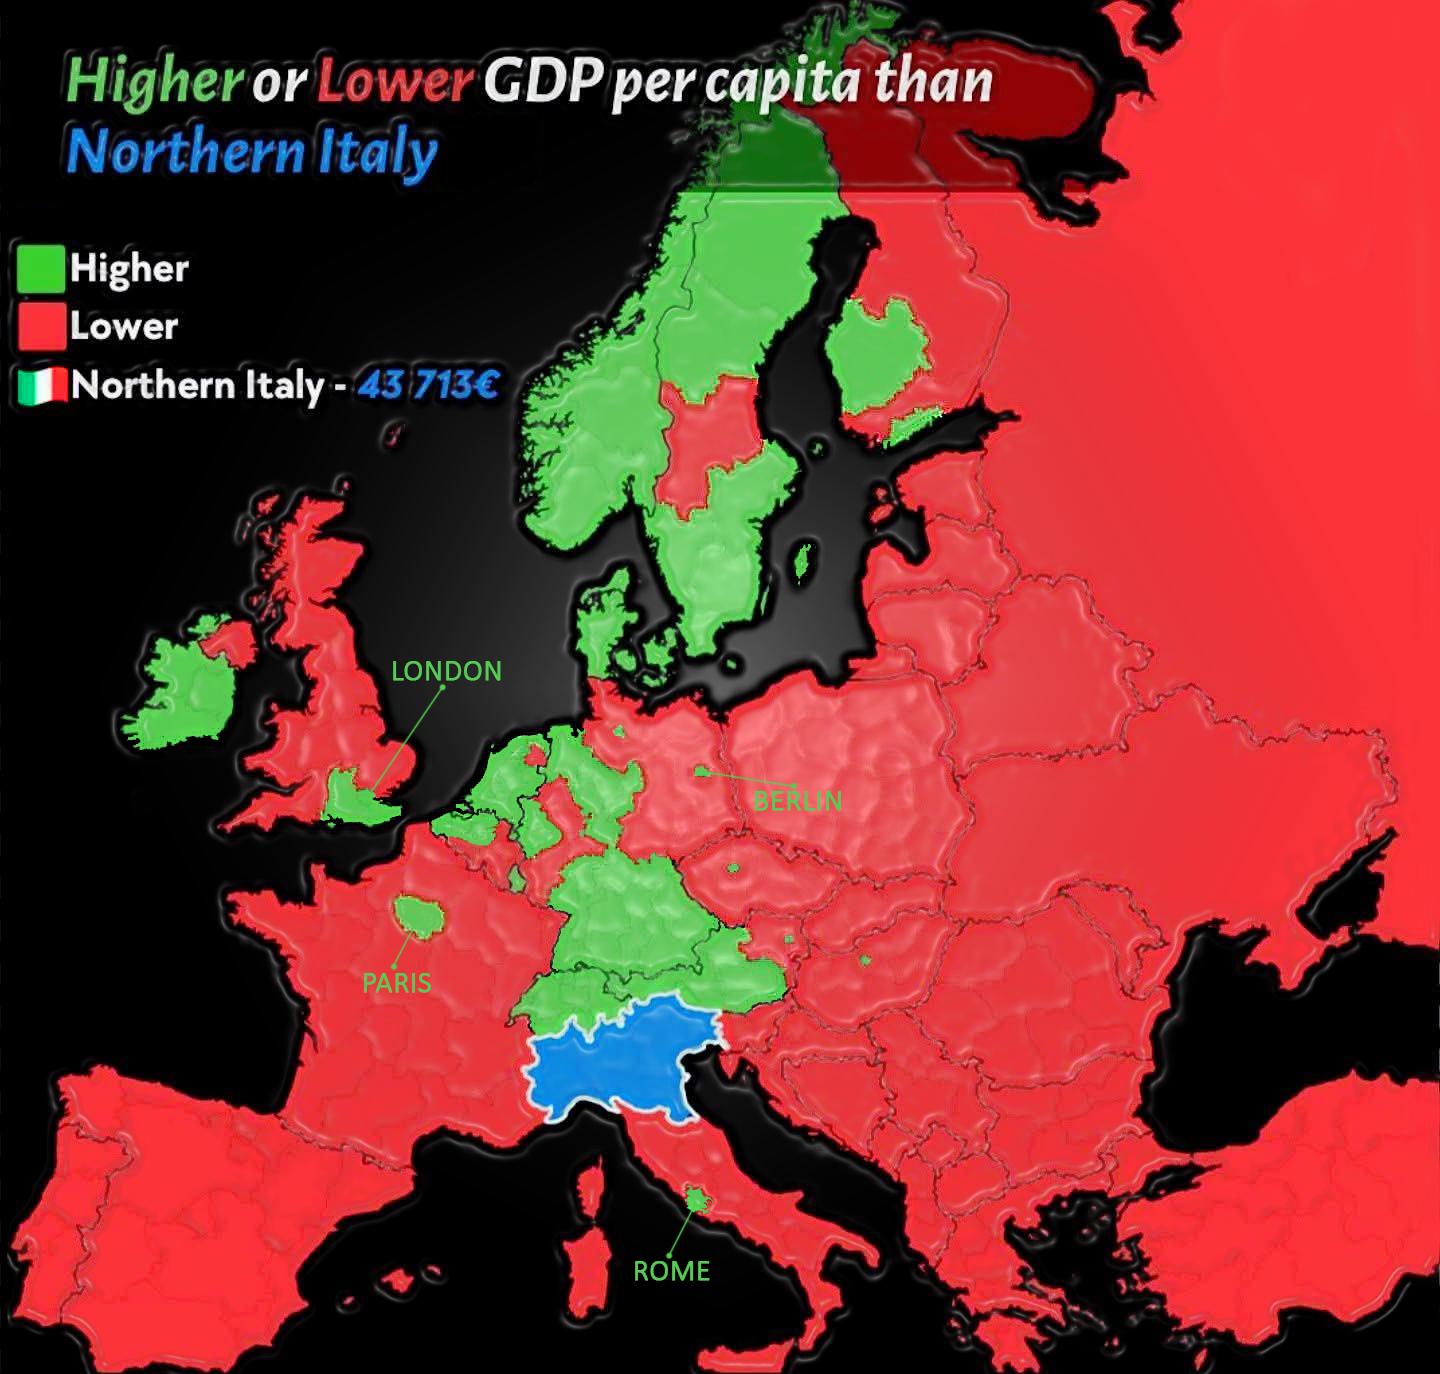
GDP Per Capita Map of Northern Italy vs Europe
The visualization titled "GDP Per Capita of Northern Italy vs GDP Per Capita of the rest of Europe" provides a compellin...
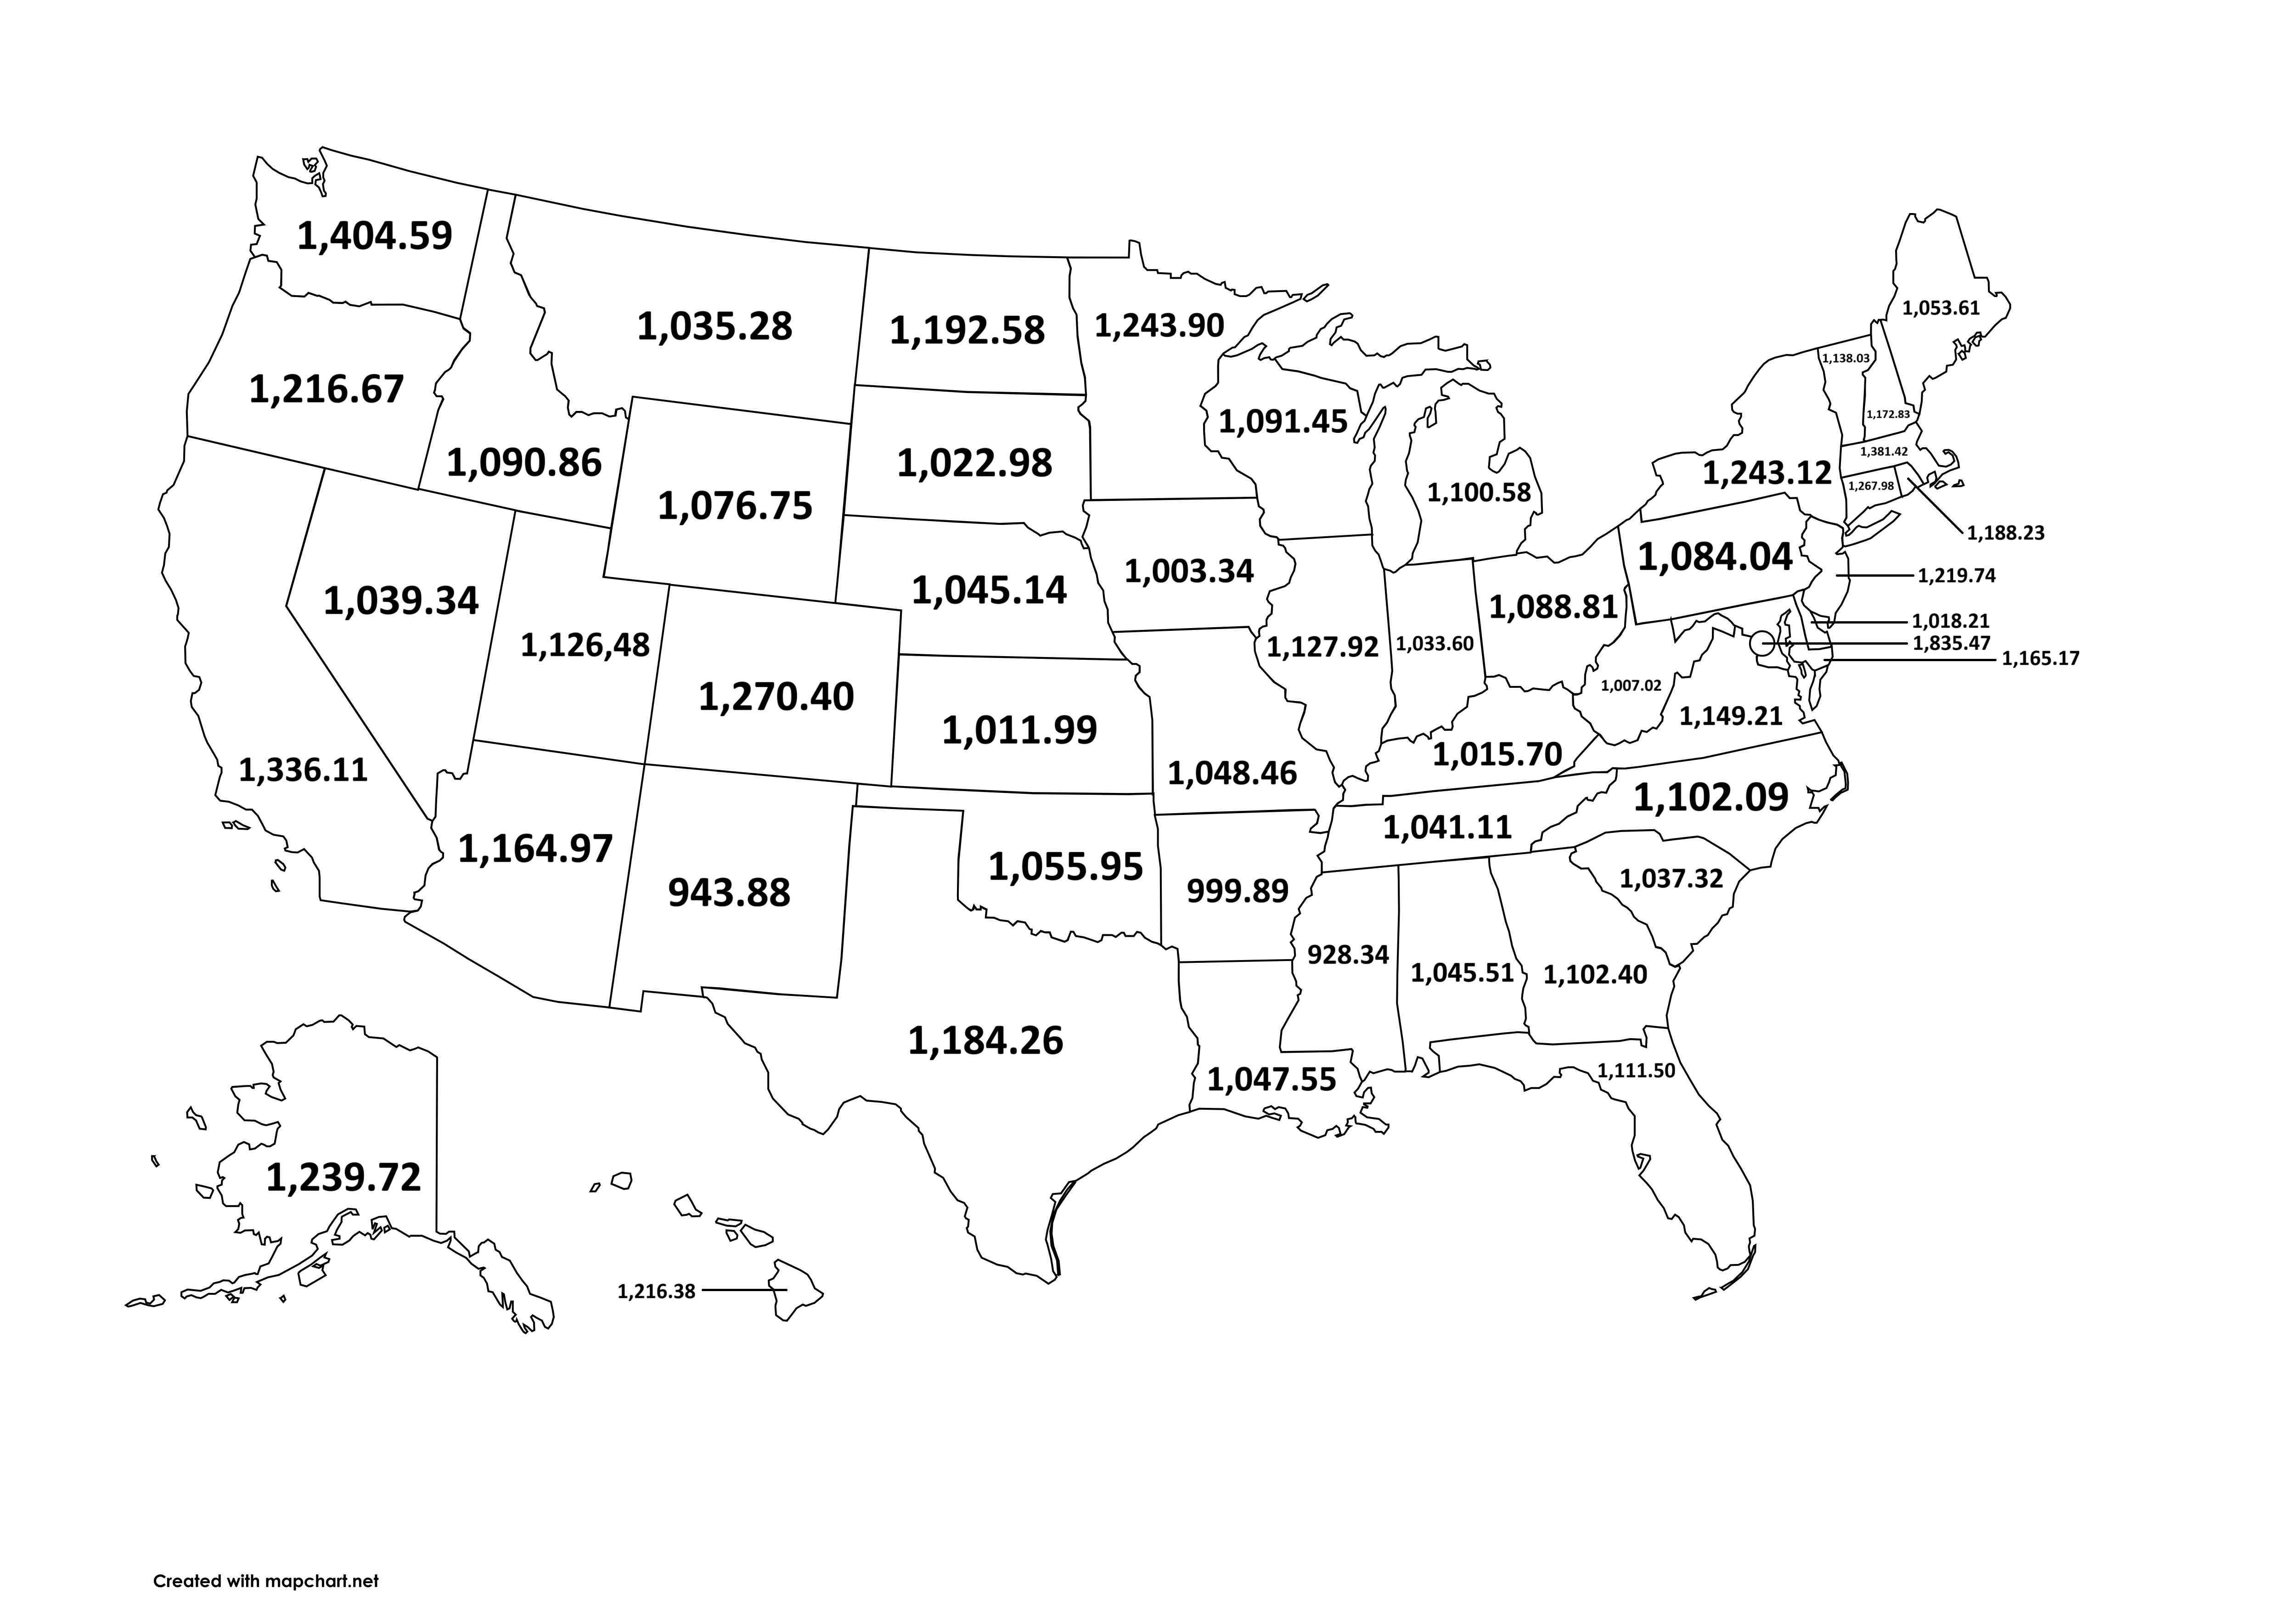
Average Weekly Earnings Map by U.S. State 2024
The map titled "Average Weekly Earnings of All Employees on Private Nonfarm Payrolls per U.S. State [2024]" provides a c...

Western Europe Map Overview
This geographical visualization titled "Where’s Western Europe?" provides a clear delineation of the countries that comp...
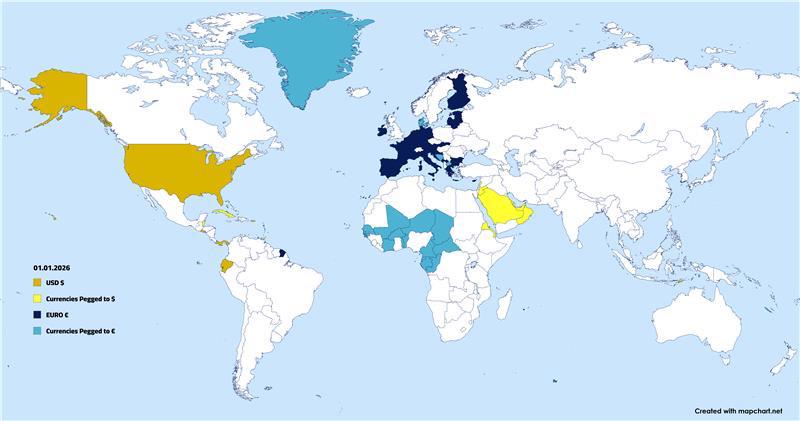
Map of Global Usage of Dollar and Euro
This map illustrates the global usage of the two dominant reserve currencies: the US dollar (USD) and the euro (EUR). It...
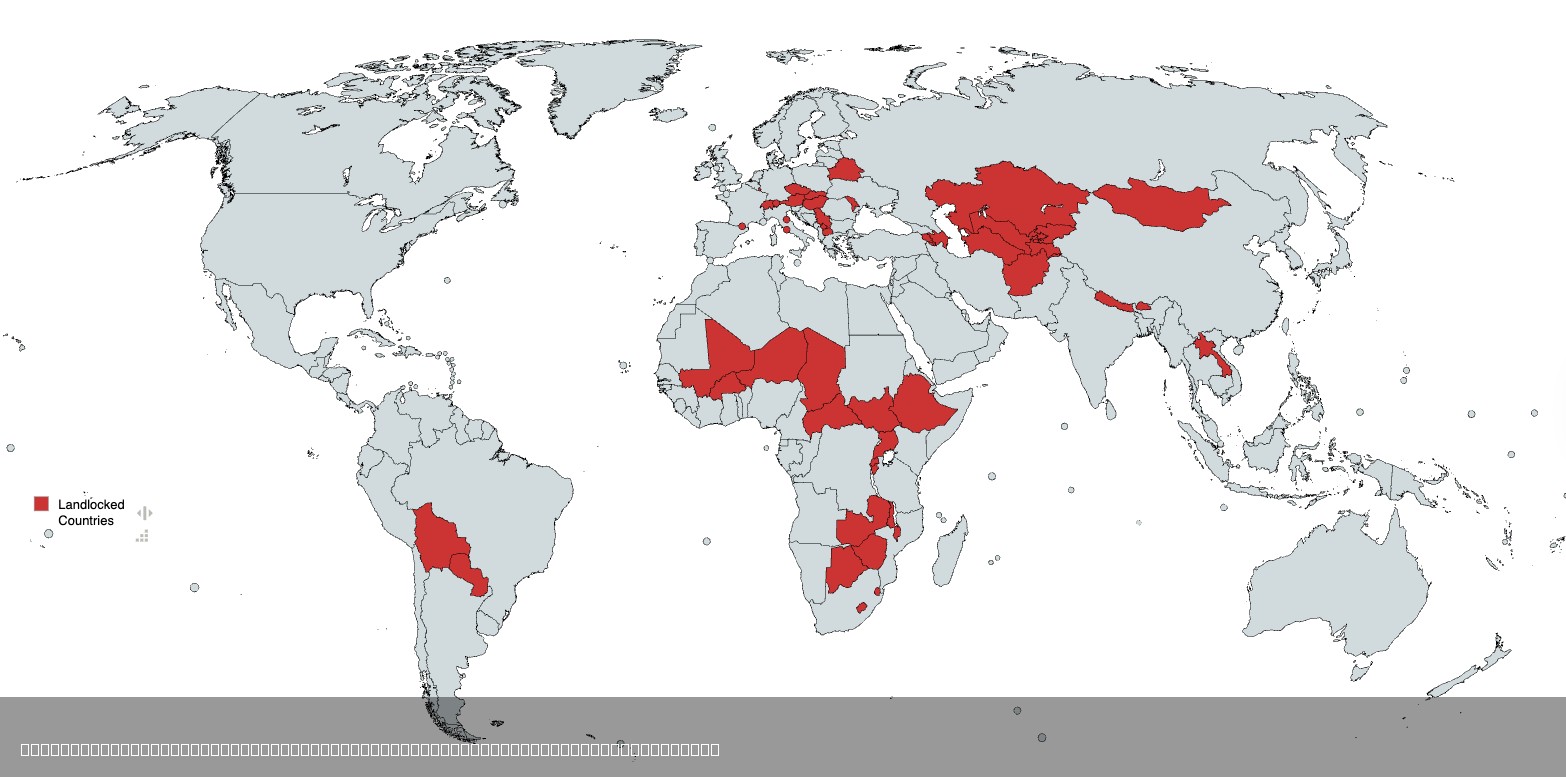
Map of All Landlocked Countries in the World
The visualization titled "All Landlocked Countries in the World" provides a clear representation of nations that do not ...
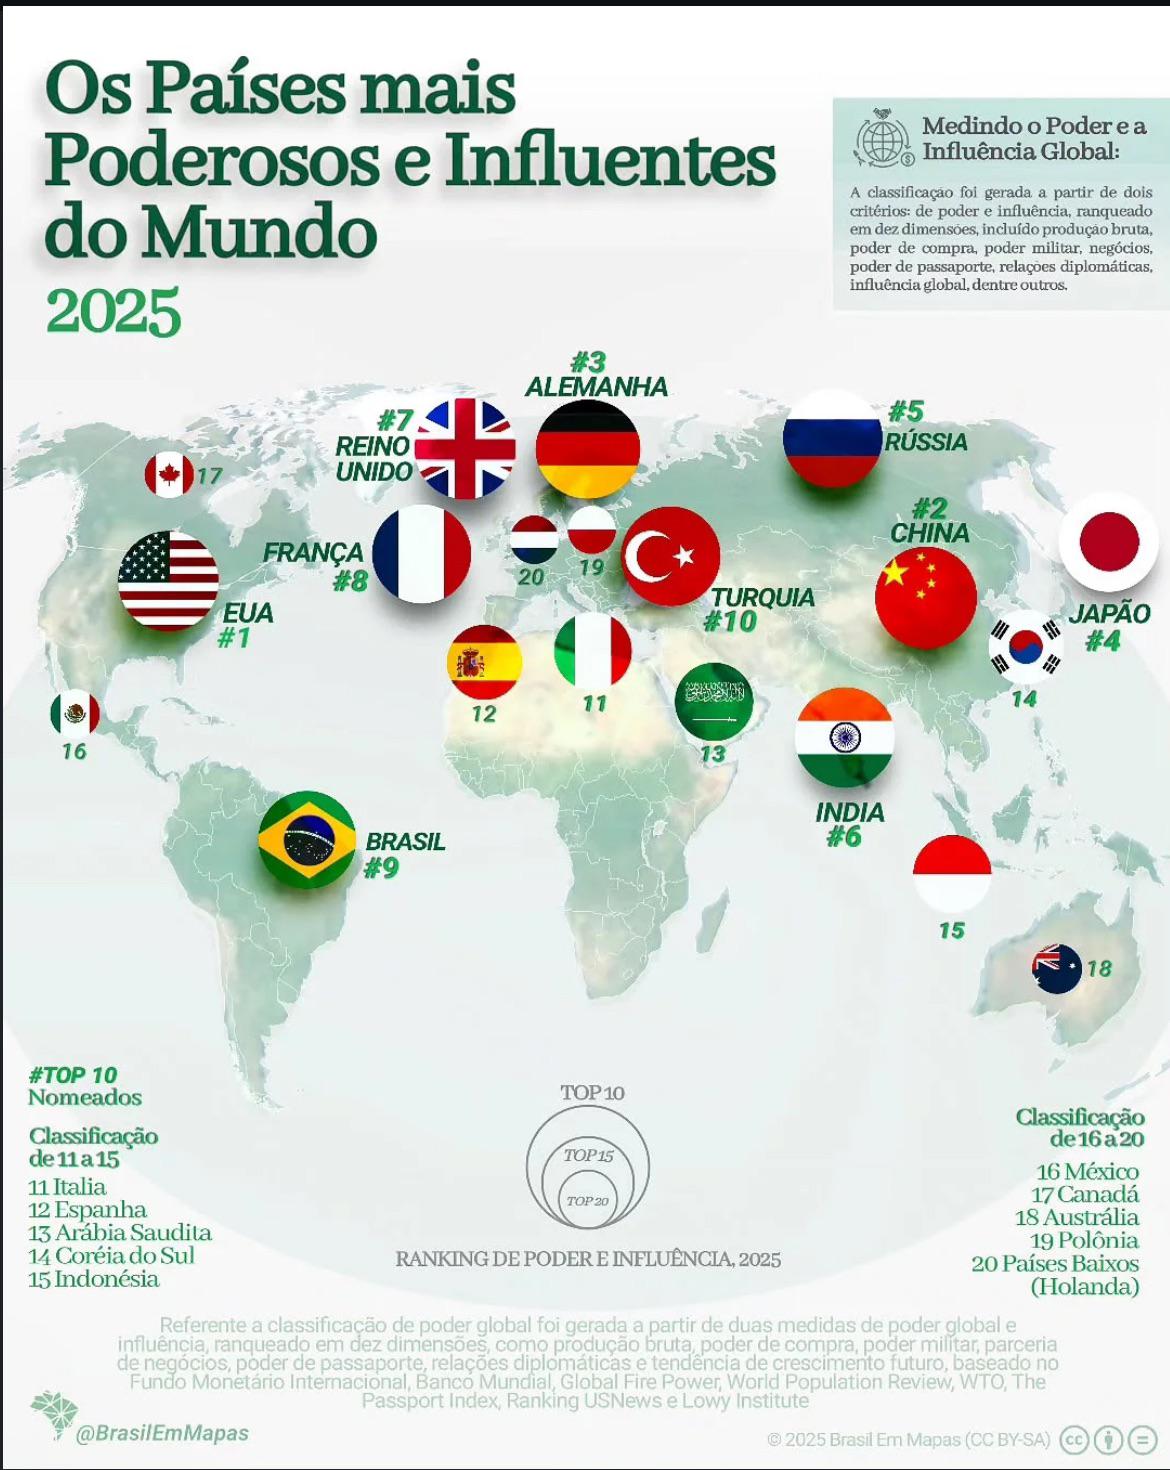
Powerful and Influential Countries Map 2025
This map titled "The Most Powerful and Influential Countries in the World 2025" provides a comprehensive overview of the...
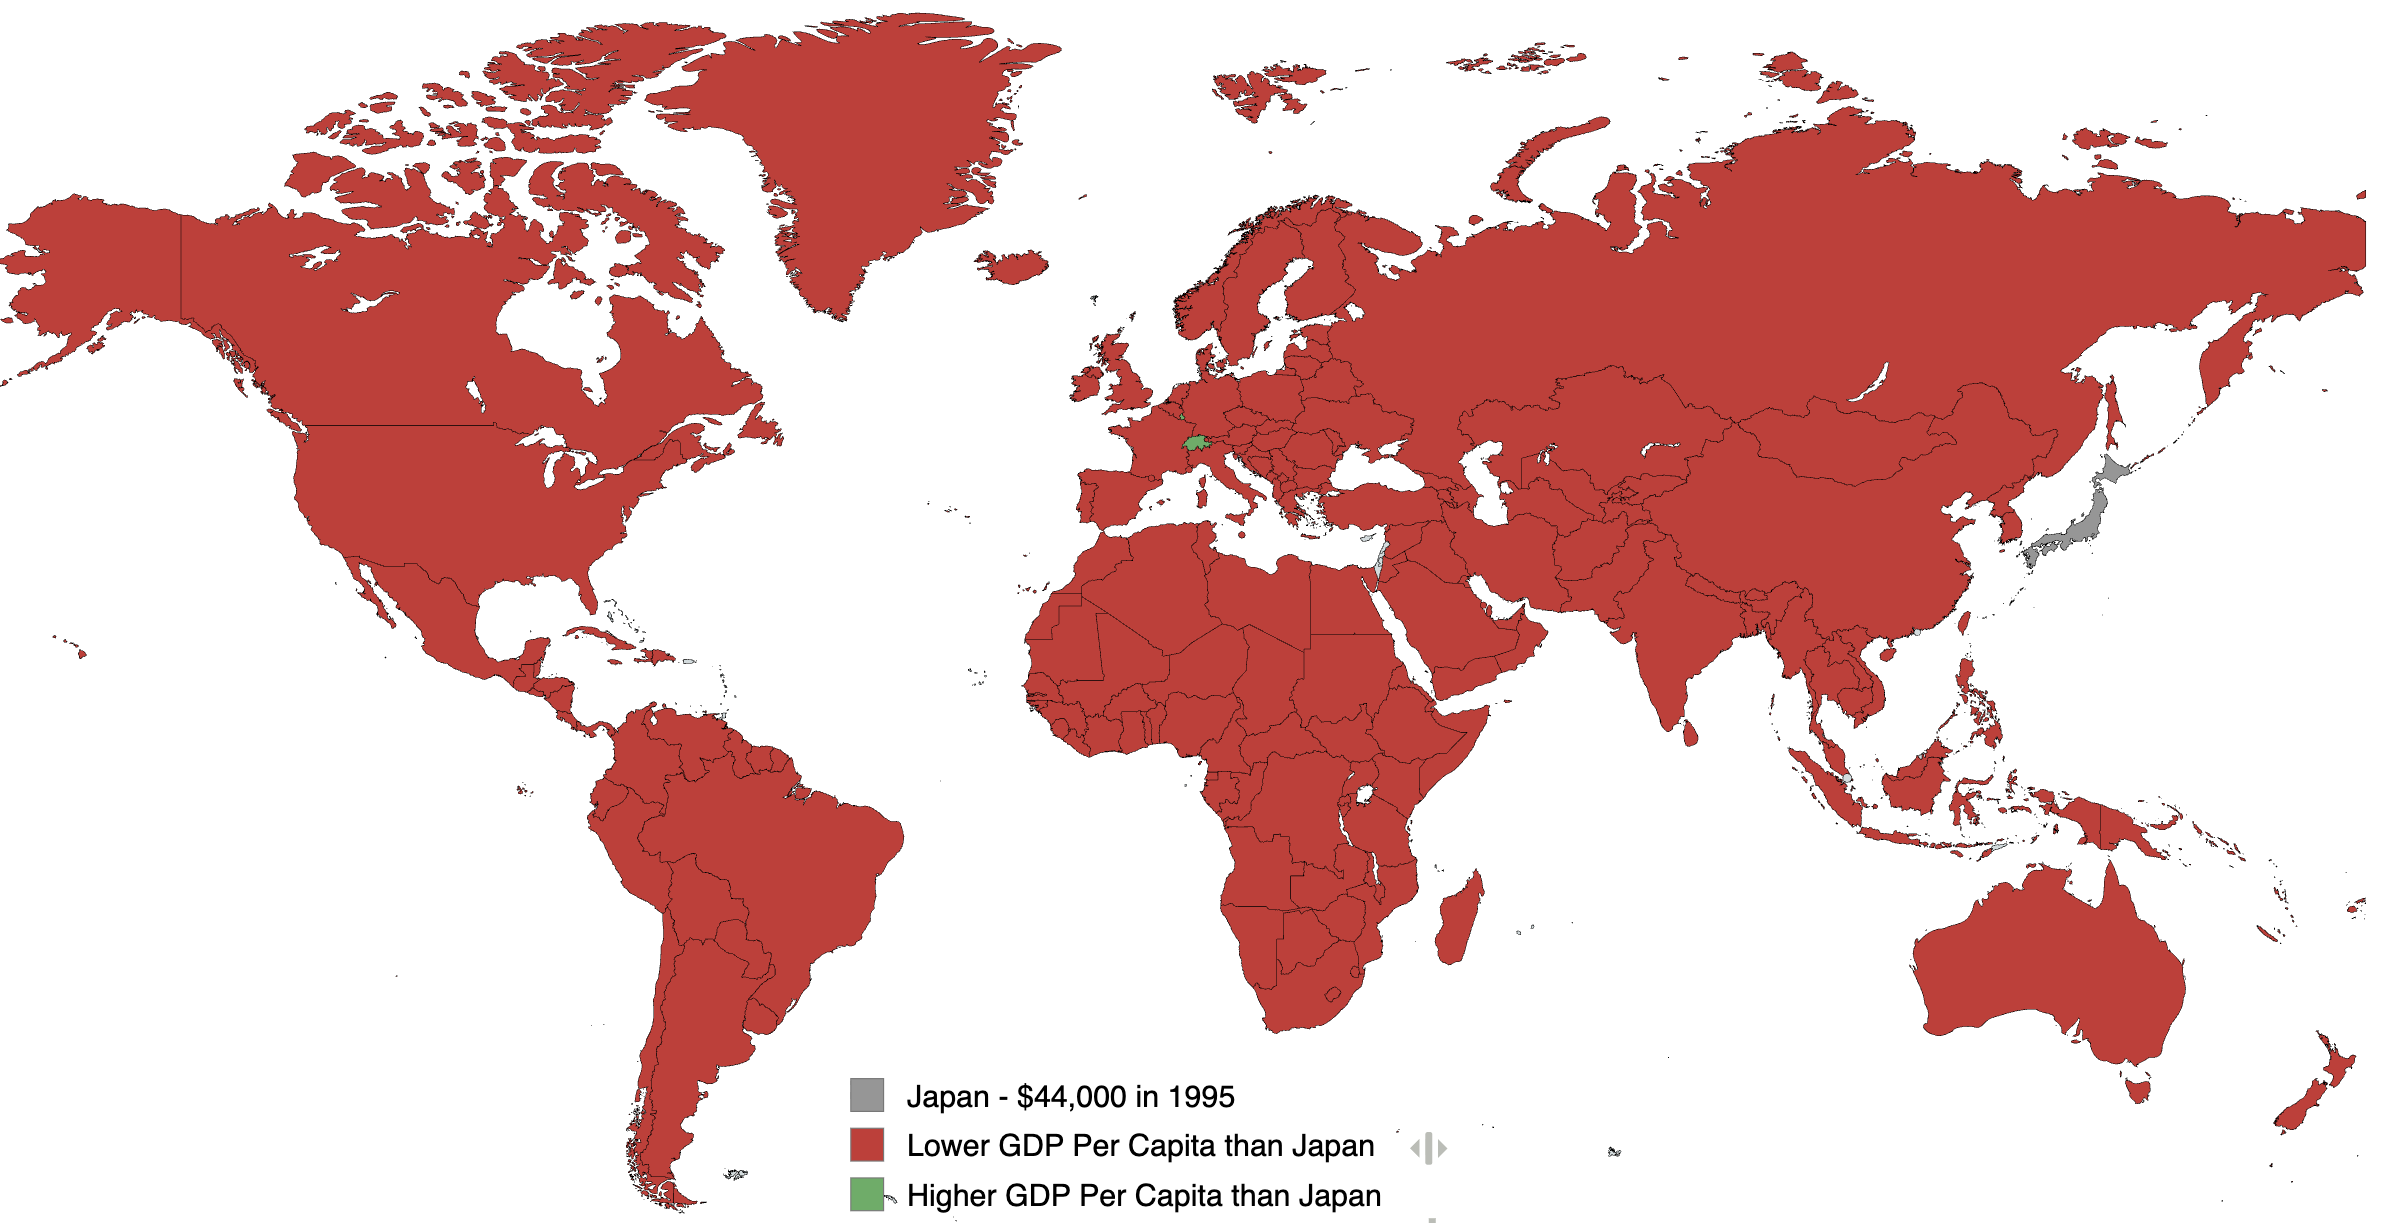
GDP Per Capita Map of Japan 1995
This visualization illustrates the GDP per capita of various countries in the year 1995, with Japan's GDP per capita peg...
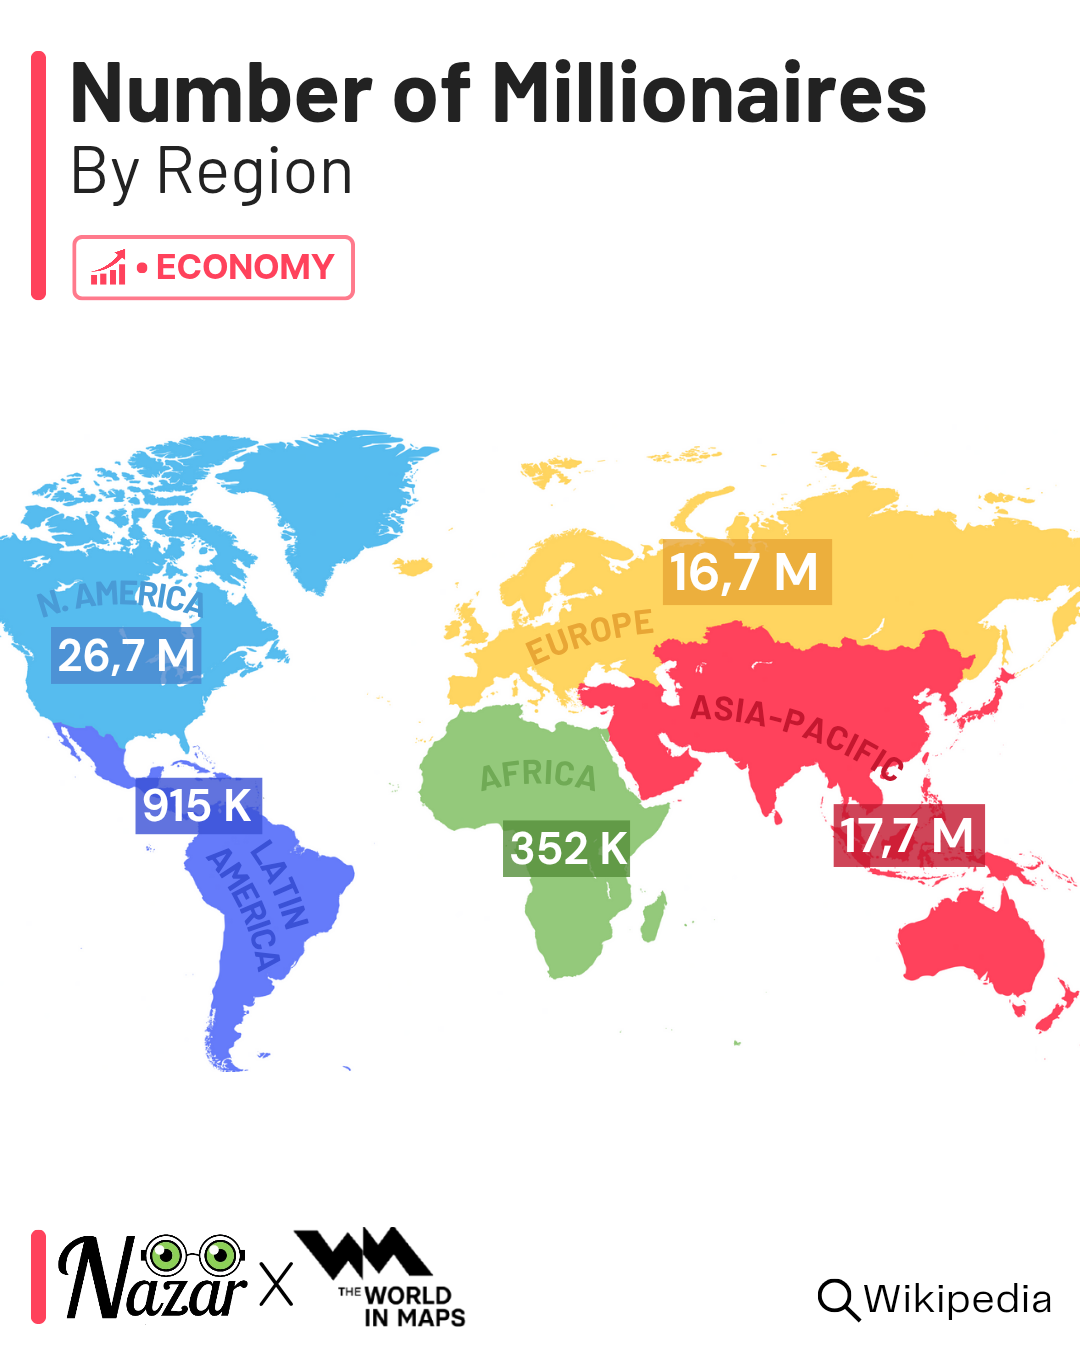
Map of Millionaires by Region
This map illustrates the distribution of millionaires across various global regions, providing a visual representation o...

Biggest Companies by Country Map
The "Biggest Companies by Country Map" provides a visual representation of the largest corporations in various countries...
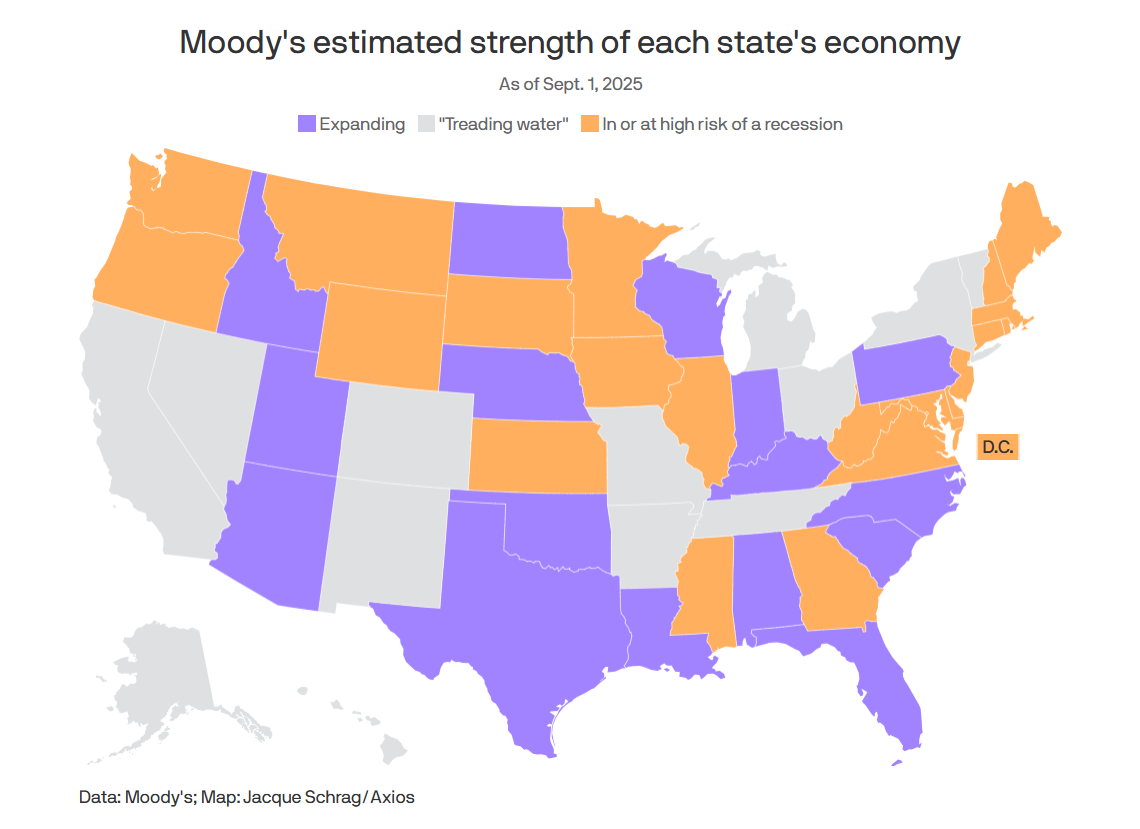
Recession in US States Map September 2025
The "Recession in US States (September 2025)" map provides a detailed visualization of the economic landscape across the...
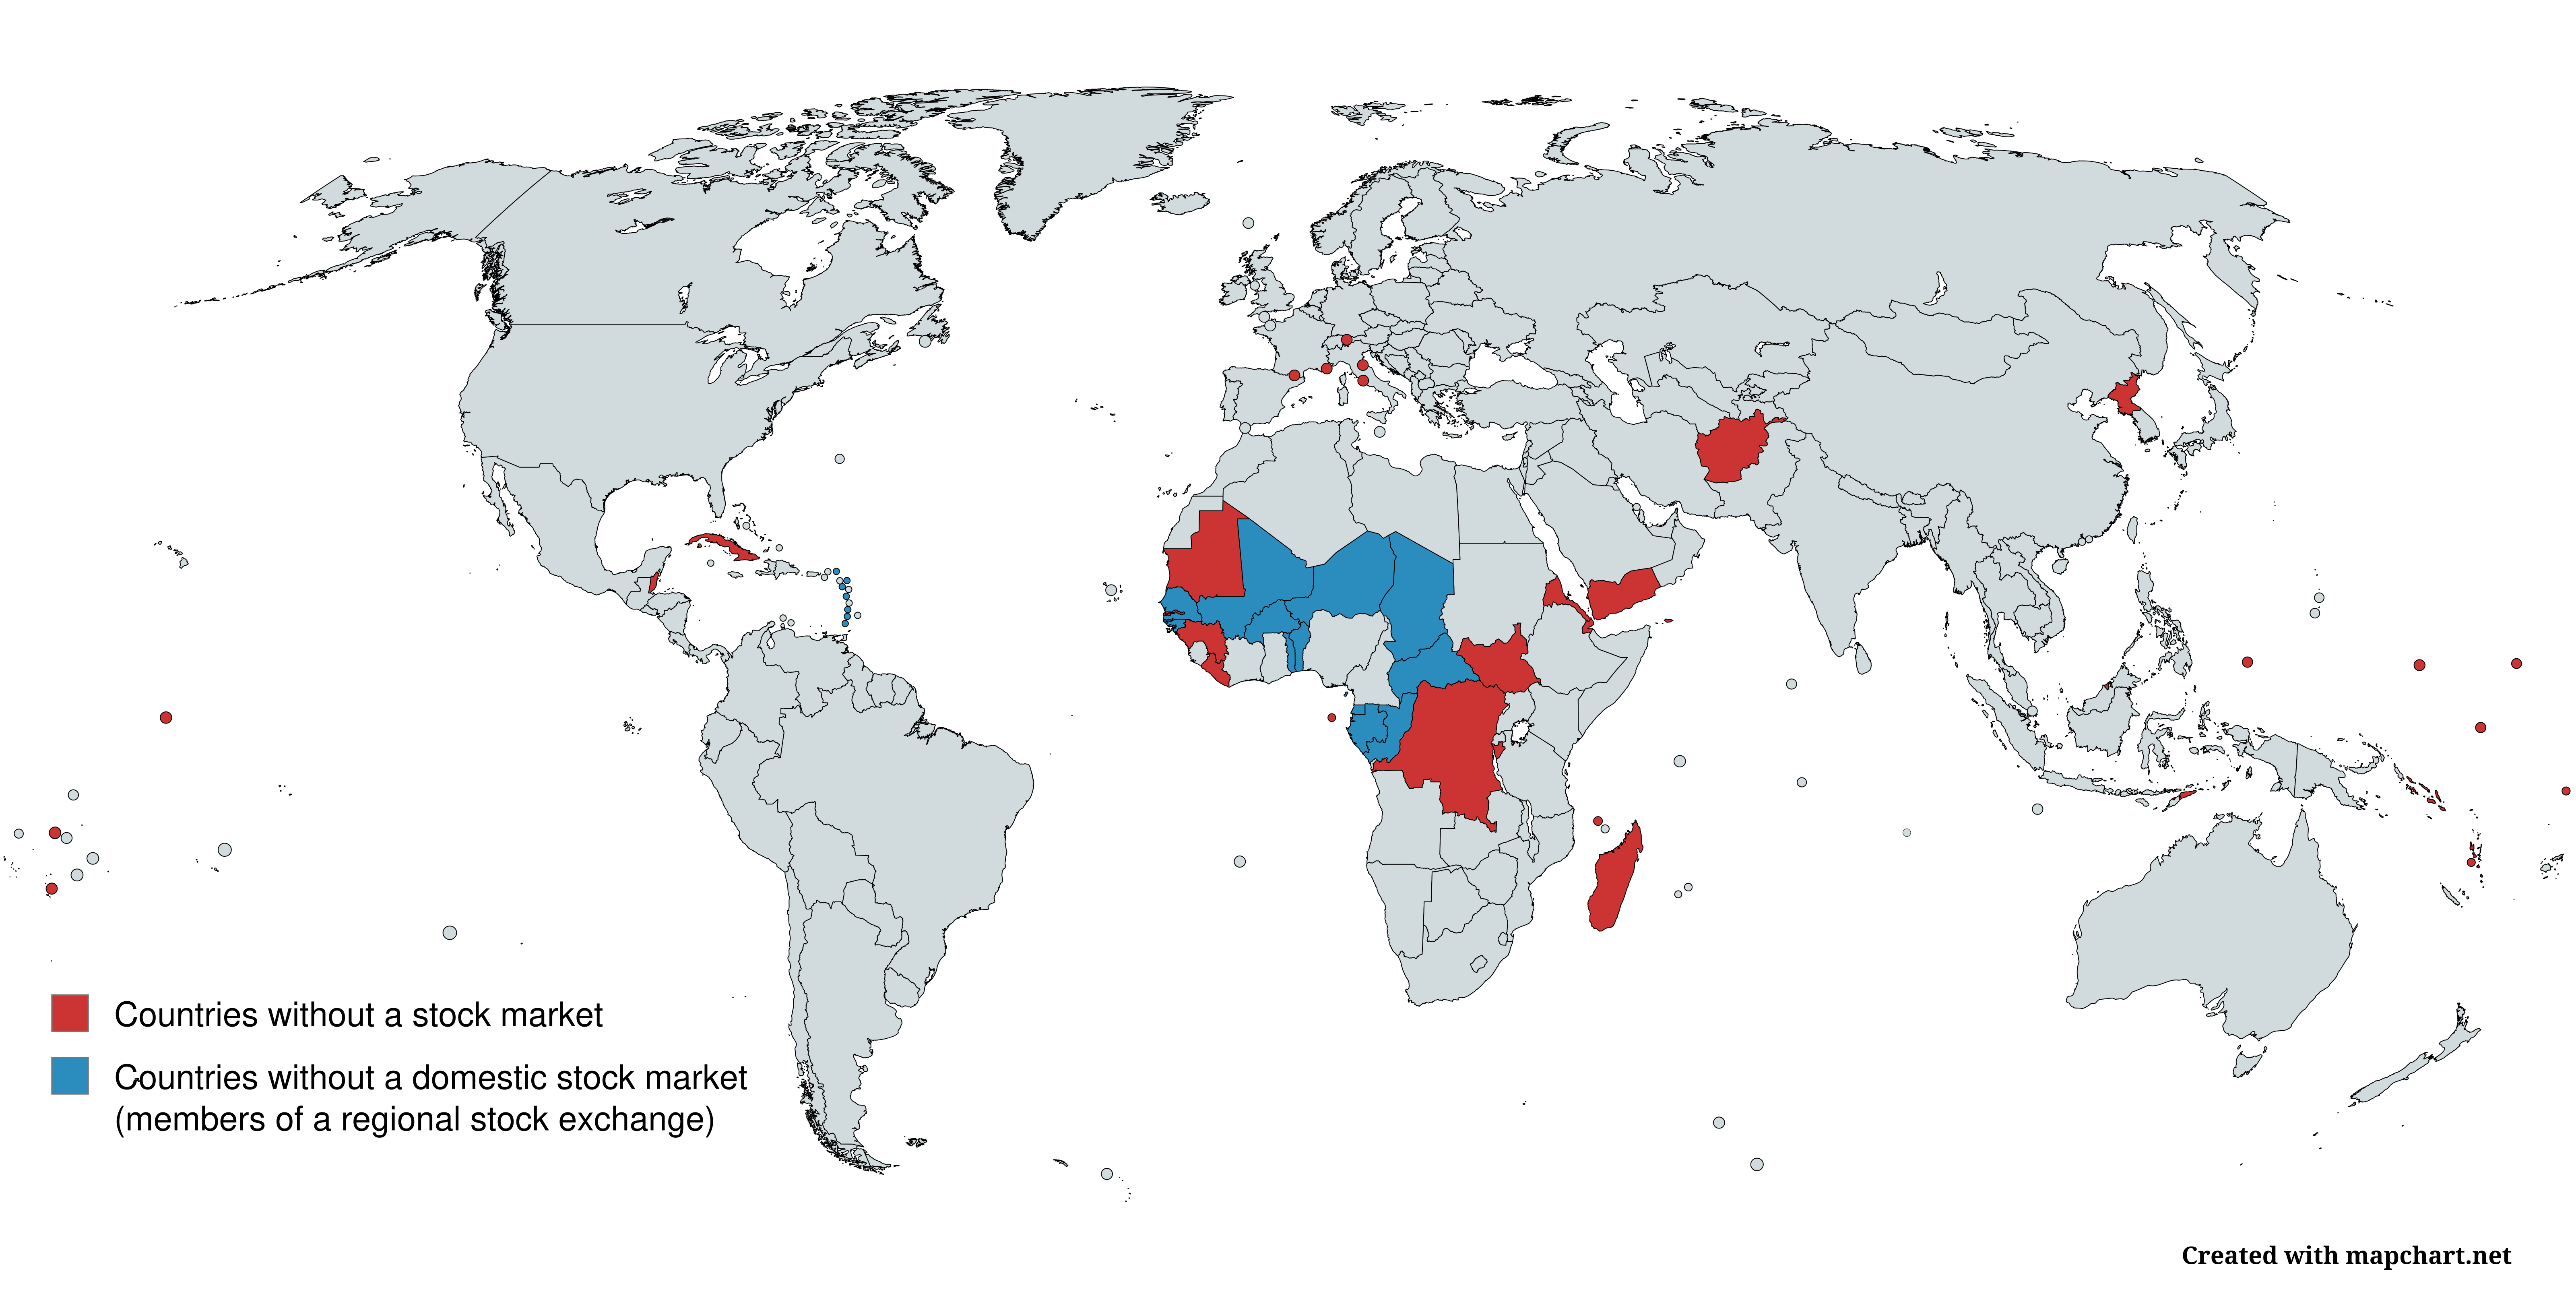
Countries Without a Stock Market Map
This map highlights countries that do not have a functioning stock market. A stock market is a vital component of a mode...
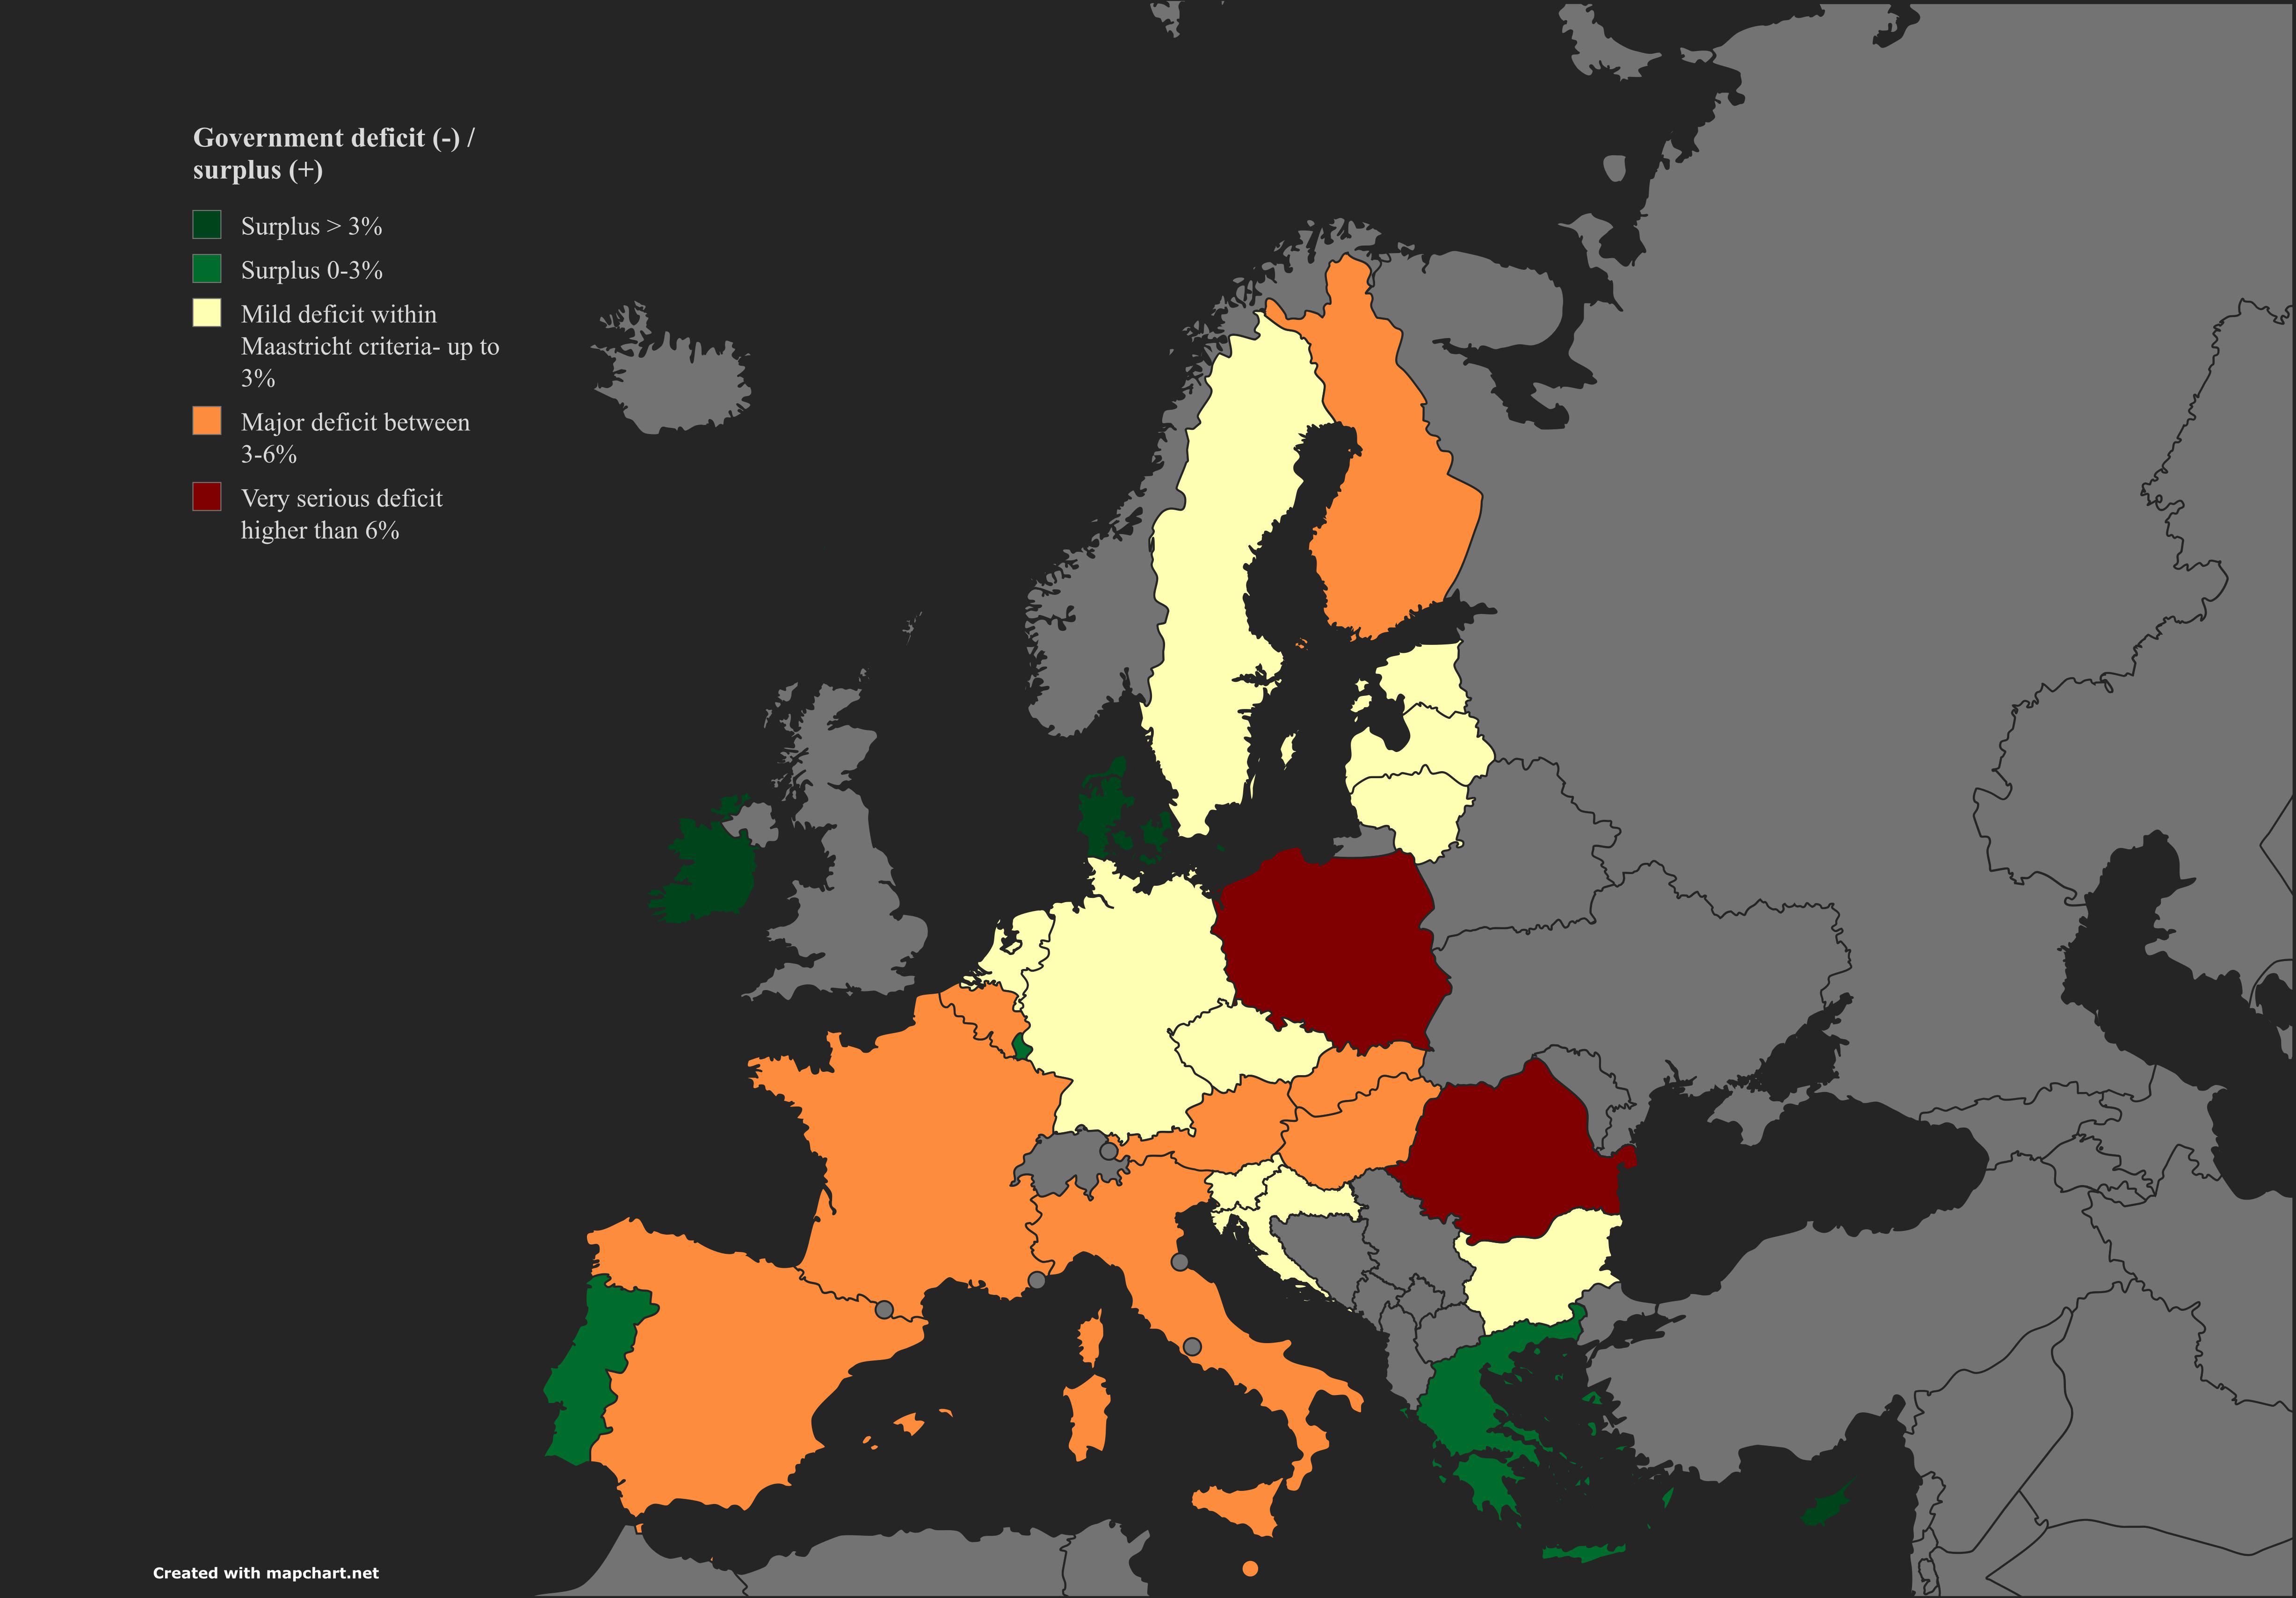
Fiscally Responsible Countries in Europe Map
The map titled "Which countries were the most fiscally responsible in Europe during 2024?" provides a clear visualizatio...
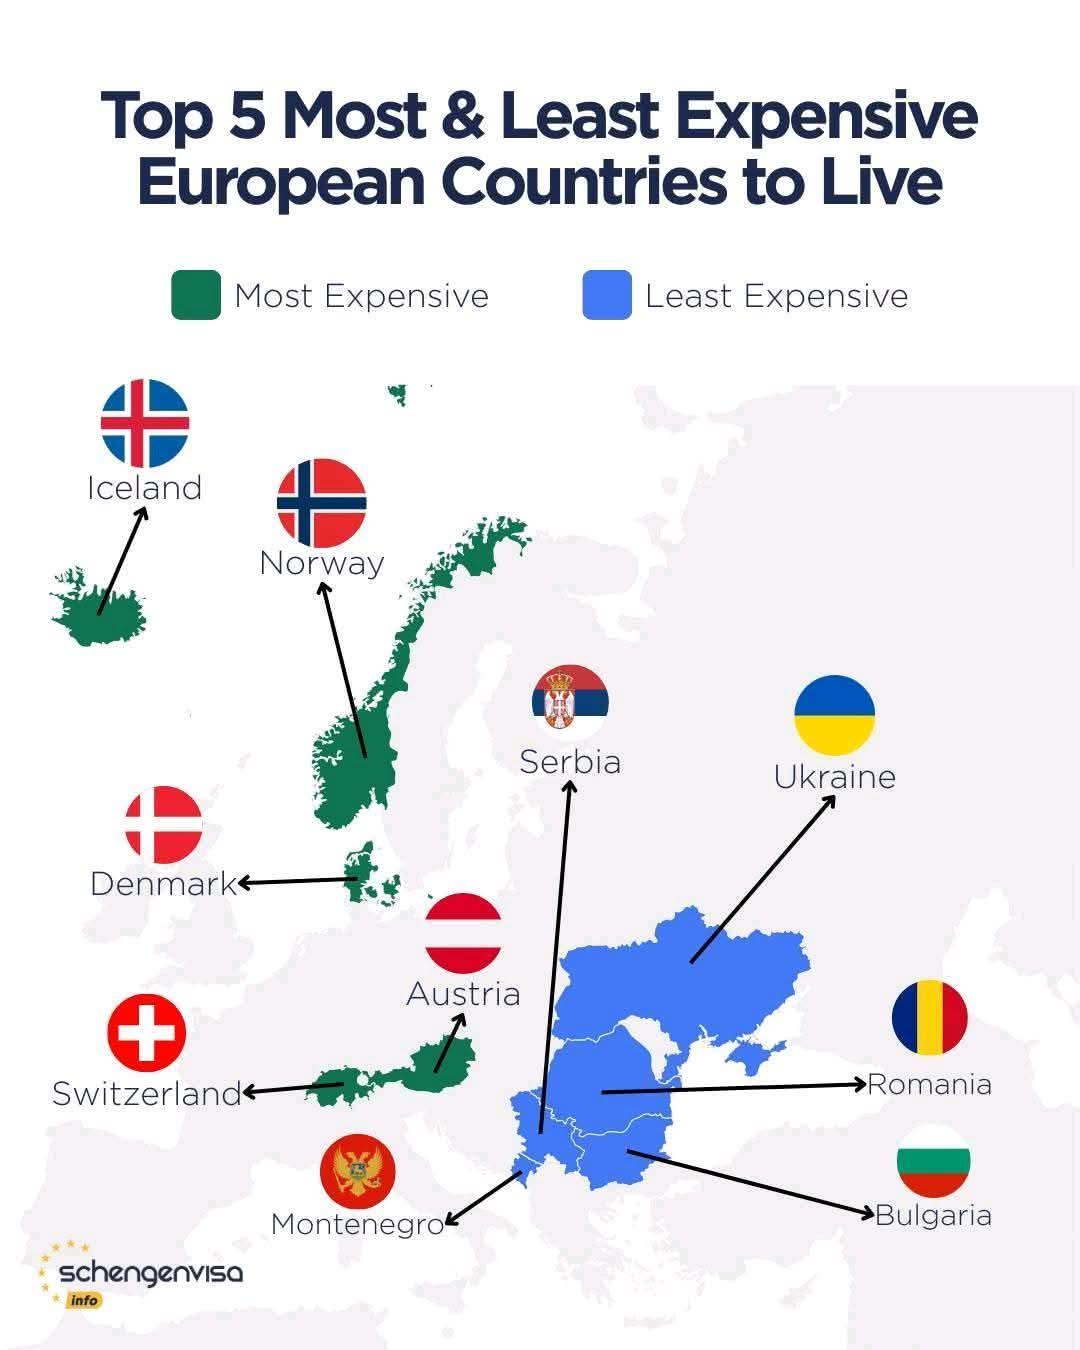
Affordable Living Map of Europe
The "Affordable Living Map of Europe" provides a comprehensive visualization of the varying costs of living across diffe...
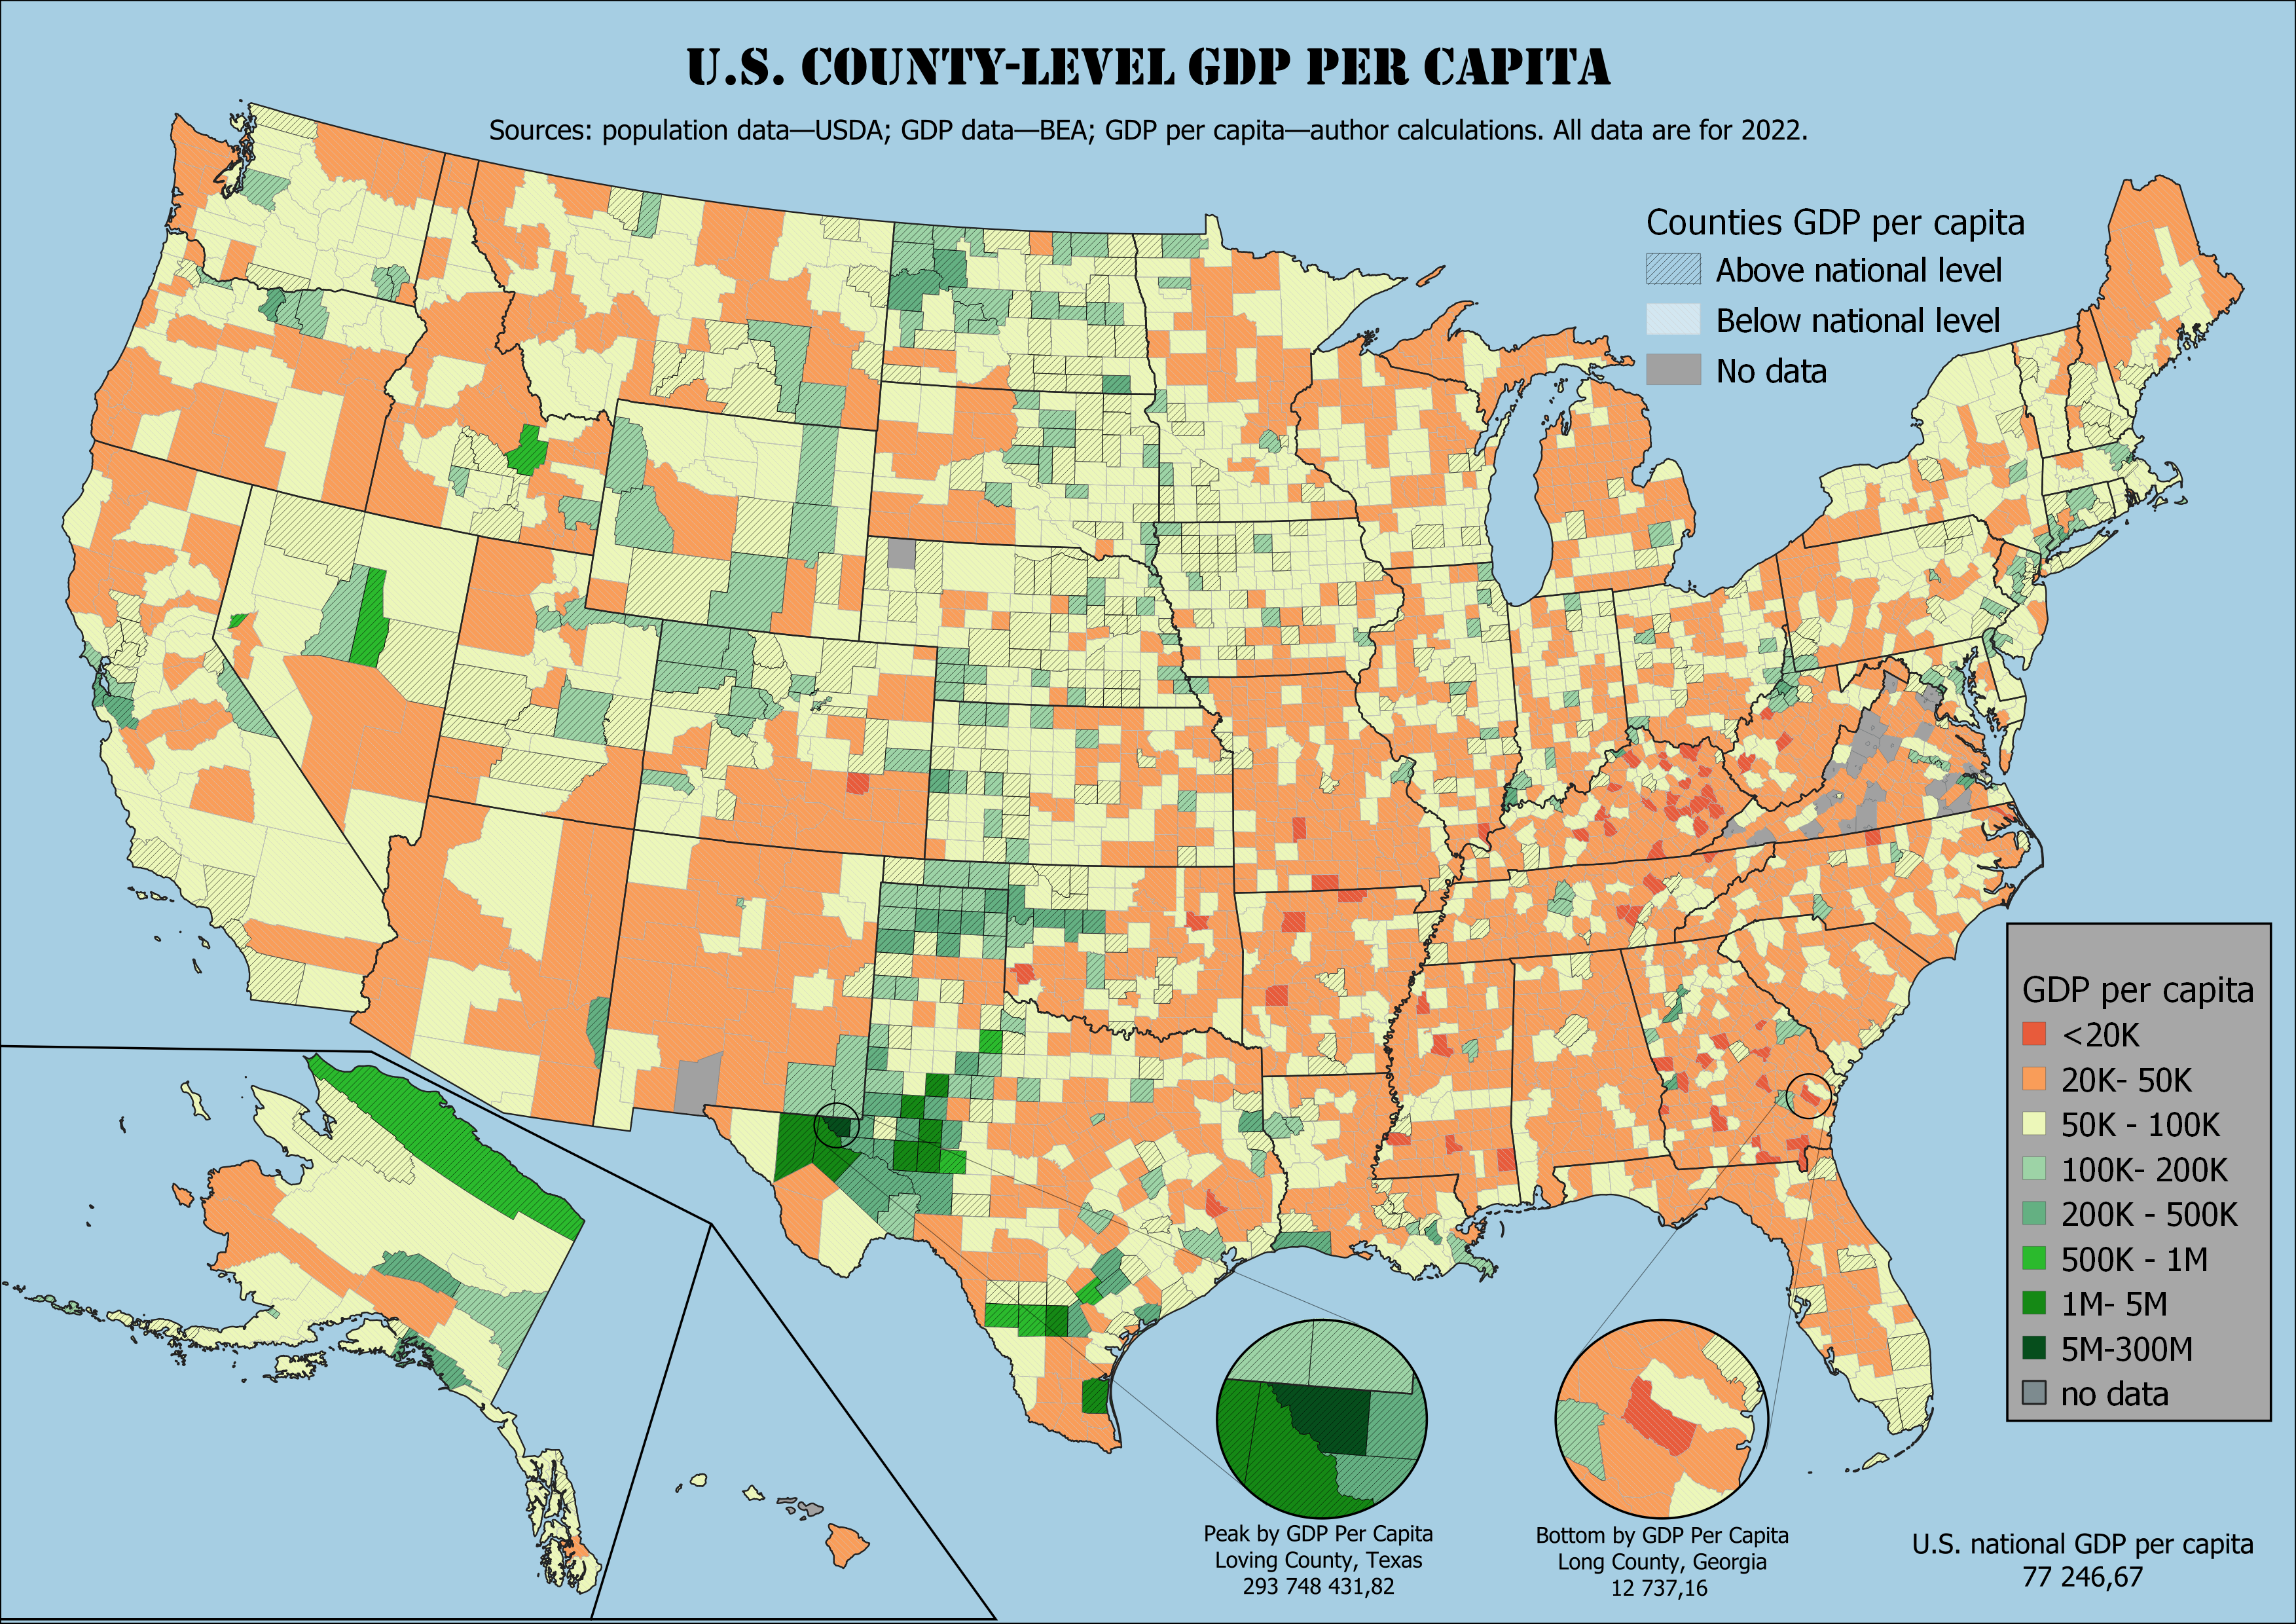
US County-Level GDP Per Capita Map 2022
The "US County-Level GDP Per Capita, 2022" map provides a detailed visualization of the economic performance across vari...
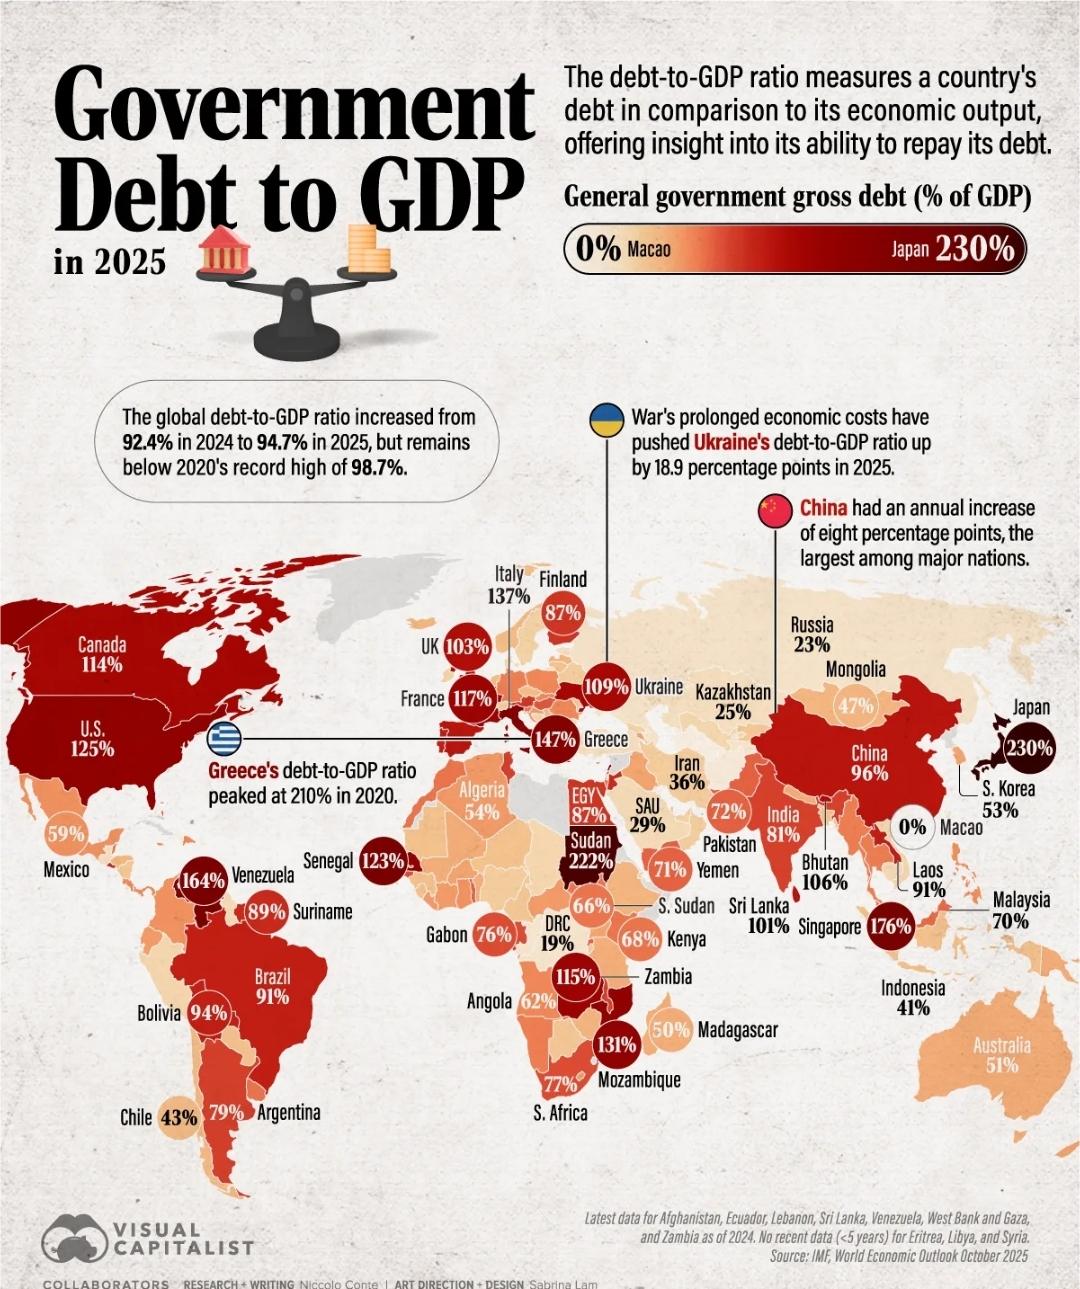
Government Debt to GDP Map
The "Government Debt to GDP Map" visualizes the ratio of a country's public debt to its Gross Domestic Product (GDP). Th...
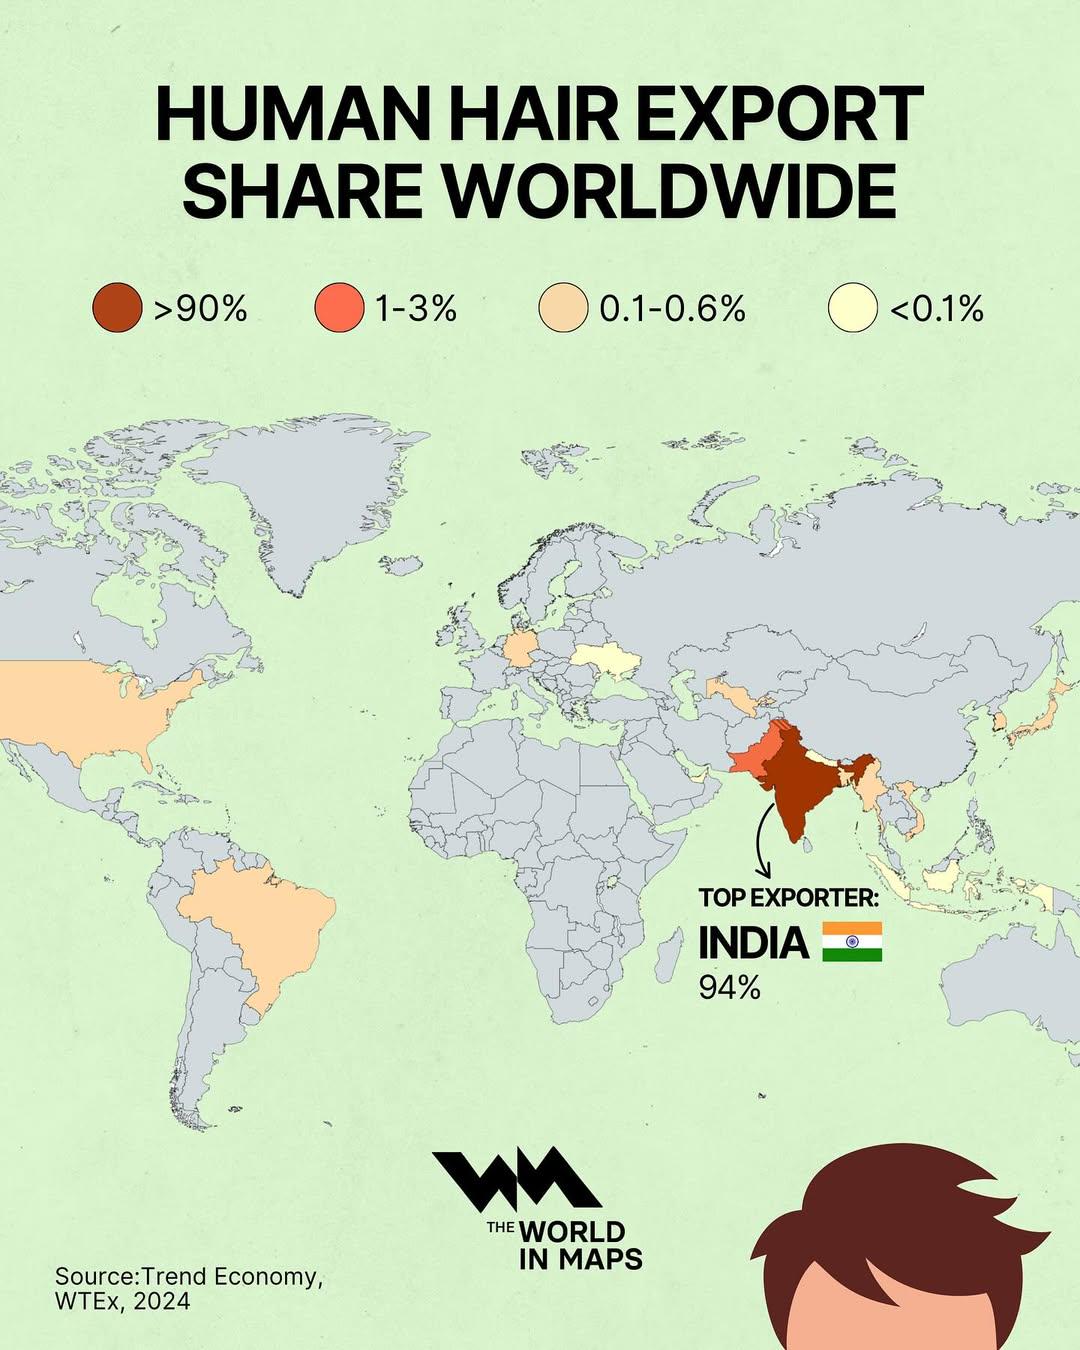
Human Hair Export by Share Worldwide Map
The "Human Hair Export by Share Worldwide Map" provides a clear visual representation of the global trade in human hair,...
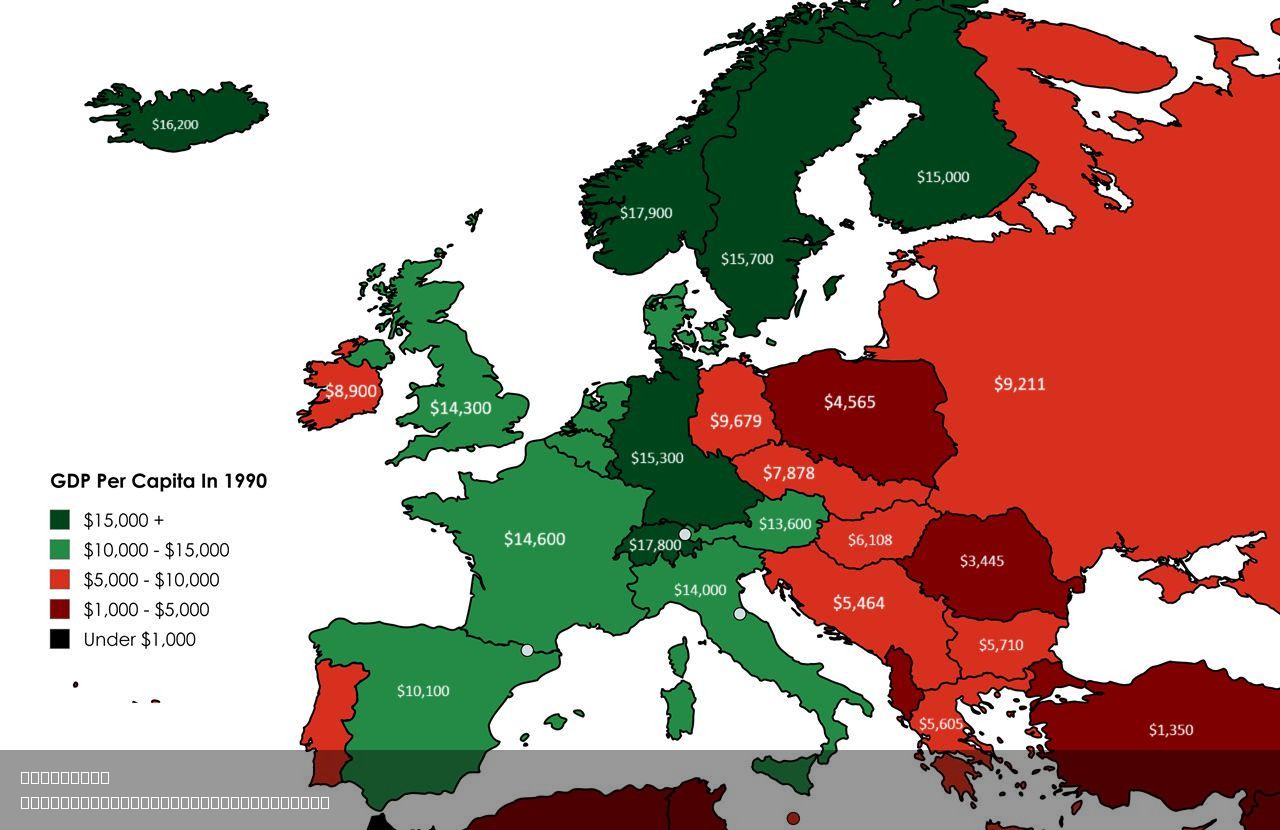
GDP Per Capita by Country Map 1990
The map titled "European GDP Per Capita in 1990" provides a visual representation of the economic output per person acro...
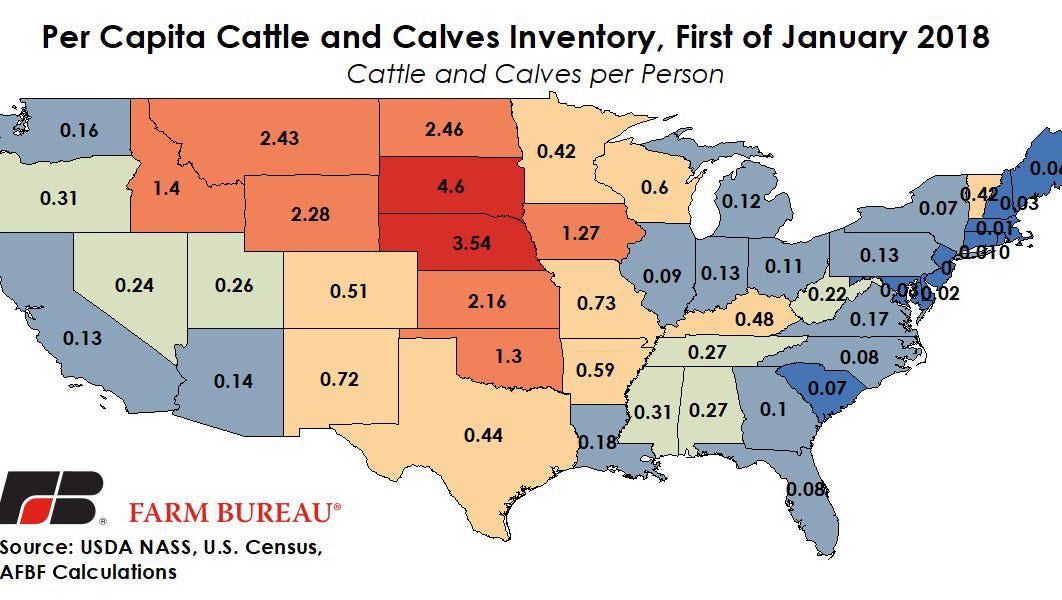
Number of Cows Per Person in Each State Map
The "Number of Cows Per Person in Each State" map provides an insightful visualization of how the cattle population in e...
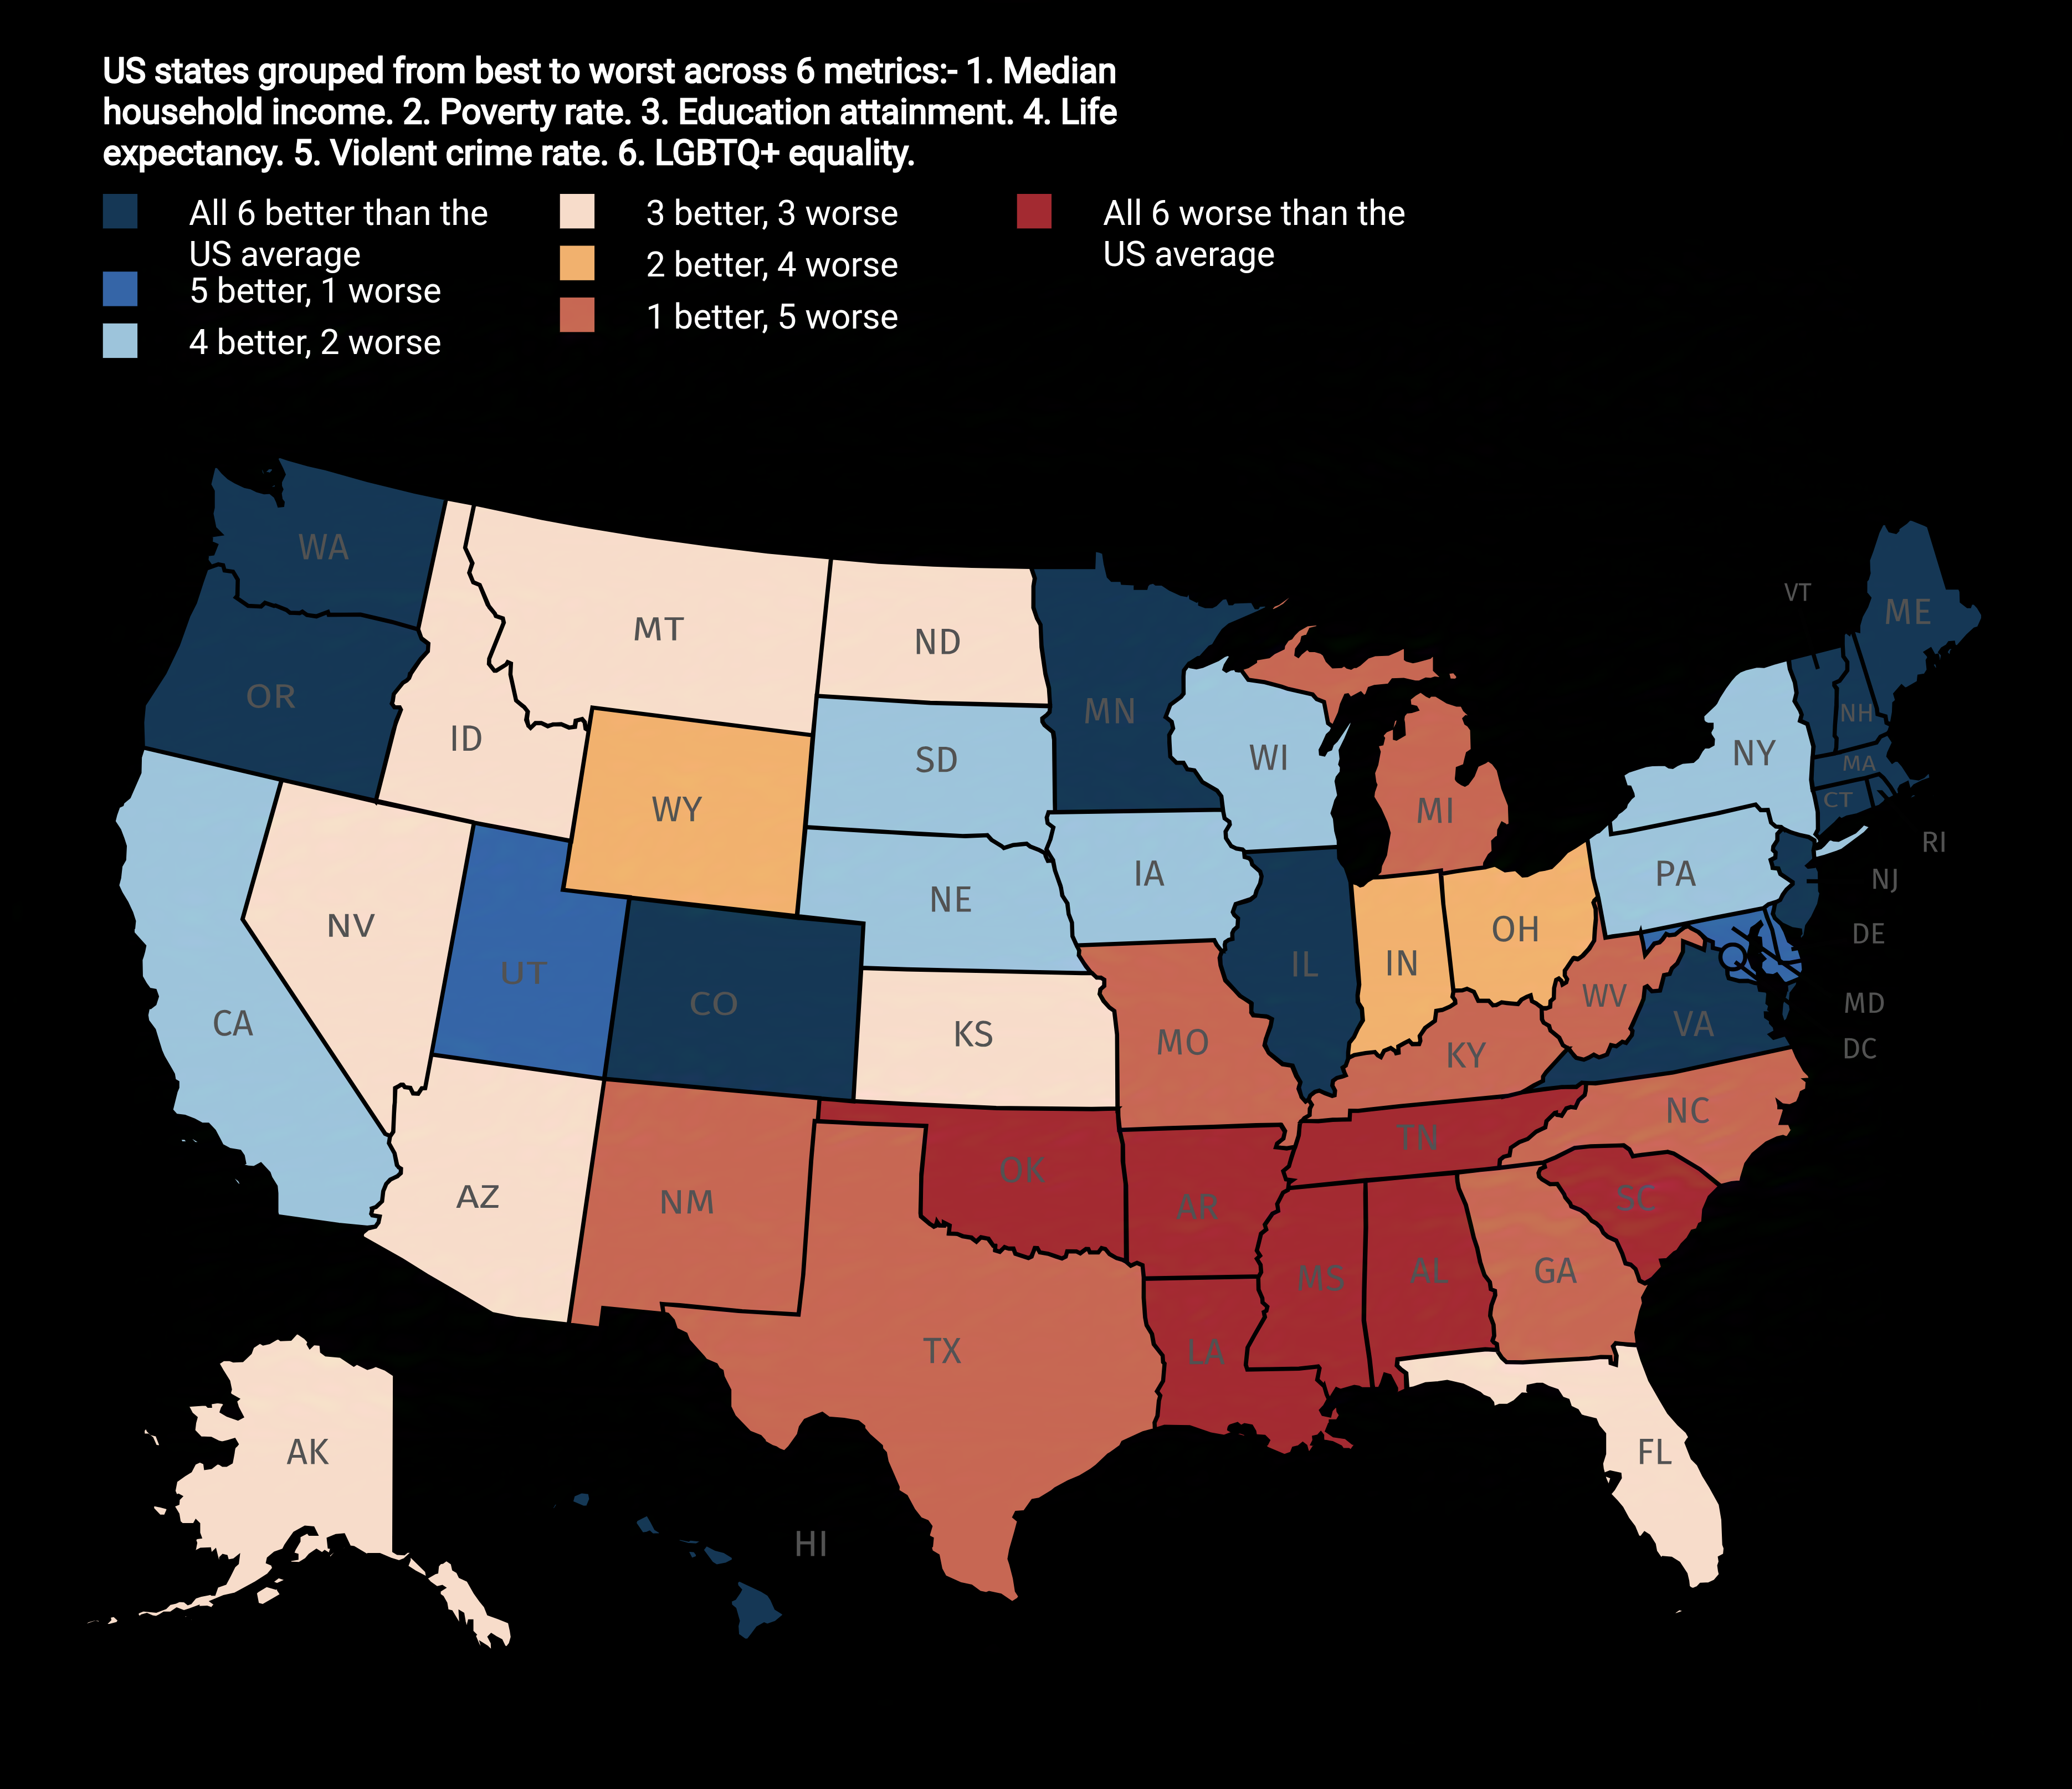
US States Ranked from Best to Worst Map
The "US States Ranked from Best to Worst Map" provides a visual representation of how each state in the United States me...

Tariff Percentages Imposed by US Map
Historically, tariffs have played a crucial role in shaping nations' economies. For example, the Smoot-Hawley Tariff Act...
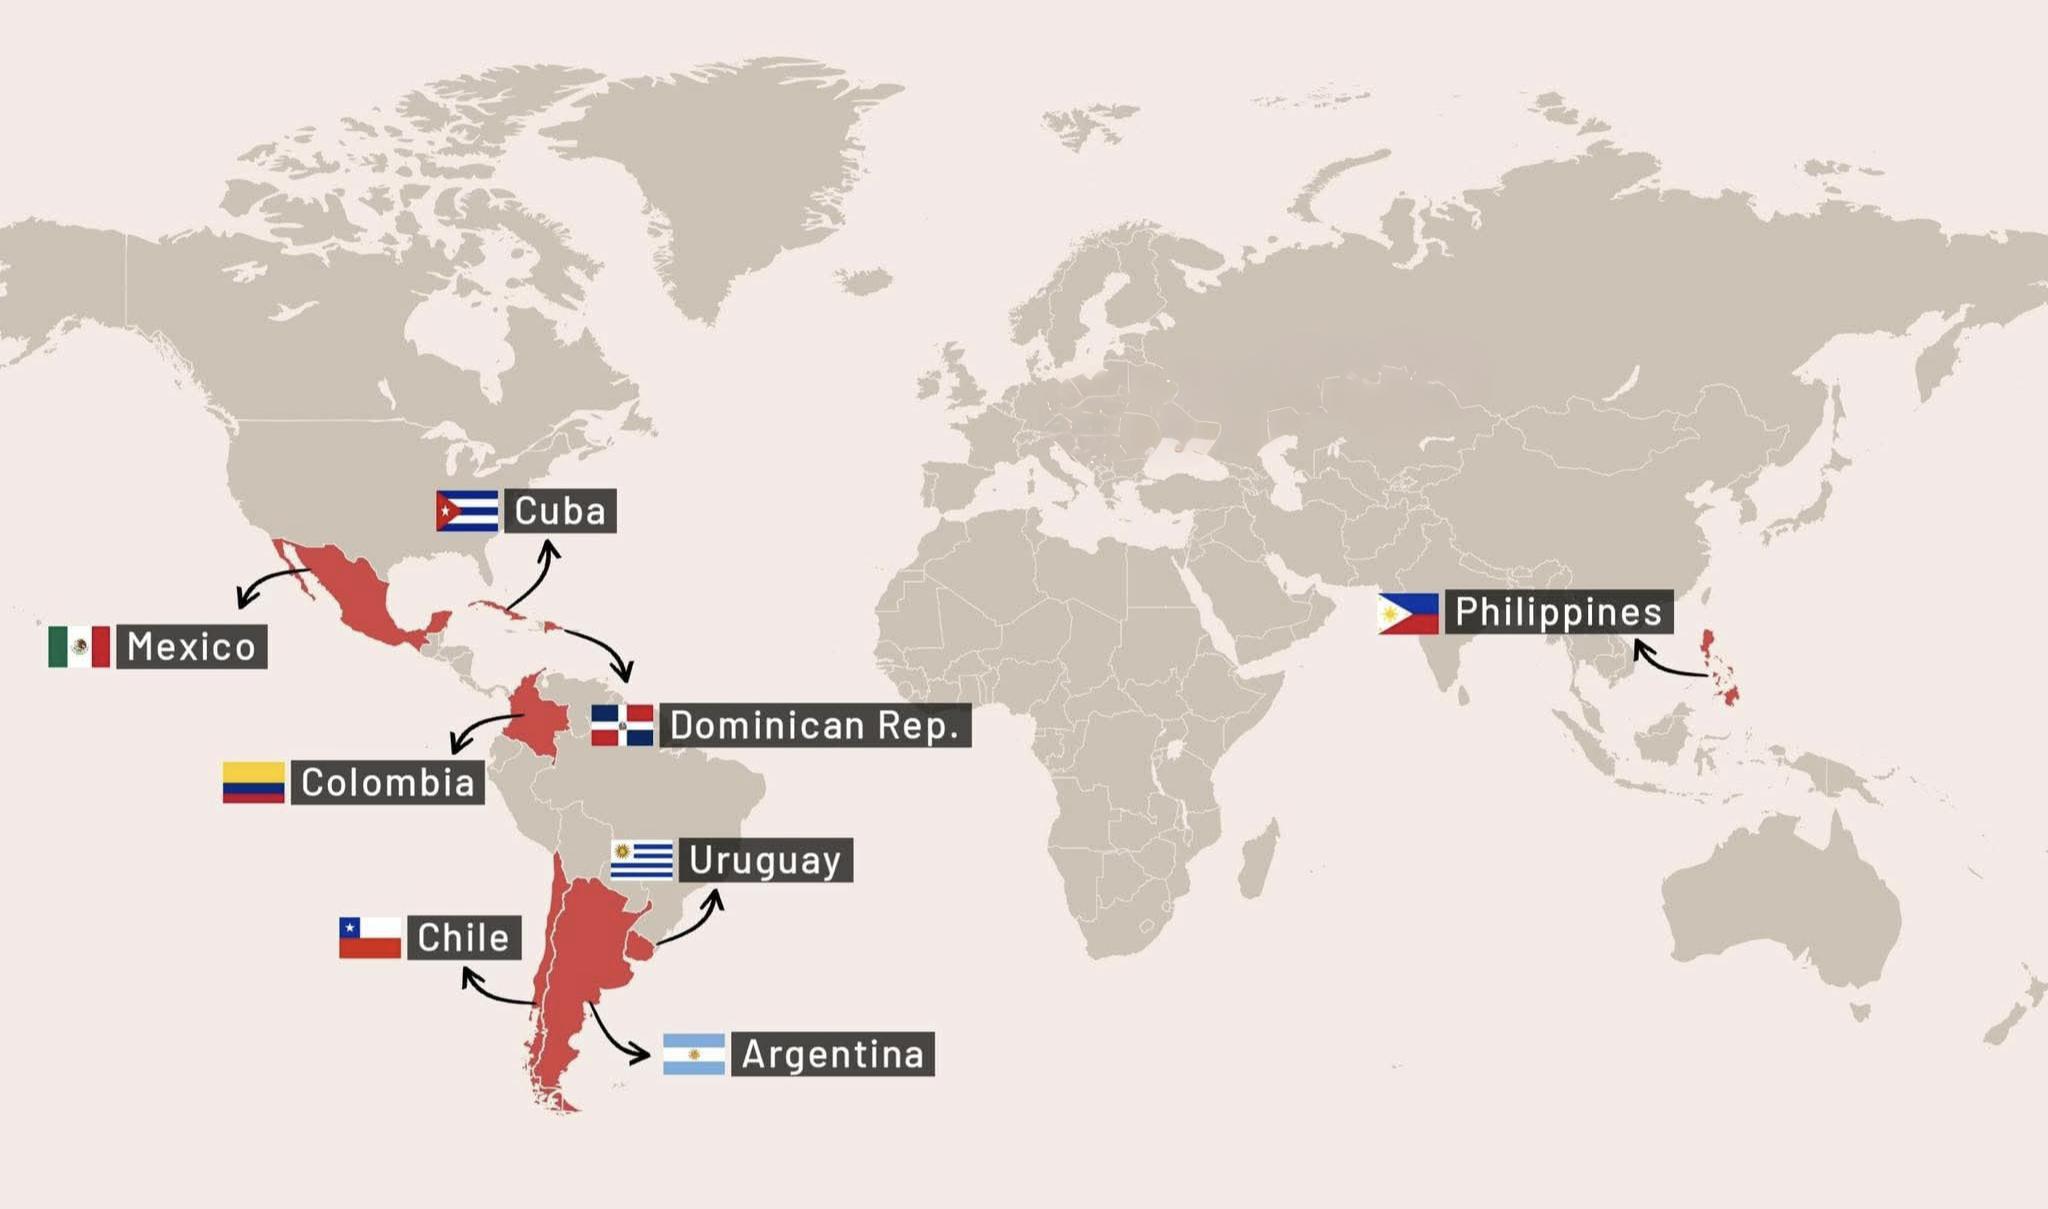
Countries Using Peso as Currency Map
This map displays the countries that utilize or refer to their currency as "Peso." The Peso has a rich history and is cu...
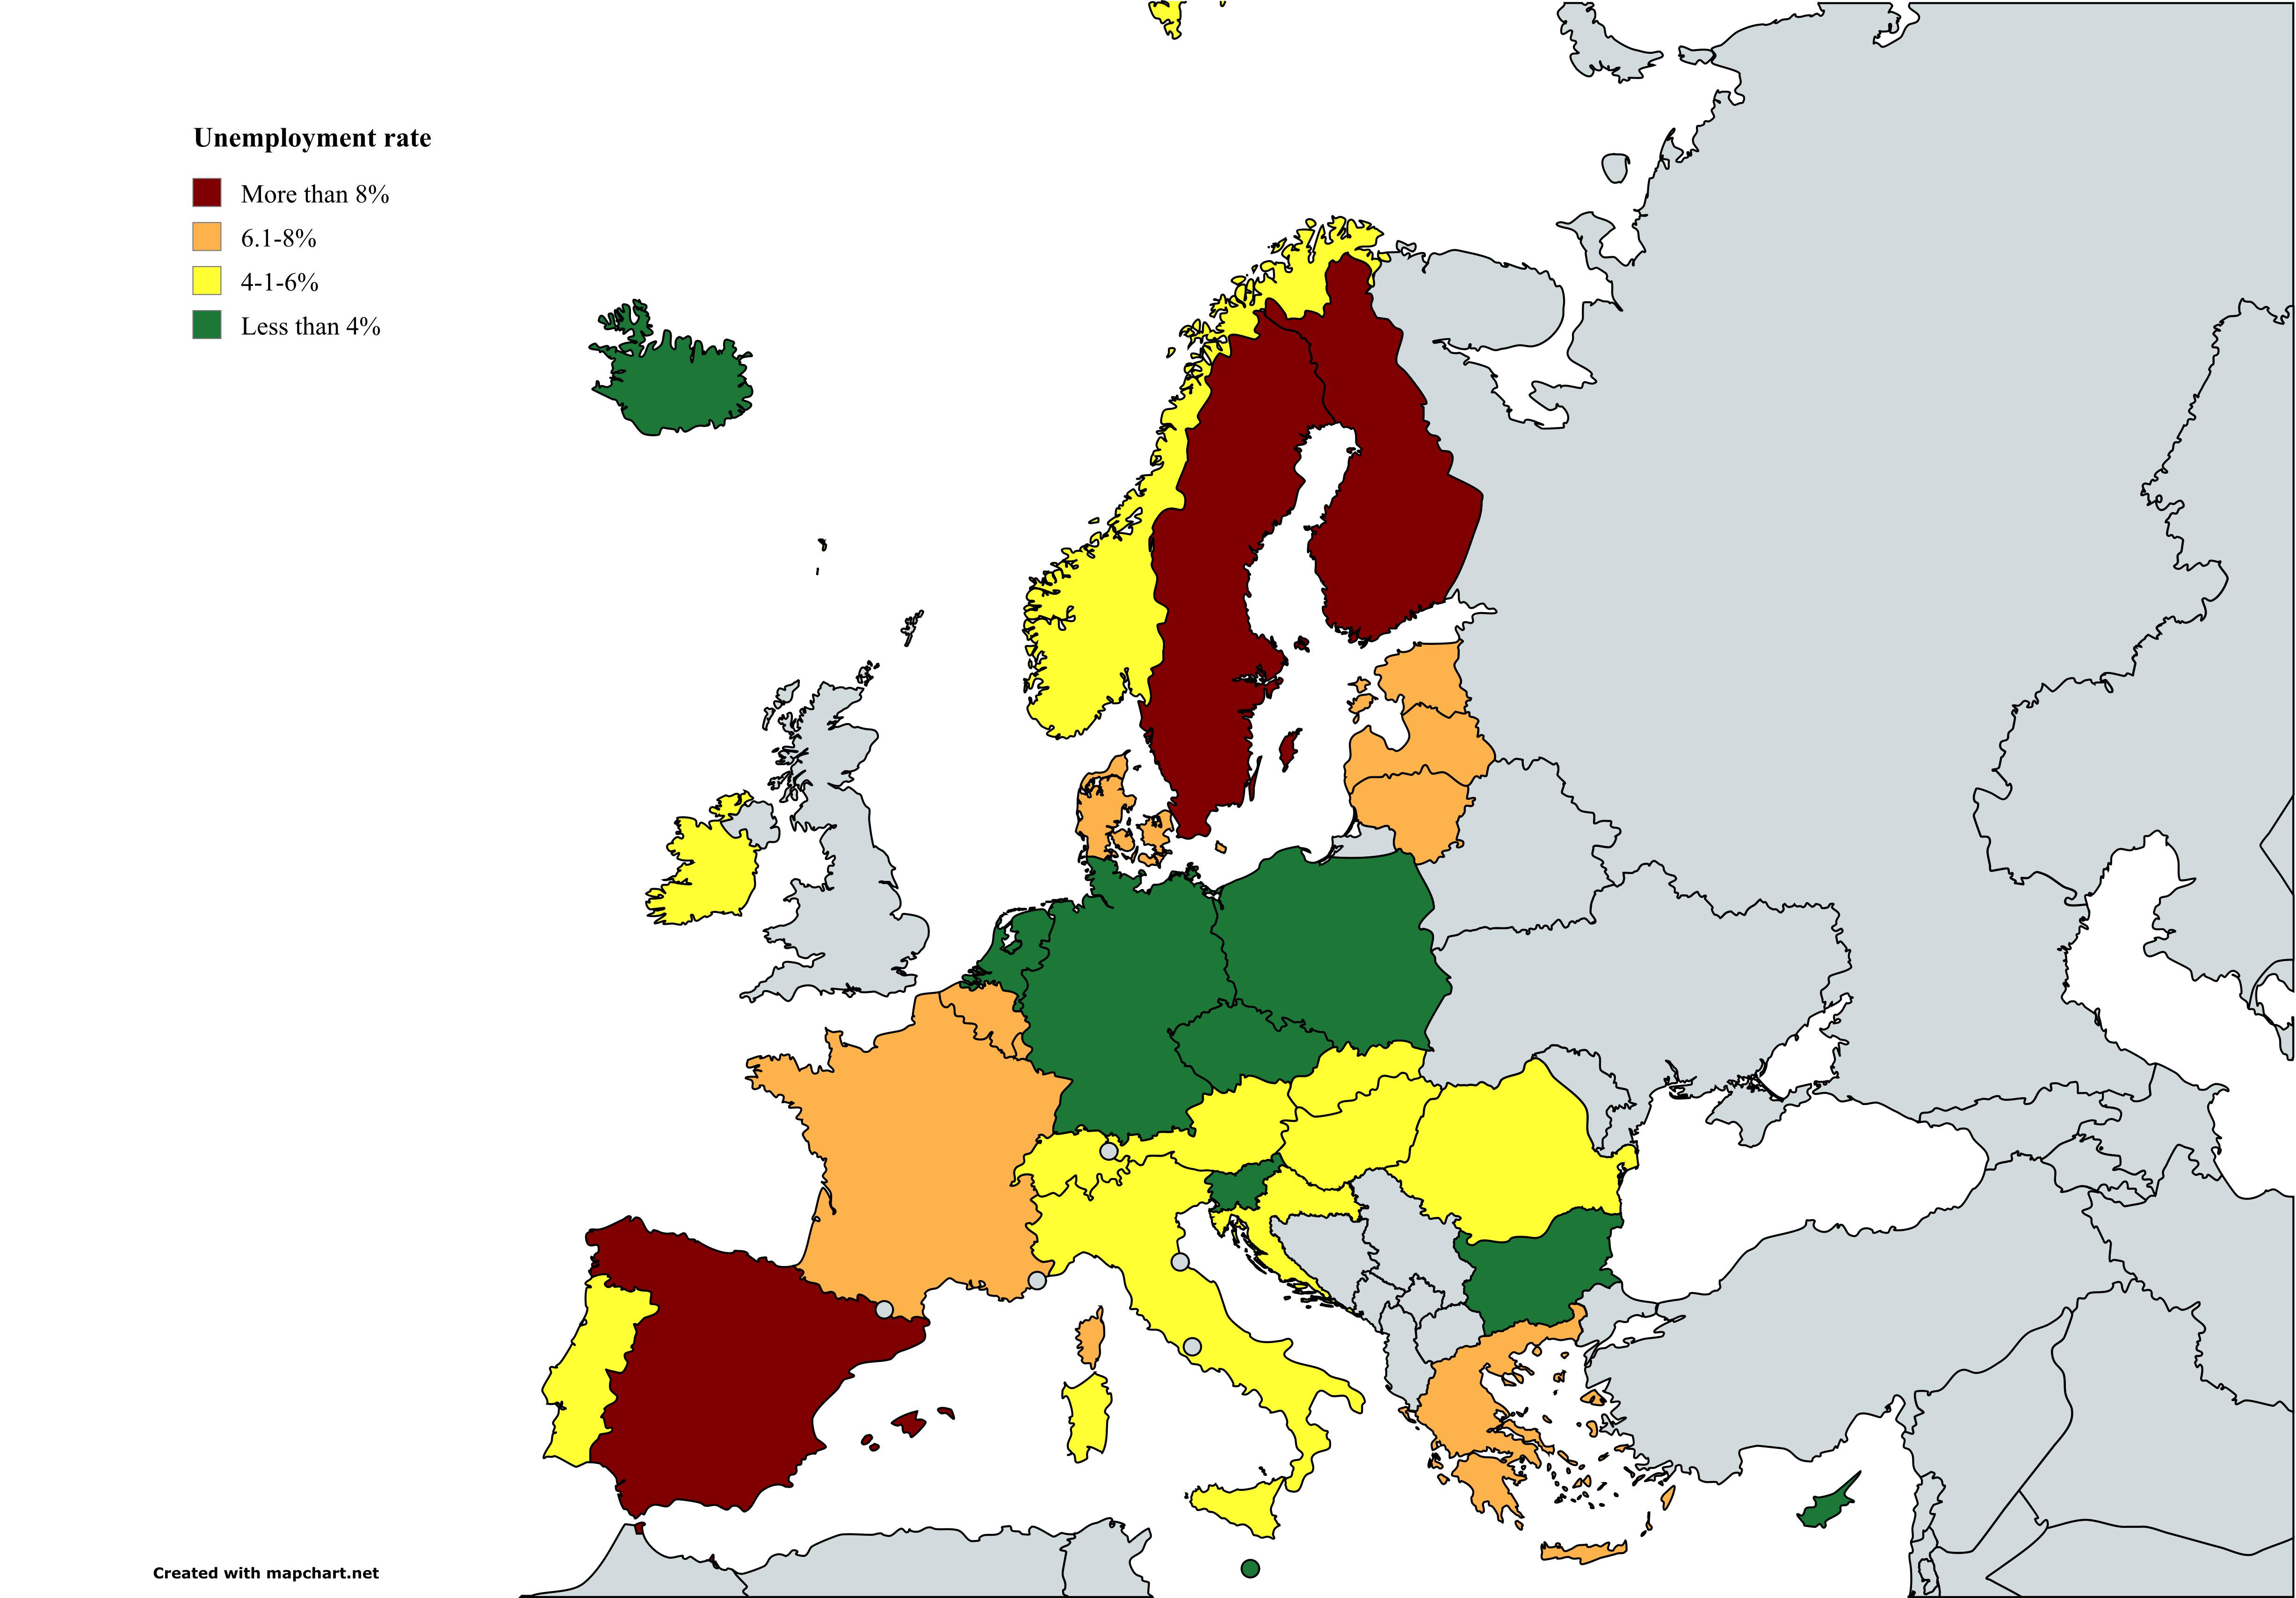
Unemployment Rate Map of Europe - June 2025
...
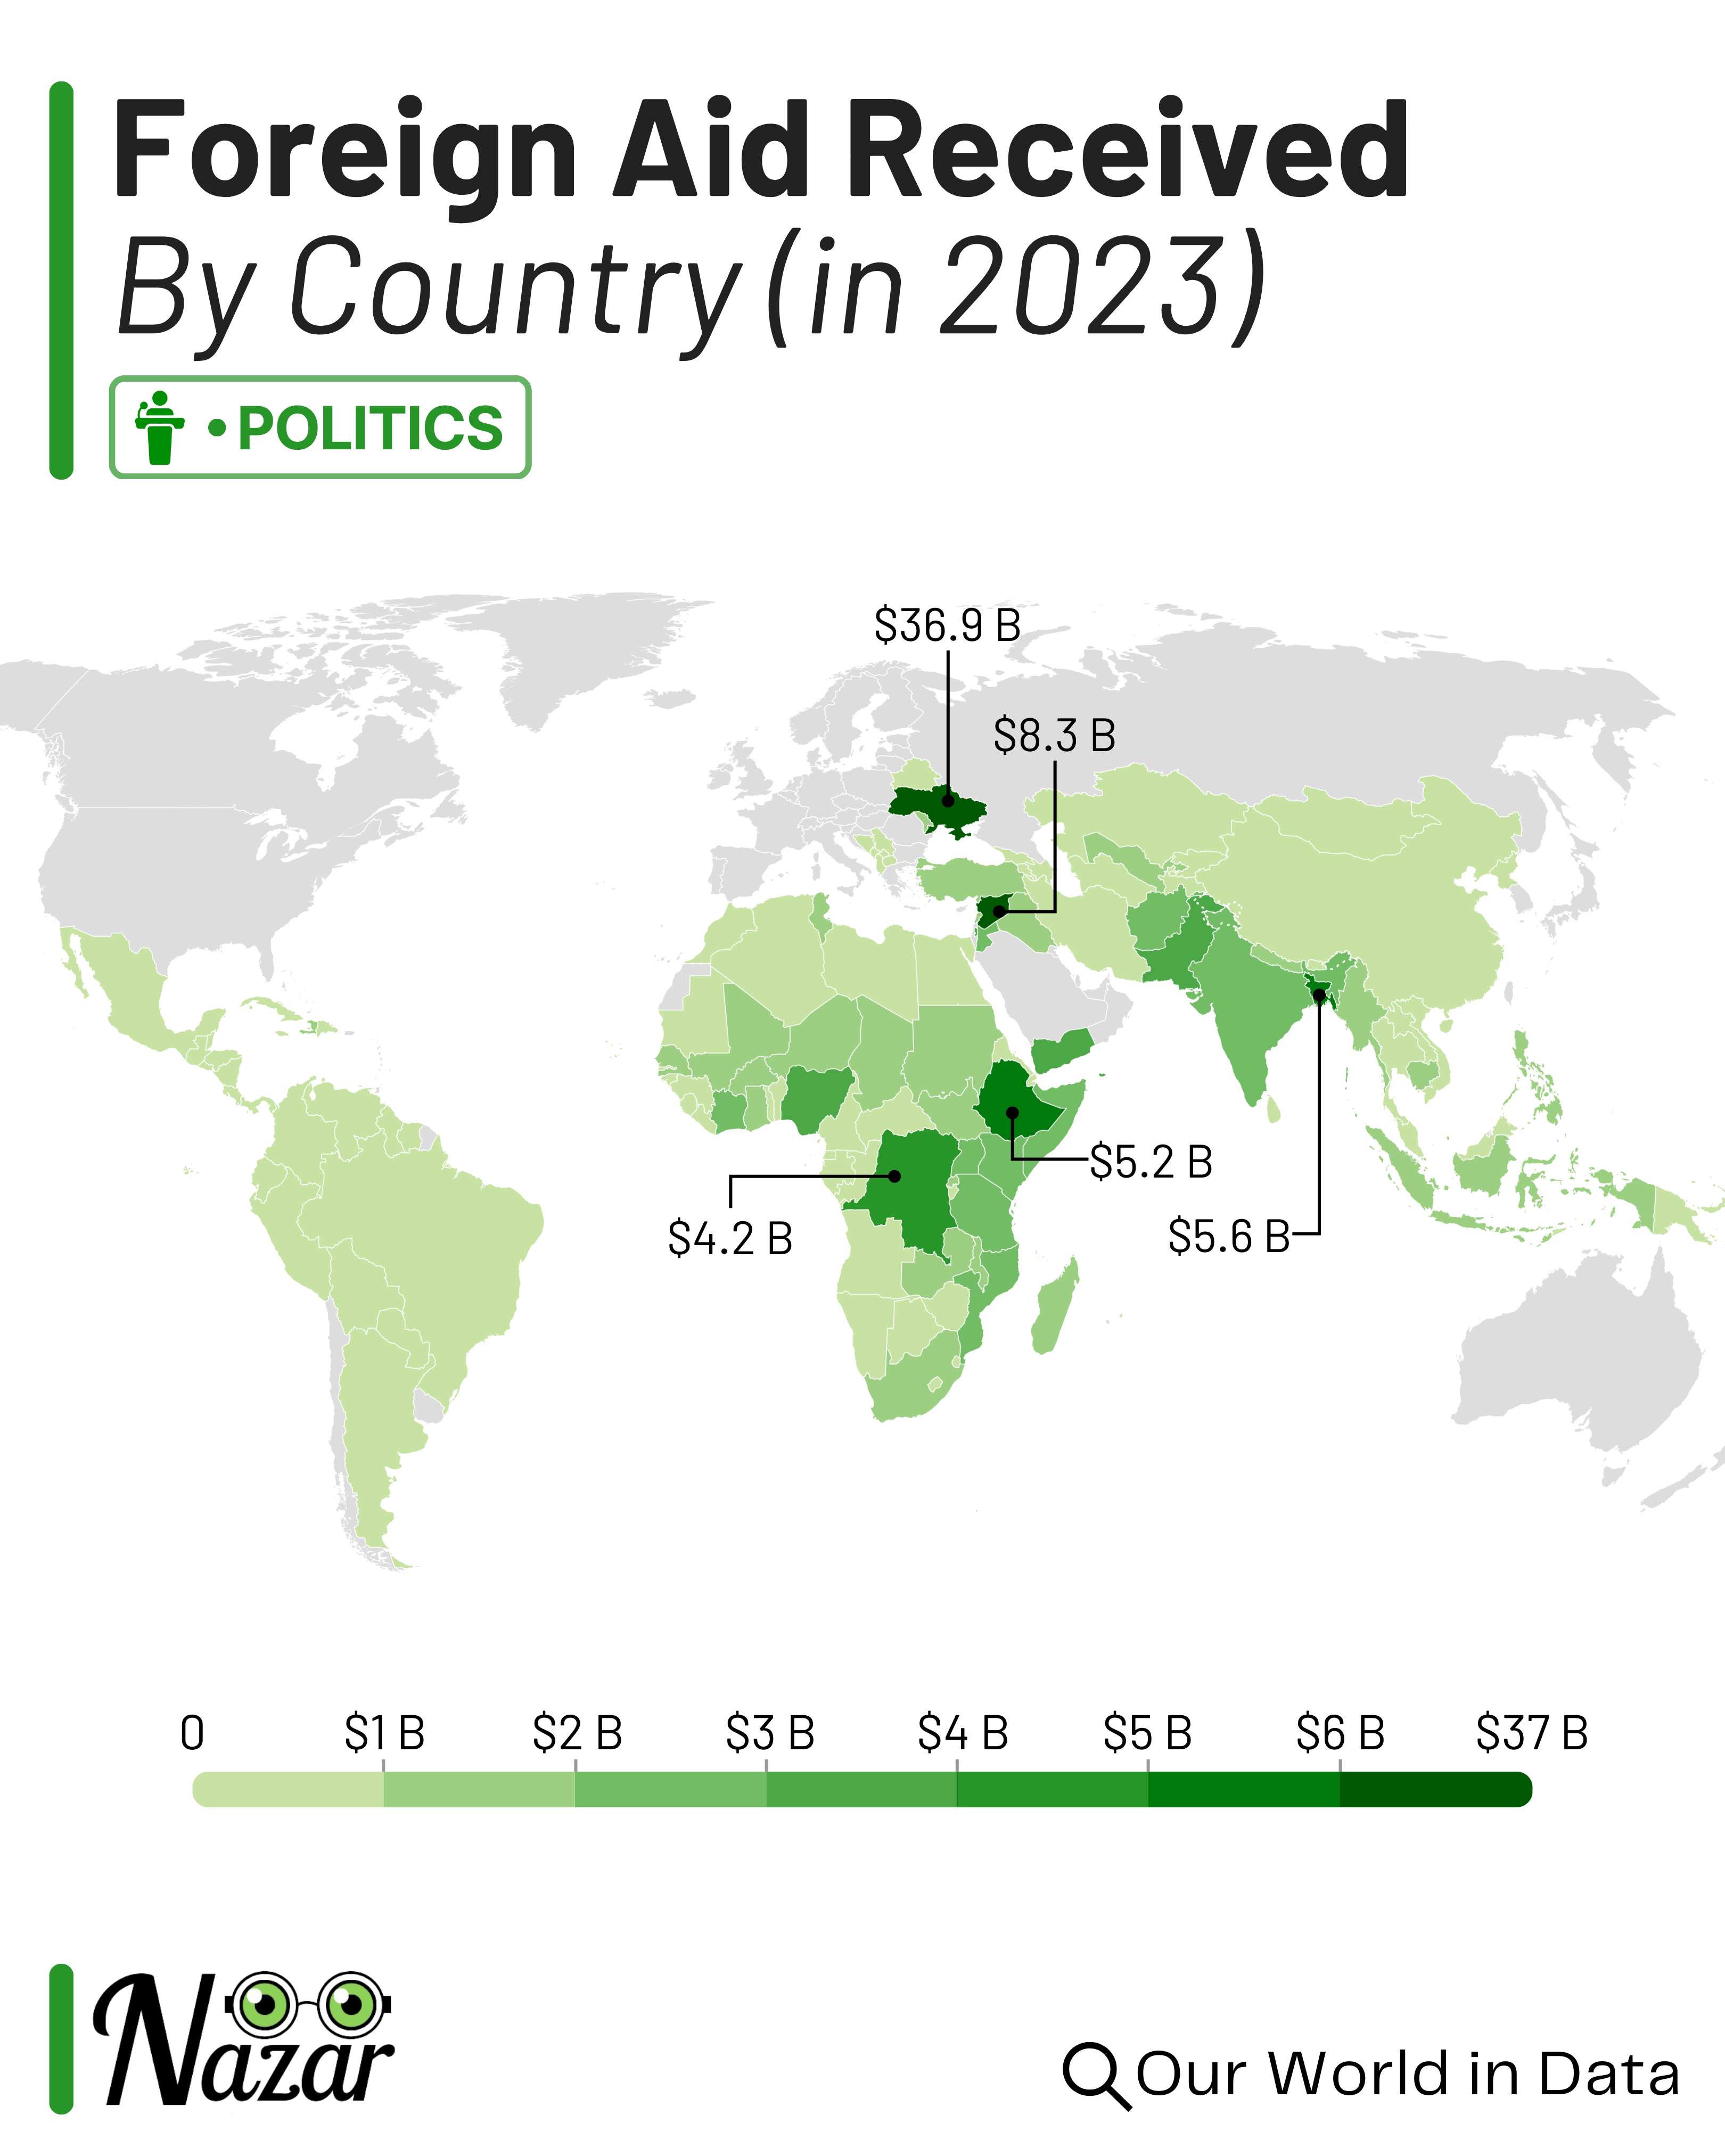
Foreign Aid Received Map
The "Foreign Aid Received Map" provides a comprehensive view of global foreign aid distribution in 2023, highlighting th...
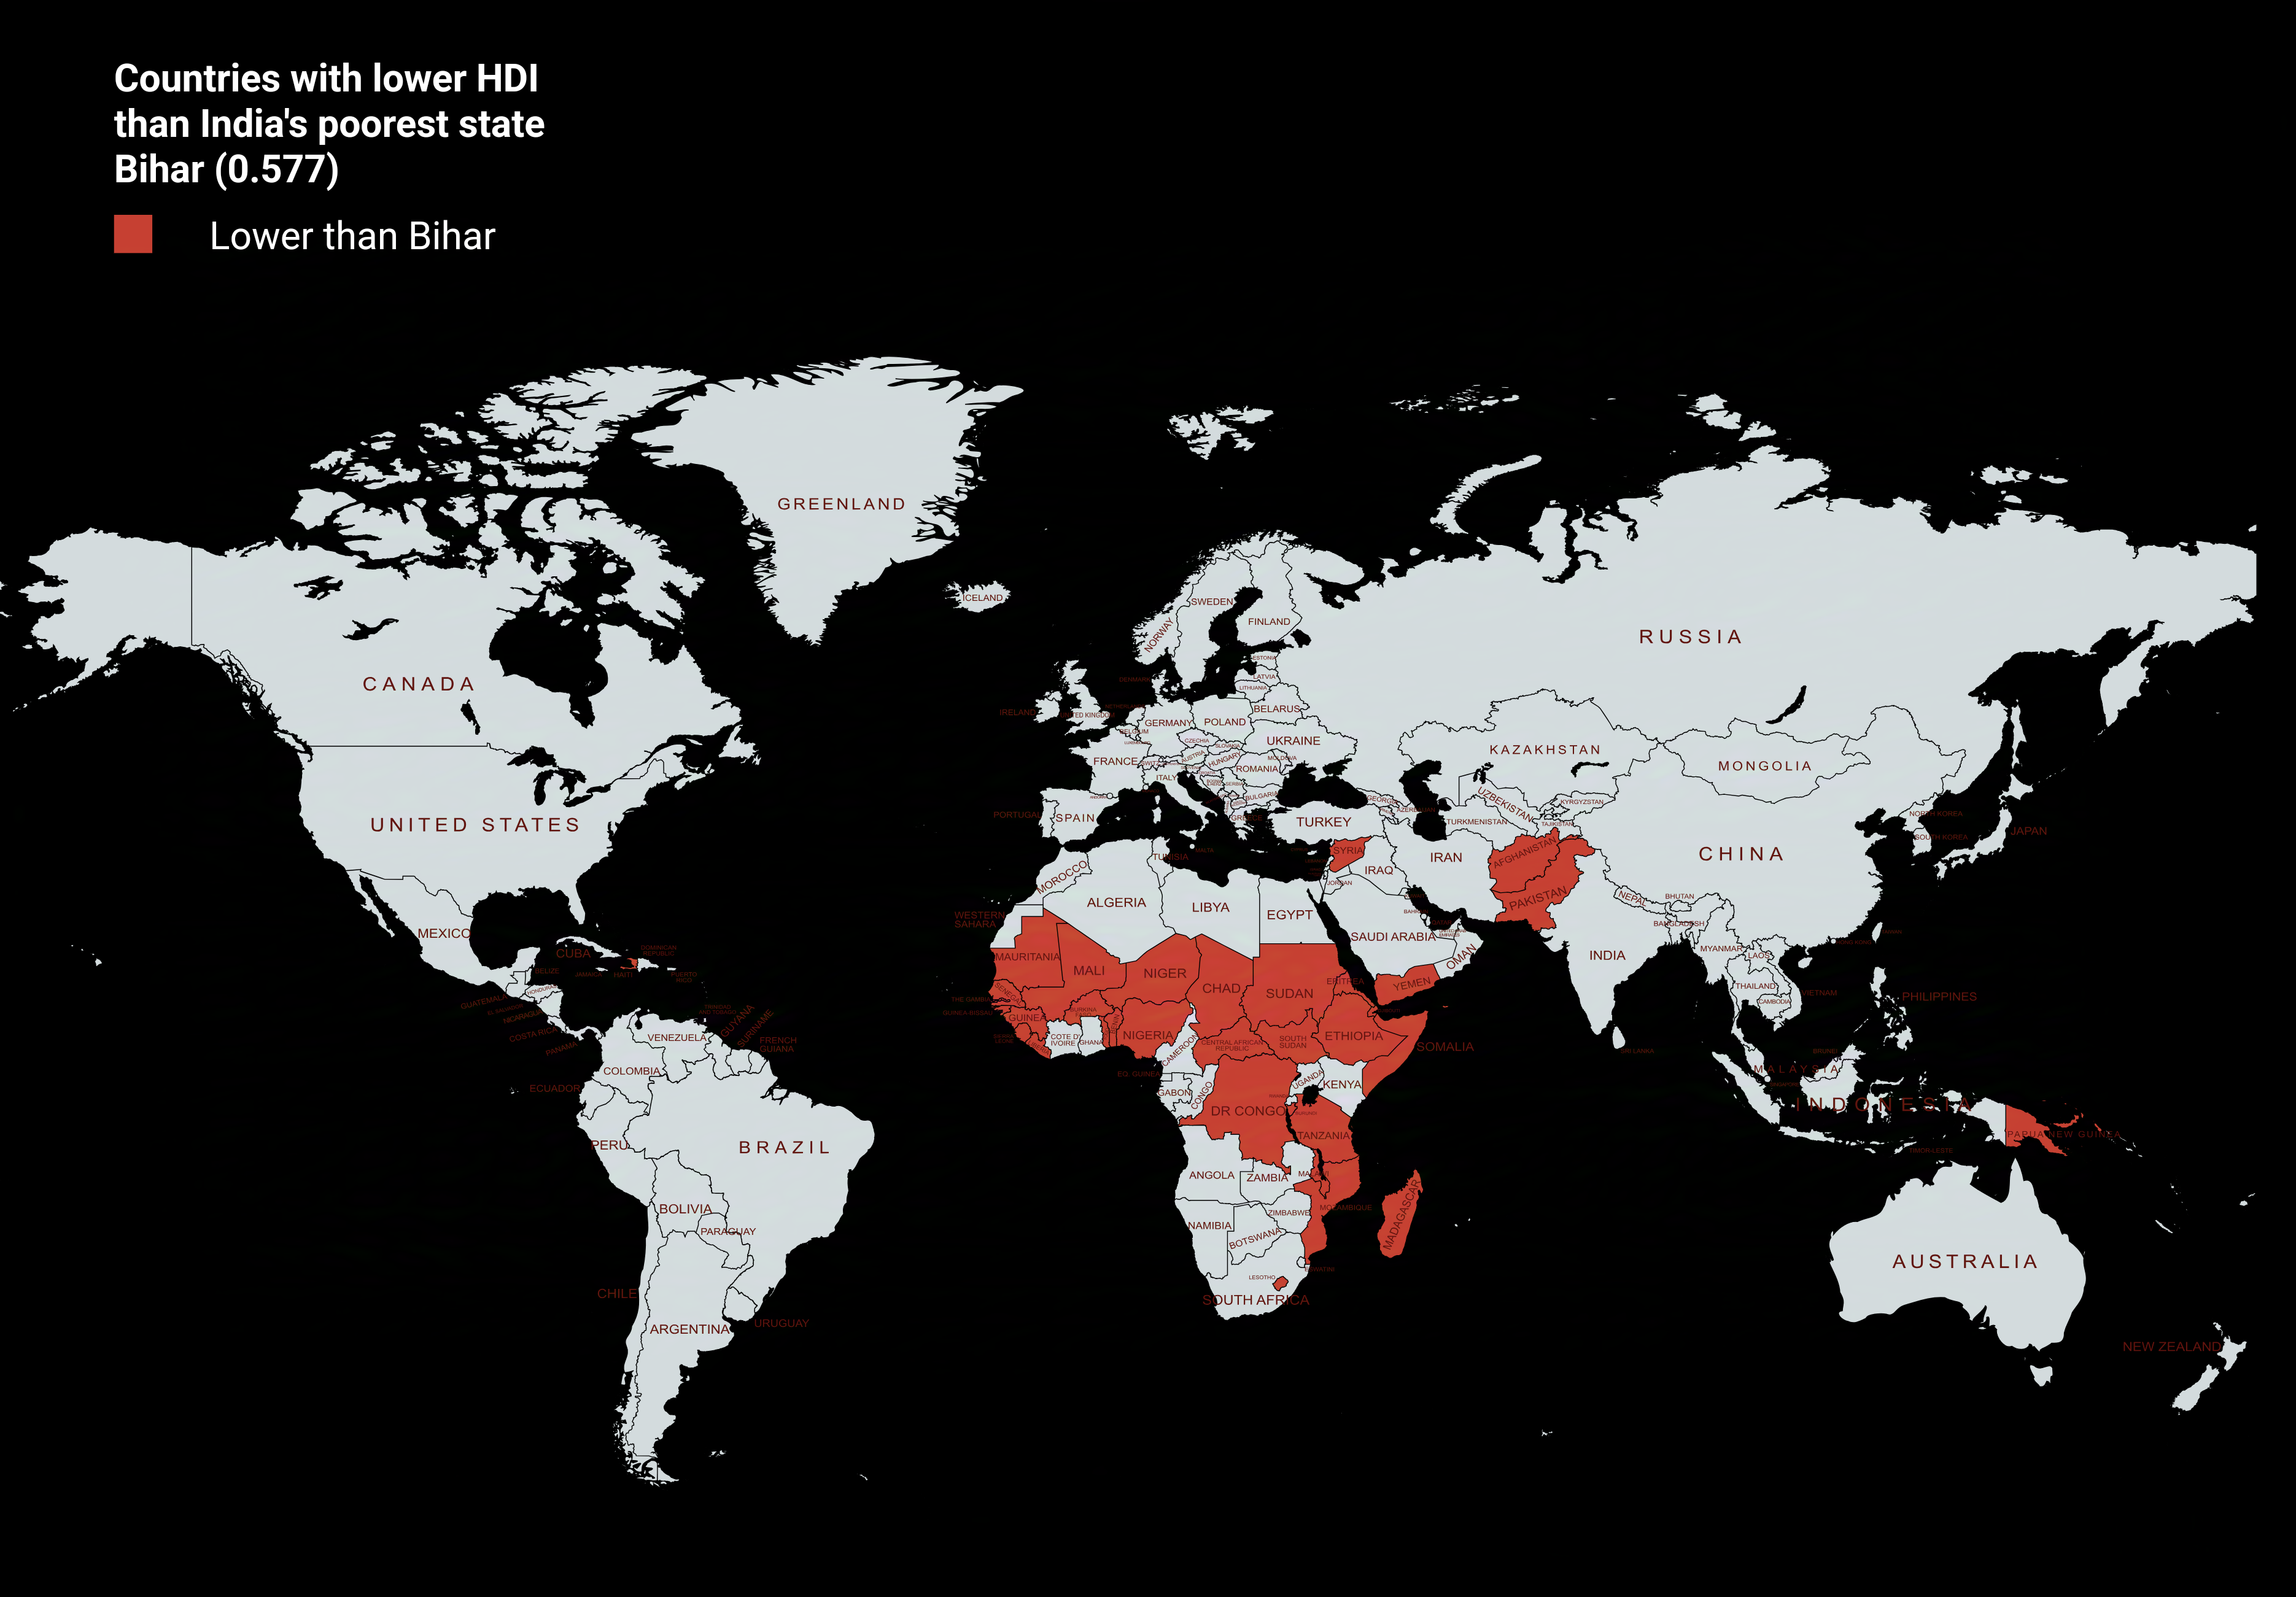
Countries with Lower HDI than Bihar Map
The visualization titled "Countries with Lower HDI than Bihar Map" provides a stark comparison of human development acro...