Government Debt to GDP in 2025 Map

David Chen
Data Visualization Specialist
David Chen is an expert in transforming complex geographic datasets into compelling visual narratives. He combines his background in computer science ...
Geographic Analysis
What This Map Shows
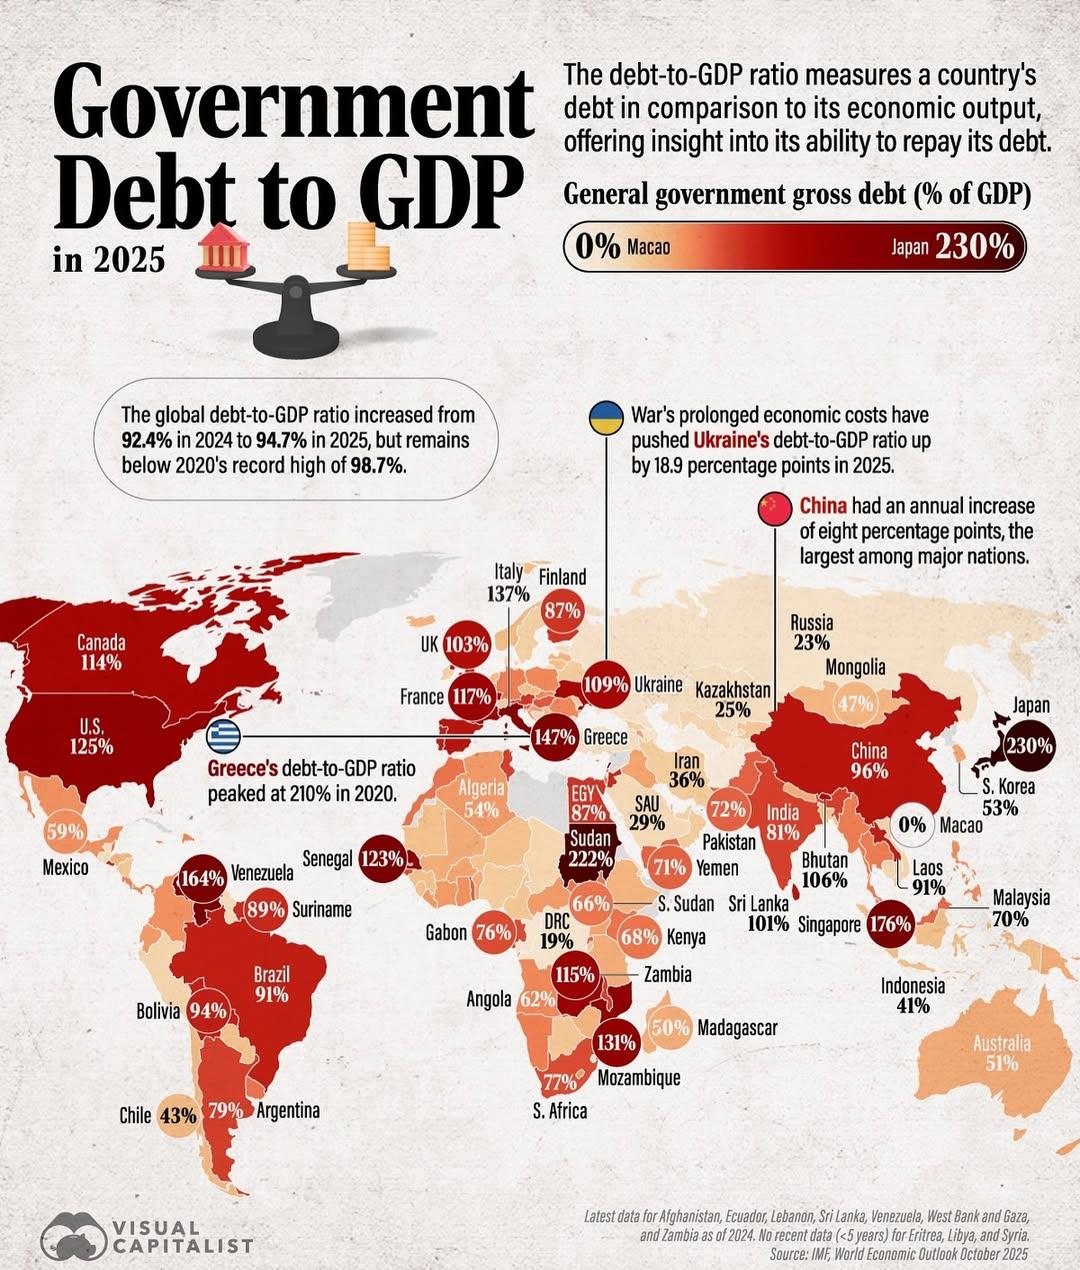
The 'Government Debt to GDP in 2025 Map' provides a visual representation of the expected ratio of government debt to Gross Domestic Product (GDP) across various countries. This ratio is a crucial indicator of a country's financial health, illustrating how much debt a government is carrying compared to the size of its economy. This map allows for easy comparison between nations, highlighting those that may be in a precarious financial position and those that are managing their debt sustainably.
Deep Dive into Government Debt to GDP
Government debt to GDP is a vital economic metric that sheds light on the financial stability of countries around the globe. Essentially, this ratio indicates how much a nation owes compared to what it produces. A lower ratio suggests a healthier economy, while a higher ratio can indicate potential financial distress. But why does this ratio matter?
Interestingly, countries with high levels of debt might face challenges such as limited fiscal space for public investment, increased borrowing costs, and potential difficulties in meeting financial obligations. For instance, Japan, with one of the highest debt-to-GDP ratios exceeding 200%, has demonstrated how a developed nation can sustain high debt levels due to its unique economic structure and domestic savings. Conversely, countries like Estonia, with a lower ratio around 10%, exhibit a robust economic environment, suggesting efficient management of finances.
What’s fascinating is the diversity in how countries accumulate debt. Some nations borrow to stimulate growth, investing in infrastructure or social programs, while others may find themselves in debt due to economic downturns, wars, or natural disasters. The COVID-19 pandemic, for example, led many countries to ramp up borrowing to support their economies, resulting in significant spikes in debt-to-GDP ratios worldwide.
In 2025, the map anticipates varying scenarios as nations recover from the pandemic and adjust their fiscal policies. It’s essential to consider that while a high debt-to-GDP ratio is often viewed negatively, the context matters significantly. Countries like the United States and the United Kingdom, which have strong currencies and robust economic systems, may handle higher debt levels more effectively than smaller or developing nations.
Regional Analysis
Examining the map reveals distinct regional trends in government debt. For example, in North America, the United States is projected to have a debt-to-GDP ratio around 125%, reflecting ongoing fiscal stimulus measures. Canada, while also experiencing increased debt, maintains a lower ratio, showcasing its more cautious fiscal approach.
Moving to Europe, countries such as Greece and Italy are expected to continue grappling with high debt levels, hovering around 180% and 150%, respectively. This situation arises from years of economic challenges, and it raises questions about their future economic viability and the sustainability of their public finances.
In contrast, Scandinavian countries like Sweden and Norway are expected to maintain healthier ratios, generally under 50%. Their proactive fiscal policies and strong economic fundamentals contribute to their stability. In Asia, China is projected to see a significant debt increase, potentially reaching 100%, as it navigates post-pandemic recovery, while India’s ratio is also expected to rise, reflecting its economic growth trajectory.
Significance and Impact
Understanding the implications of the government debt to GDP ratio is critical for analyzing a country’s economic prospects. High debt levels can lead to higher taxes, reduced public services, and constrained economic growth. For policymakers, the challenge lies in balancing economic stimulus with sustainable debt levels.
As we approach 2025, trends indicate that countries will need to adopt strategies to manage their debt effectively, especially in light of global challenges such as climate change, technological advancements, and potential geopolitical tensions. Countries that invest wisely while controlling debt could position themselves for sustainable growth, whereas those that ignore these factors may face economic repercussions.
Ultimately, the government debt to GDP ratio is not just a number; it reflects a country’s economic narrative, influencing everything from individual livelihoods to global markets. Have you noticed how nations with proactive fiscal policies often fare better in times of crisis? This map serves as a snapshot of not only where countries stand in 2025 but also hints at the economic strategies they may need to adopt moving forward.
Visualization Details
- Published
- October 30, 2025
- Views
- 4
Comments
Loading comments...