Average Weekly Earnings Map by U.S. State 2024

Alex Cartwright
Senior Cartographer & GIS Specialist
Alex Cartwright is a renowned cartographer and geographic information systems specialist with over 15 years of experience in spatial analysis and data...
Geographic Analysis
What This Map Shows
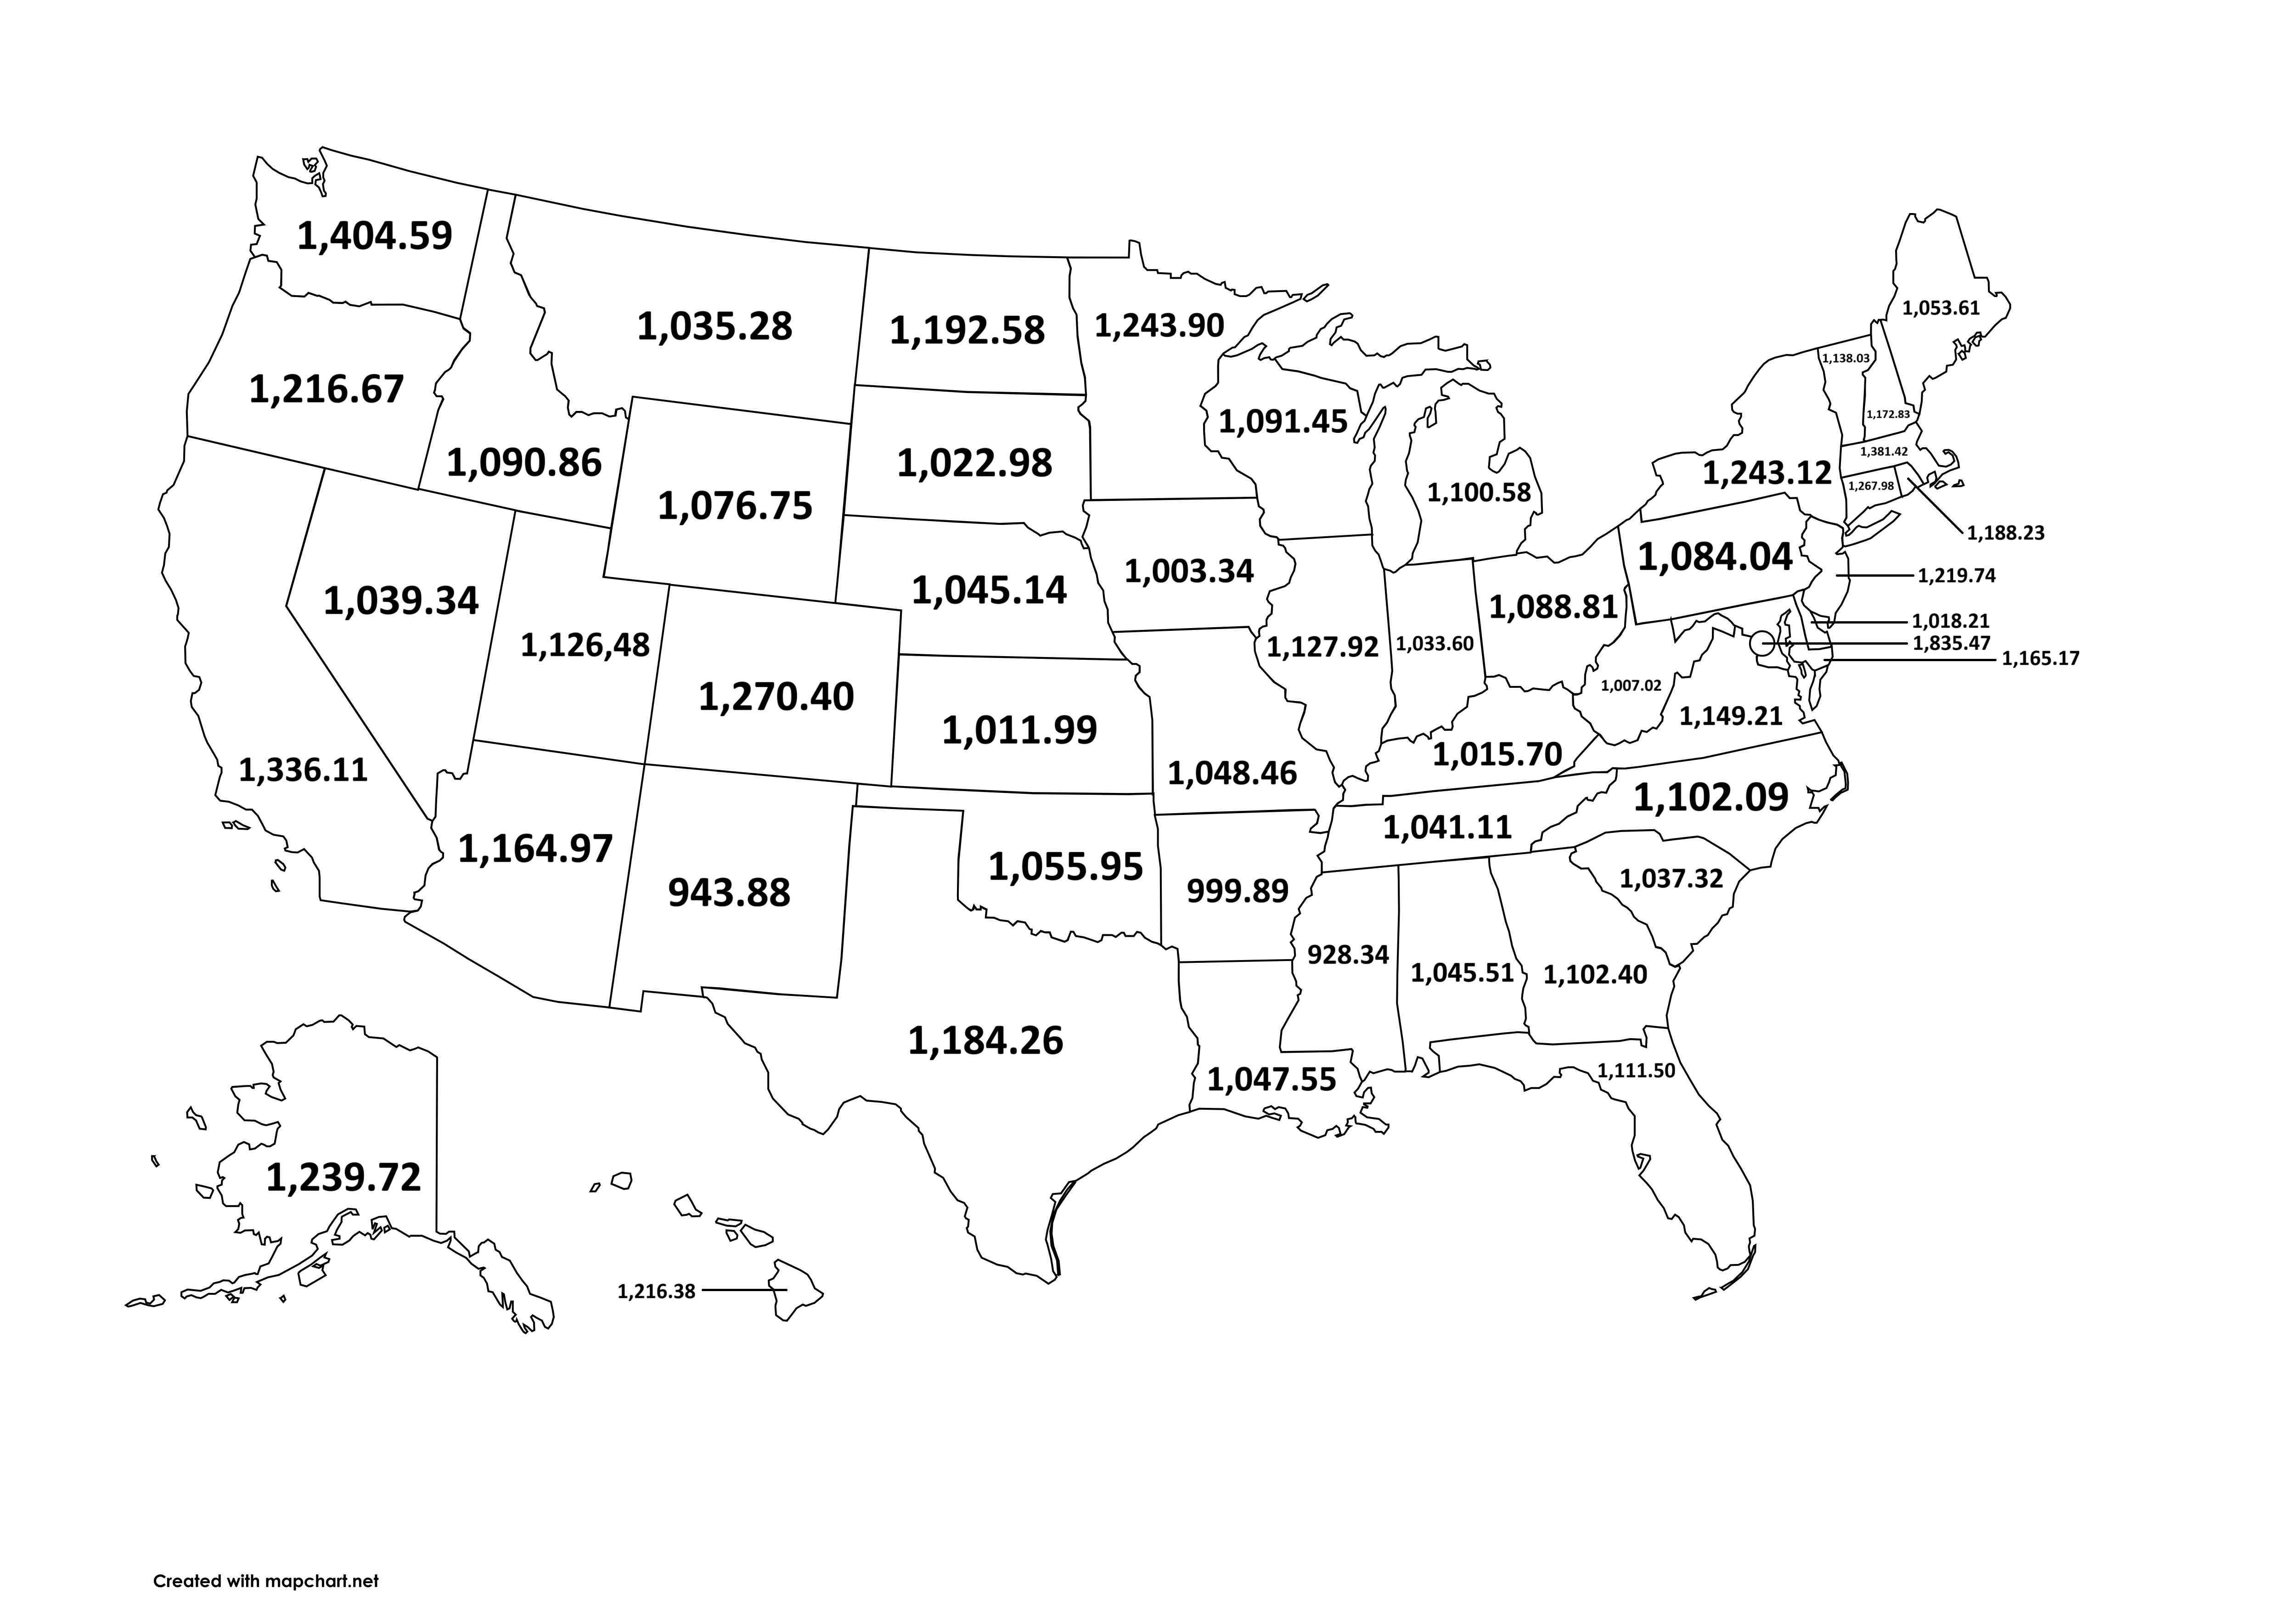
The map titled "Average Weekly Earnings of All Employees on Private Nonfarm Payrolls per U.S. State [2024]" provides a comprehensive visualization of the average income earned by employees across various states in the United States. By mapping this data, we can see not only the disparities in earnings but also how state economies vary from one another. The visualization highlights each state's average weekly earnings, allowing viewers to quickly discern which areas offer higher compensation and which might be lagging behind.
Deep Dive into Average Weekly Earnings
Average weekly earnings are a crucial indicator of economic health and labor market conditions. They reflect not just the paychecks of employees but also the overall economic activity within a state. Interestingly, these earnings can be influenced by a myriad of factors, including industry presence, cost of living, education levels, and state policies on labor and employment.
For example, states with a robust technology sector, such as California and Washington, often report higher average weekly earnings due to the high demand for skilled labor in tech-driven industries. In contrast, states that rely more heavily on agriculture or manufacturing might show lower average earnings, as these sectors typically offer lower wage rates compared to technology and finance.
As of 2024, the national average weekly earnings for all employees on private nonfarm payrolls is approximately $1,100. However, this figure varies significantly across states. For instance, in states like Massachusetts and New York, average weekly earnings exceed $1,500, reflecting the high cost of living and concentration of high-paying jobs in sectors like finance, healthcare, and education. Conversely, states such as Mississippi and Arkansas show averages closer to $900, indicating the economic challenges and lower wage structures prevalent in those regions.
Moreover, disparities in earnings can also be linked to education and skill levels. States with a higher percentage of college graduates tend to have higher average earnings, reflecting the correlation between education, job opportunities, and wage potential. For example, states like Maryland and Virginia, which boast a highly educated workforce, show significantly higher average weekly earnings compared to states with lower educational attainment.
Regional Analysis
Examining the map, we can see distinct regional trends in average weekly earnings. The Northeast and West Coast consistently report the highest earnings, with states like New York, California, and New Jersey leading the pack. These areas are often characterized by high living costs, extensive industries, and a concentration of corporate headquarters.
Interestingly, the Midwest presents a mixed picture. States like Illinois and Minnesota have higher average earnings, thanks to strong healthcare and technology sectors, while neighboring states like Indiana and Ohio lag behind, reflecting a reliance on manufacturing jobs.
In the South, average earnings are noticeably lower on average. States like Georgia and Texas show promising growth in sectors like tech and energy, respectively, but many Southern states still face challenges in raising average incomes. Meanwhile, states like Florida and North Carolina are emerging as new economic hubs, attracting workers and businesses alike, which could positively impact future earnings.
Significance and Impact
Understanding average weekly earnings is not just about numbers; it has far-reaching implications for economic policy, social equity, and workforce development. Higher earnings often correlate with greater consumer spending, which fuels local economies. On the flip side, low average earnings can exacerbate poverty levels and limit access to quality healthcare and education.
Current trends indicate a growing emphasis on remote work, which can shift income distributions as companies tap into talent across the nation, potentially leveling the playing field. As states compete to attract businesses and skilled workers, the dynamics of earnings may continue to evolve. Have you noticed how states are starting to implement incentives for companies to establish operations in regions with lower average earnings? This could lead to significant changes in the economic landscape across the country.
In conclusion, as we move through 2024 and beyond, the insights garnered from this map can inform both individuals seeking employment and policymakers looking to boost economic performance. Knowing where average weekly earnings stand can help us understand not just where the money flows but also where opportunities lie for growth and investment. What will be the impact of these trends on our economy in the coming years? Only time will tell.
Visualization Details
- Published
- September 19, 2025
- Views
- 72
Comments
Loading comments...