u.s. states Maps
24 geographic visualizations tagged with "u.s. states"
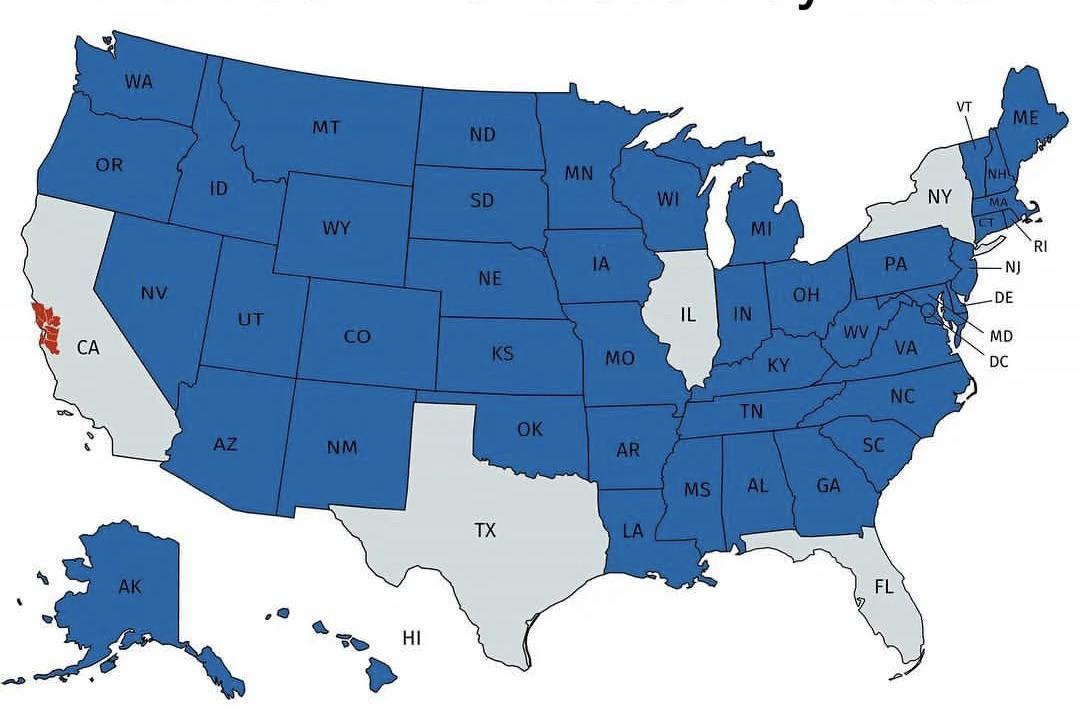
U.S. States with Smaller Economies than San Francisco Bay Area Map
This map provides a striking visualization of U.S. states whose economies are smaller than that of the San Francisco Bay...
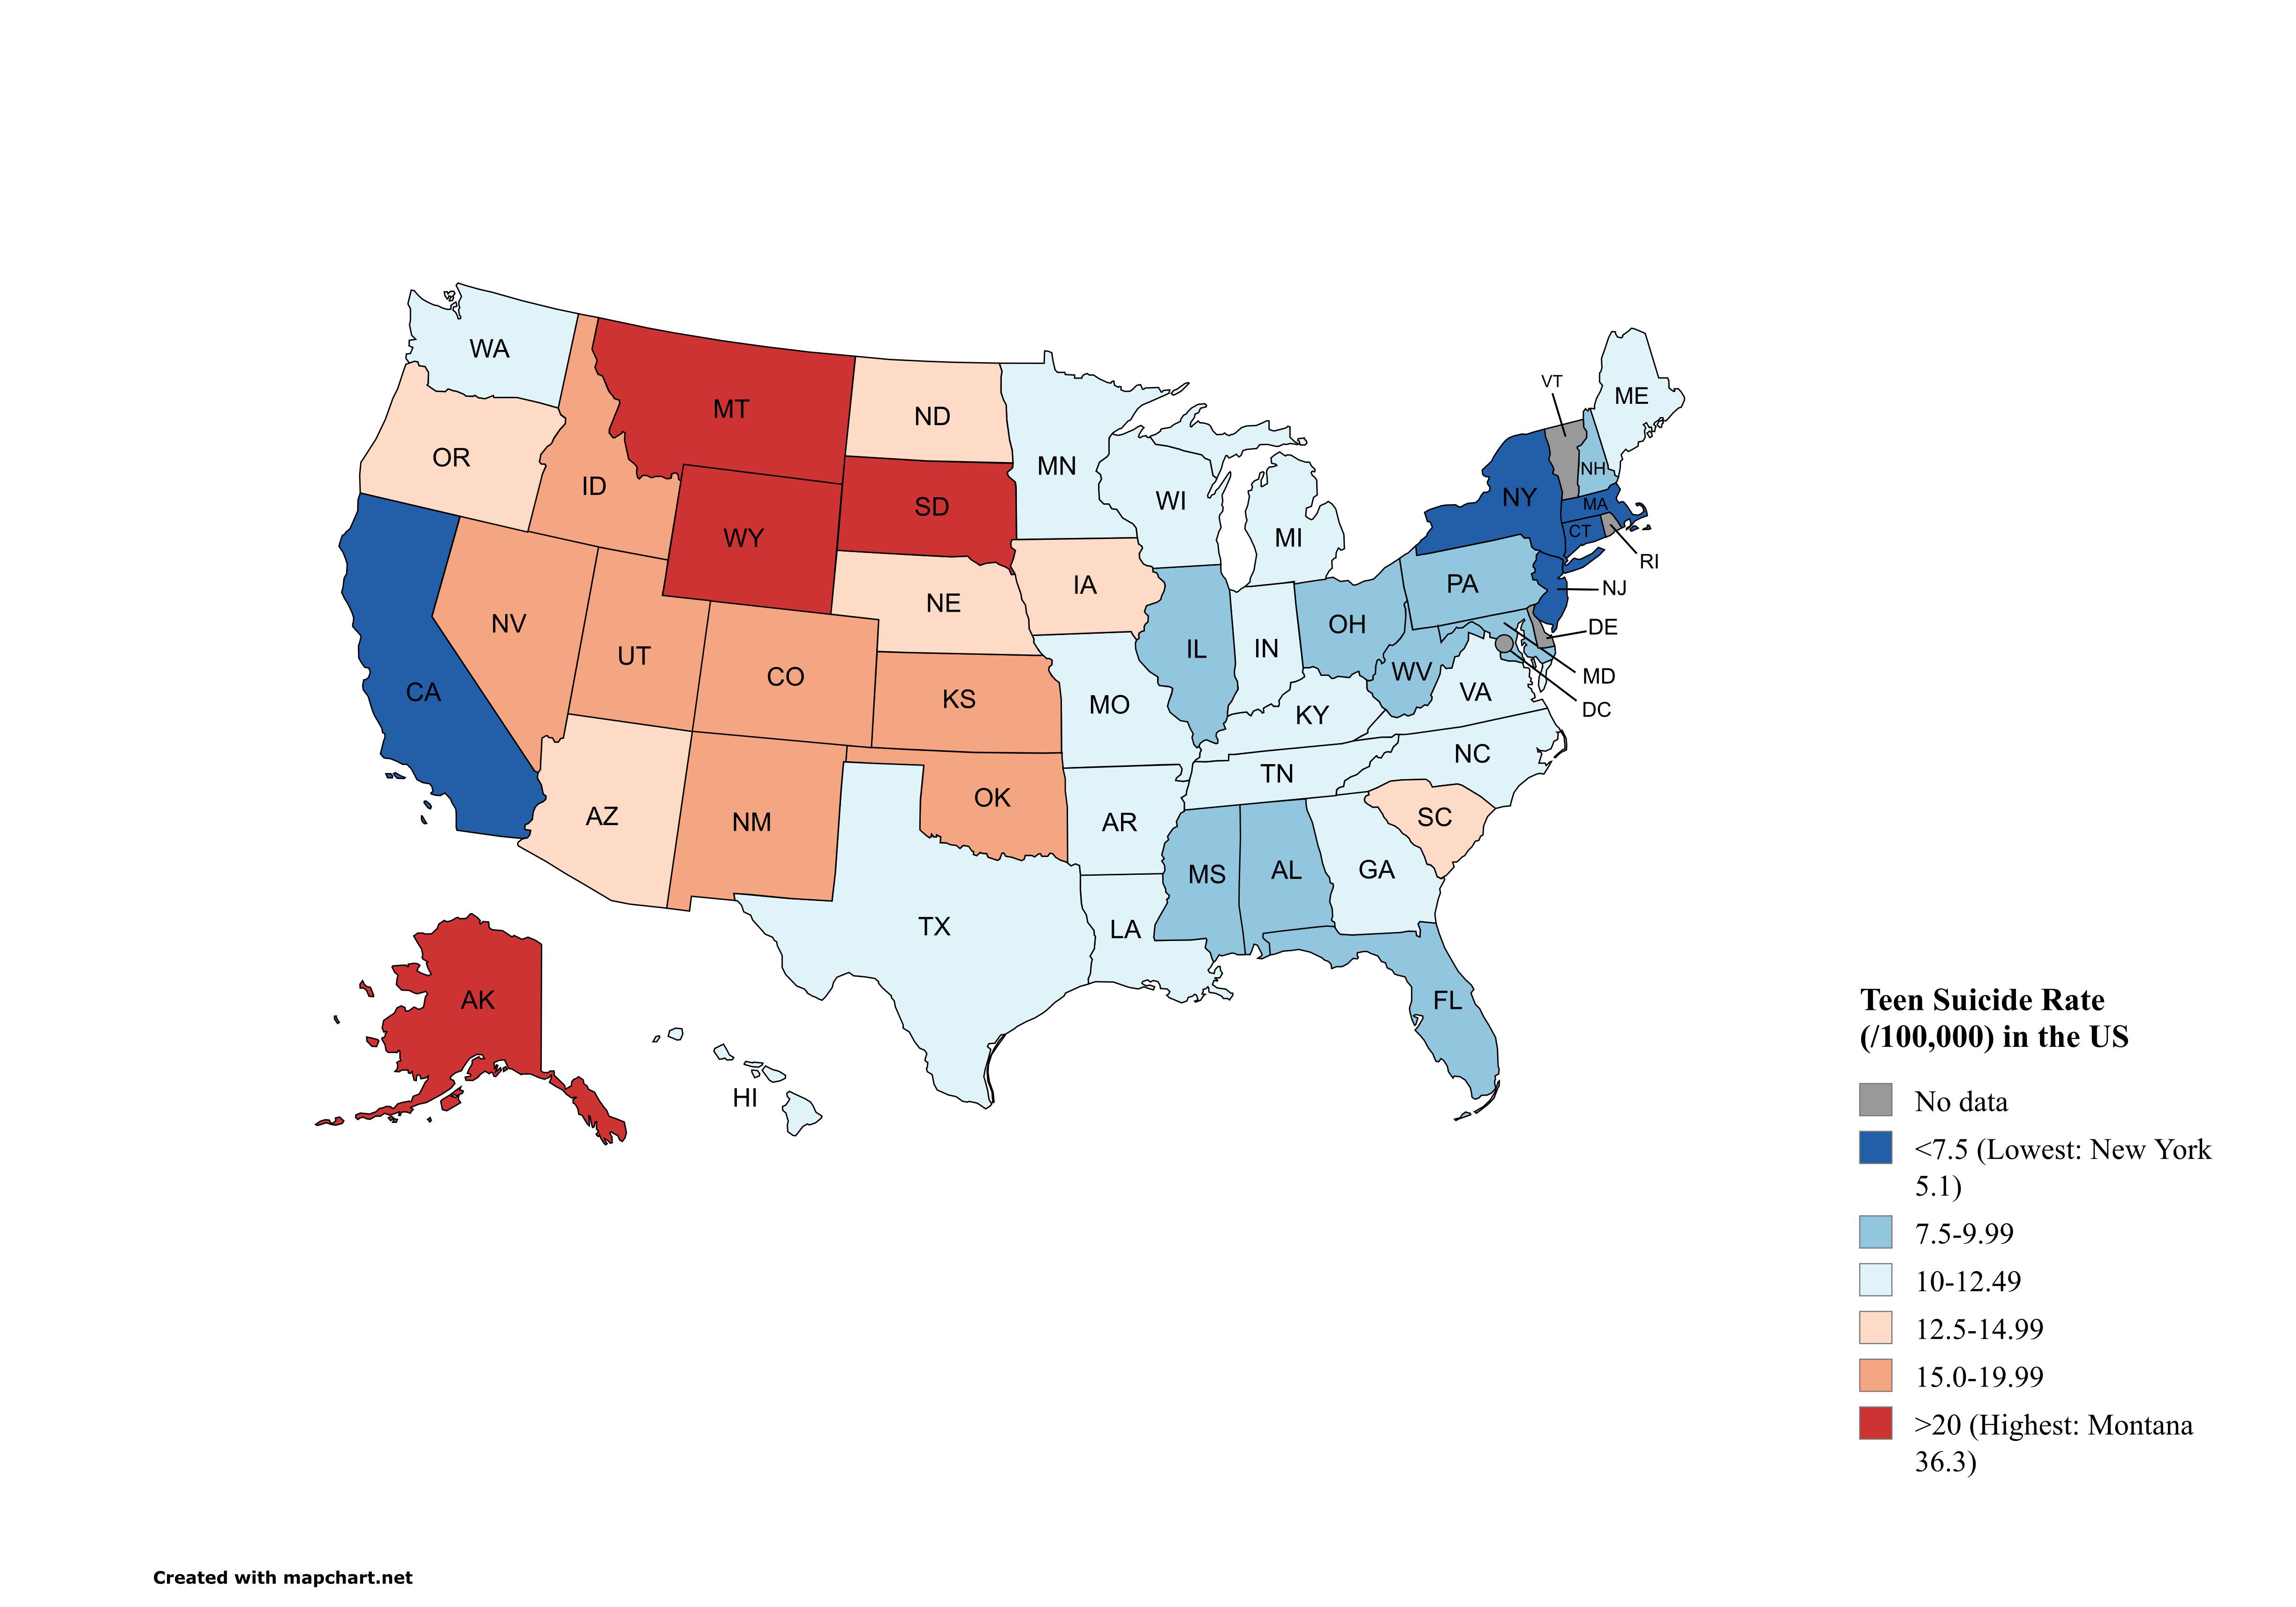
Teen Suicide Rates by State Map (2020-2022)
The map titled "U.S. States by Teen Suicide Rates (aged 15-19) from 2020-2022" presents a stark visualization of the ado...
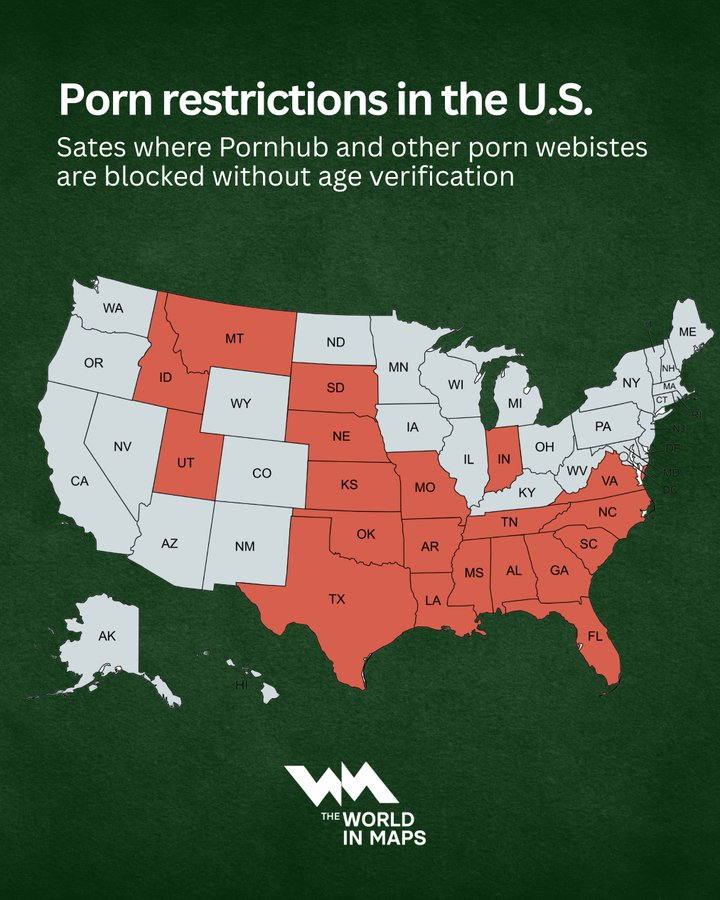
Pornhub Age-Verification Laws Map in US States
This map illustrates a significant shift in digital access, highlighting the 21 U.S. states that have enacted age-verifi...
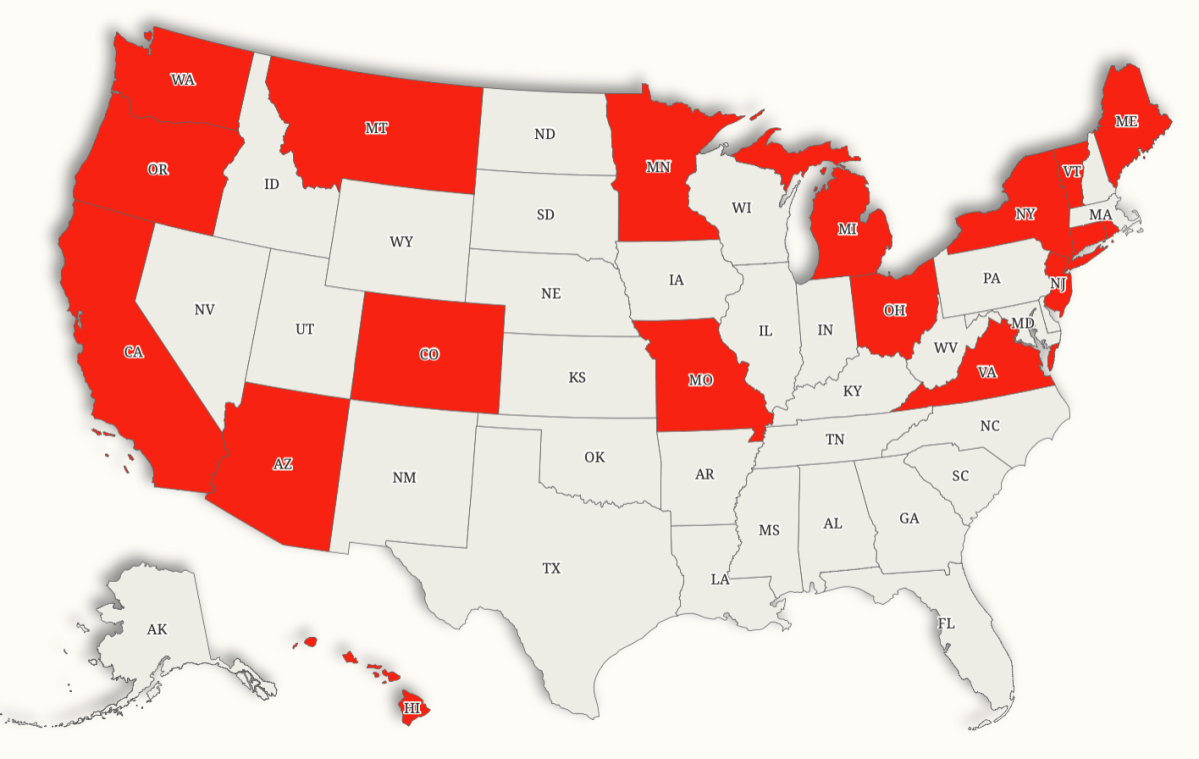
Minimum Wage Increases by State Map
This map illustrates the states in the U.S. that are scheduled to raise their minimum wage in 2026. It provides a clear ...
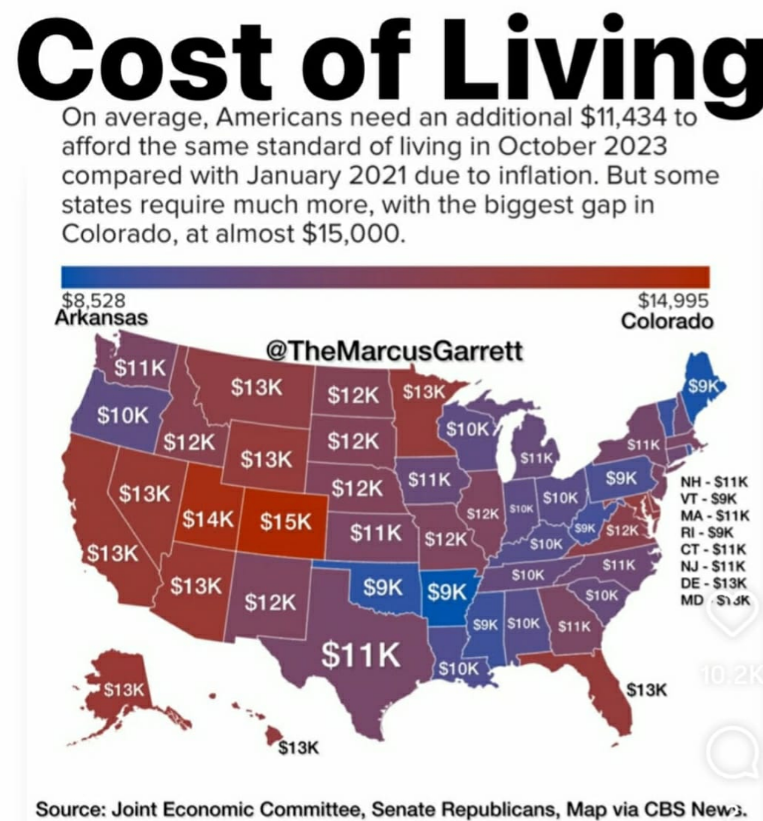
Cost of Living Increase by State Map
The visualization titled "The Shocking Difference in Cost of Living Increase Across U.S. States" effectively highlights ...
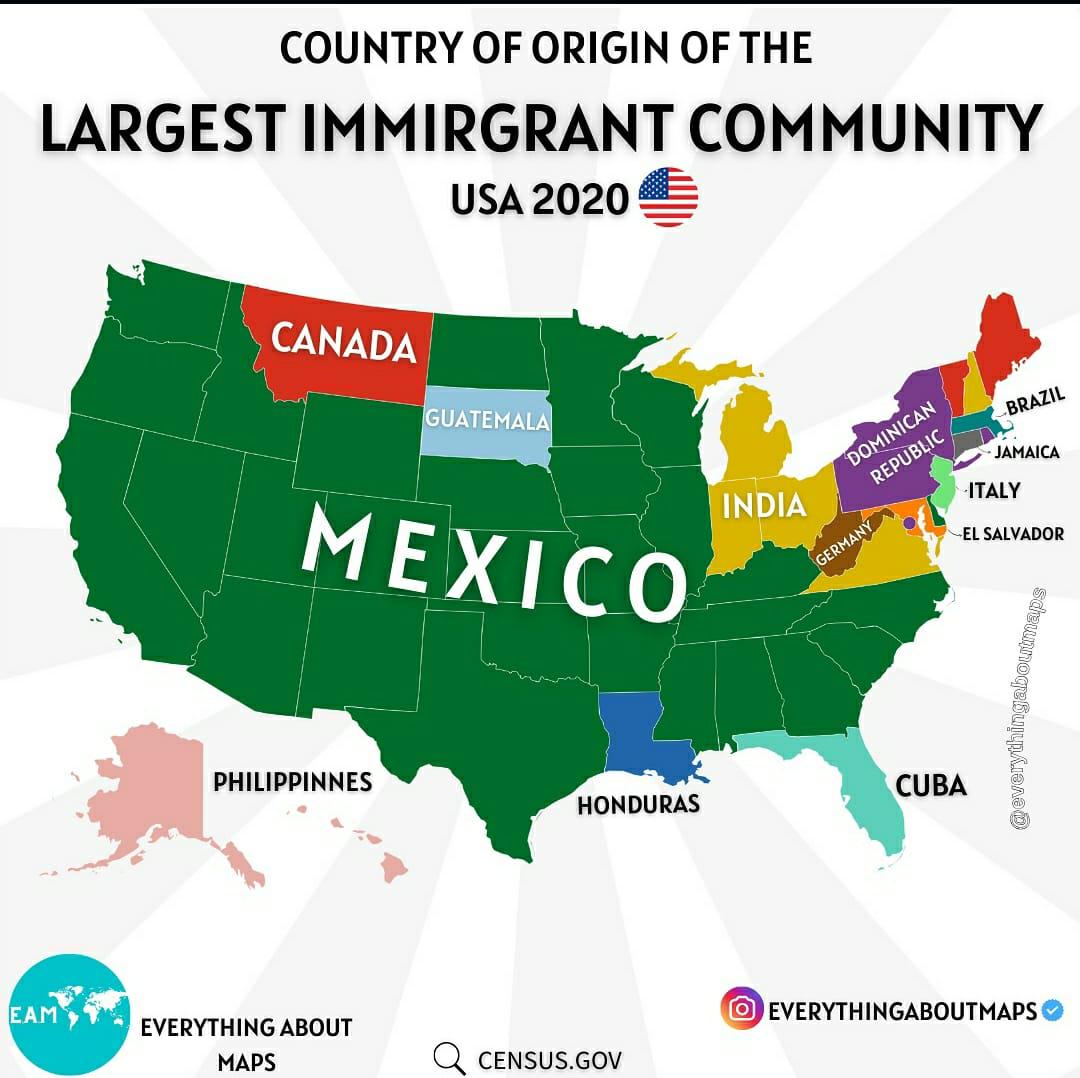
Largest Immigrant Group by US State Map
This map reveals the largest immigrant group in each U.S. state, showcasing a diverse tapestry of cultures and nationali...
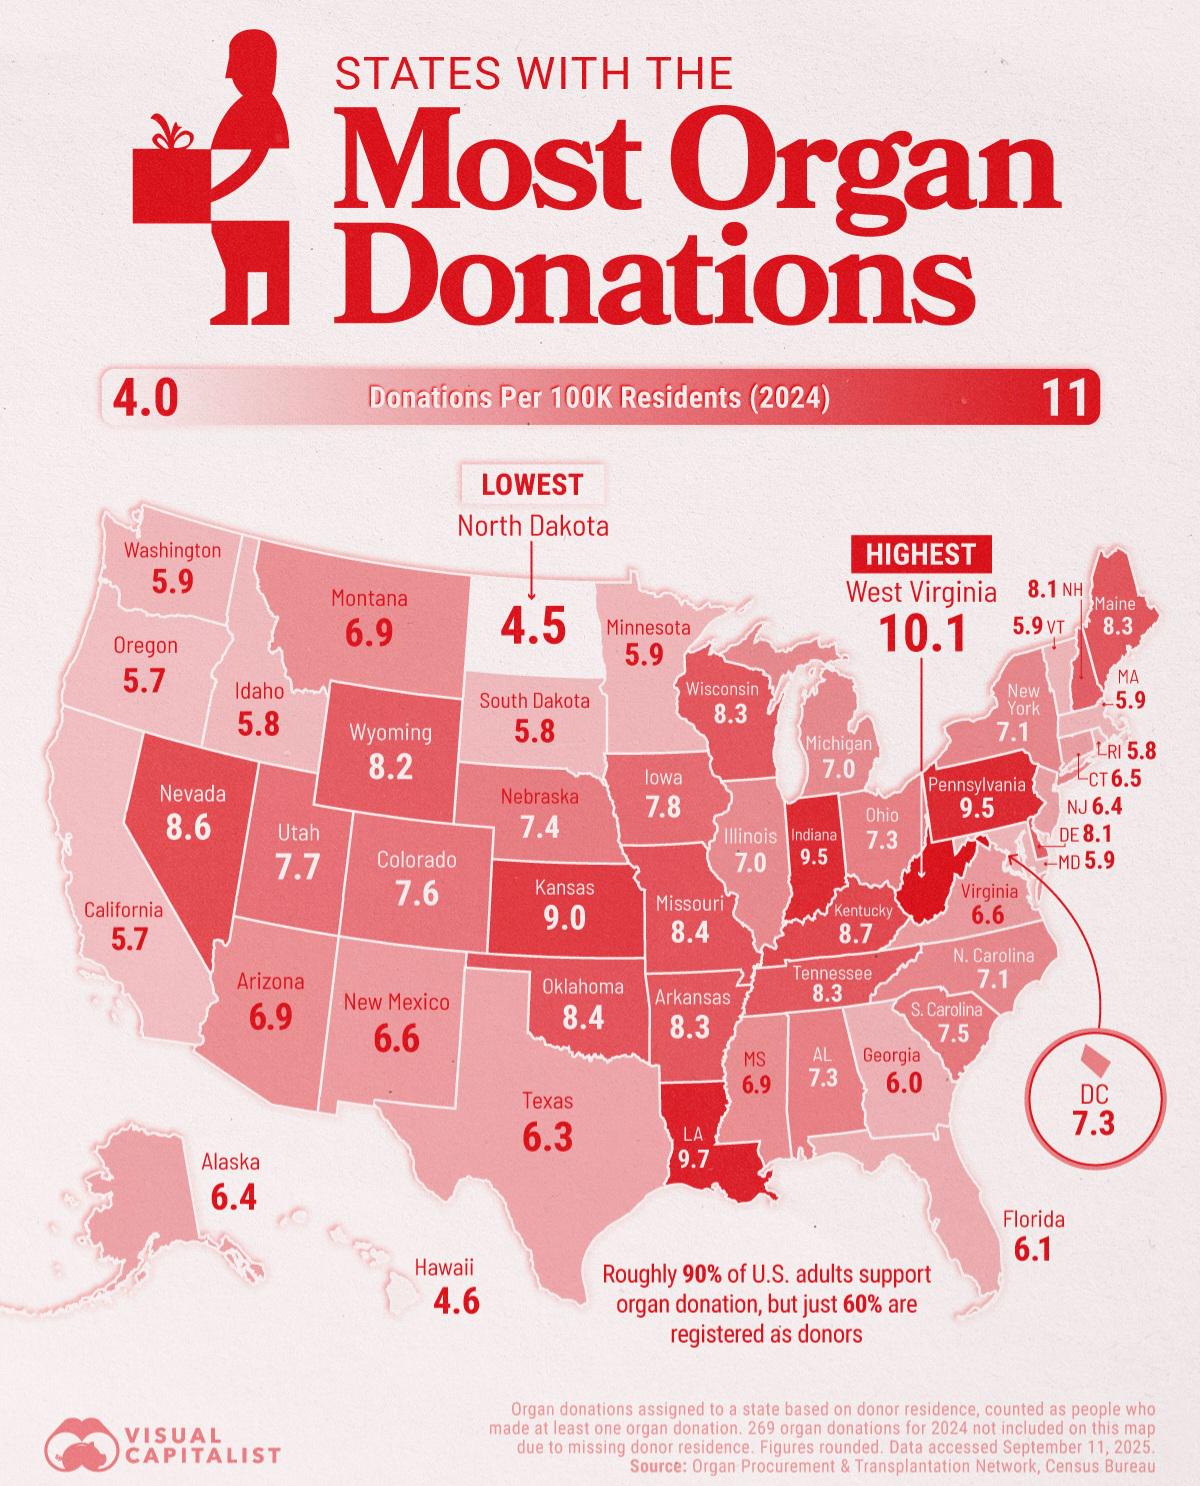
Map of U.S. States Leading in Organ Donations
This map provides a comprehensive overview of organ donation rates across various U.S. states, highlighting which states...
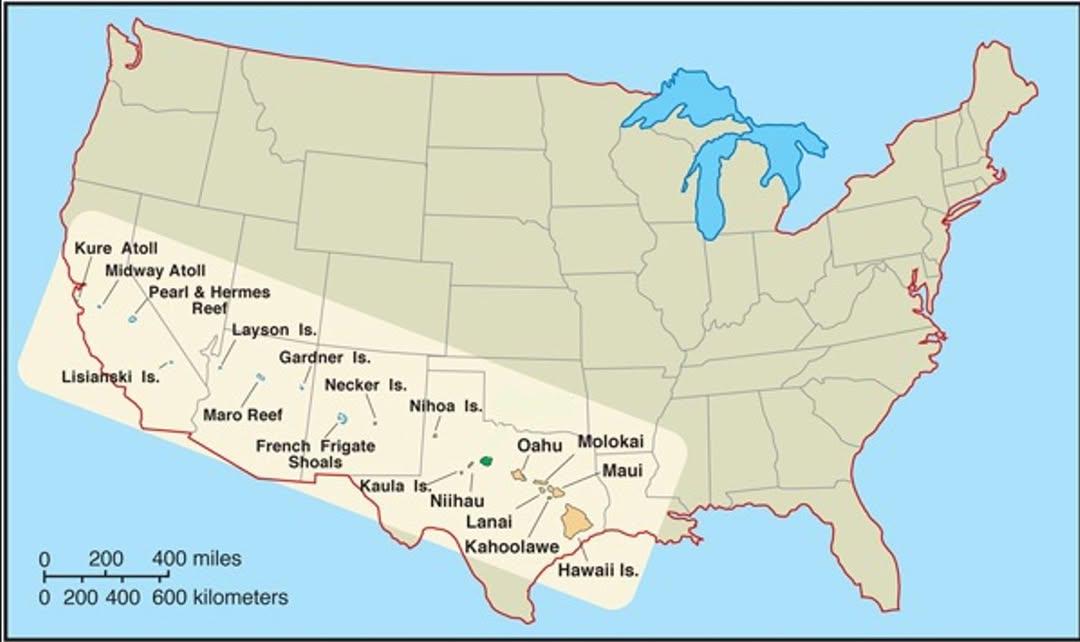
Hawaii Size Comparison Map with the United States
This map provides a visual representation of the size of Hawaii in relation to the rest of the United States. By compari...
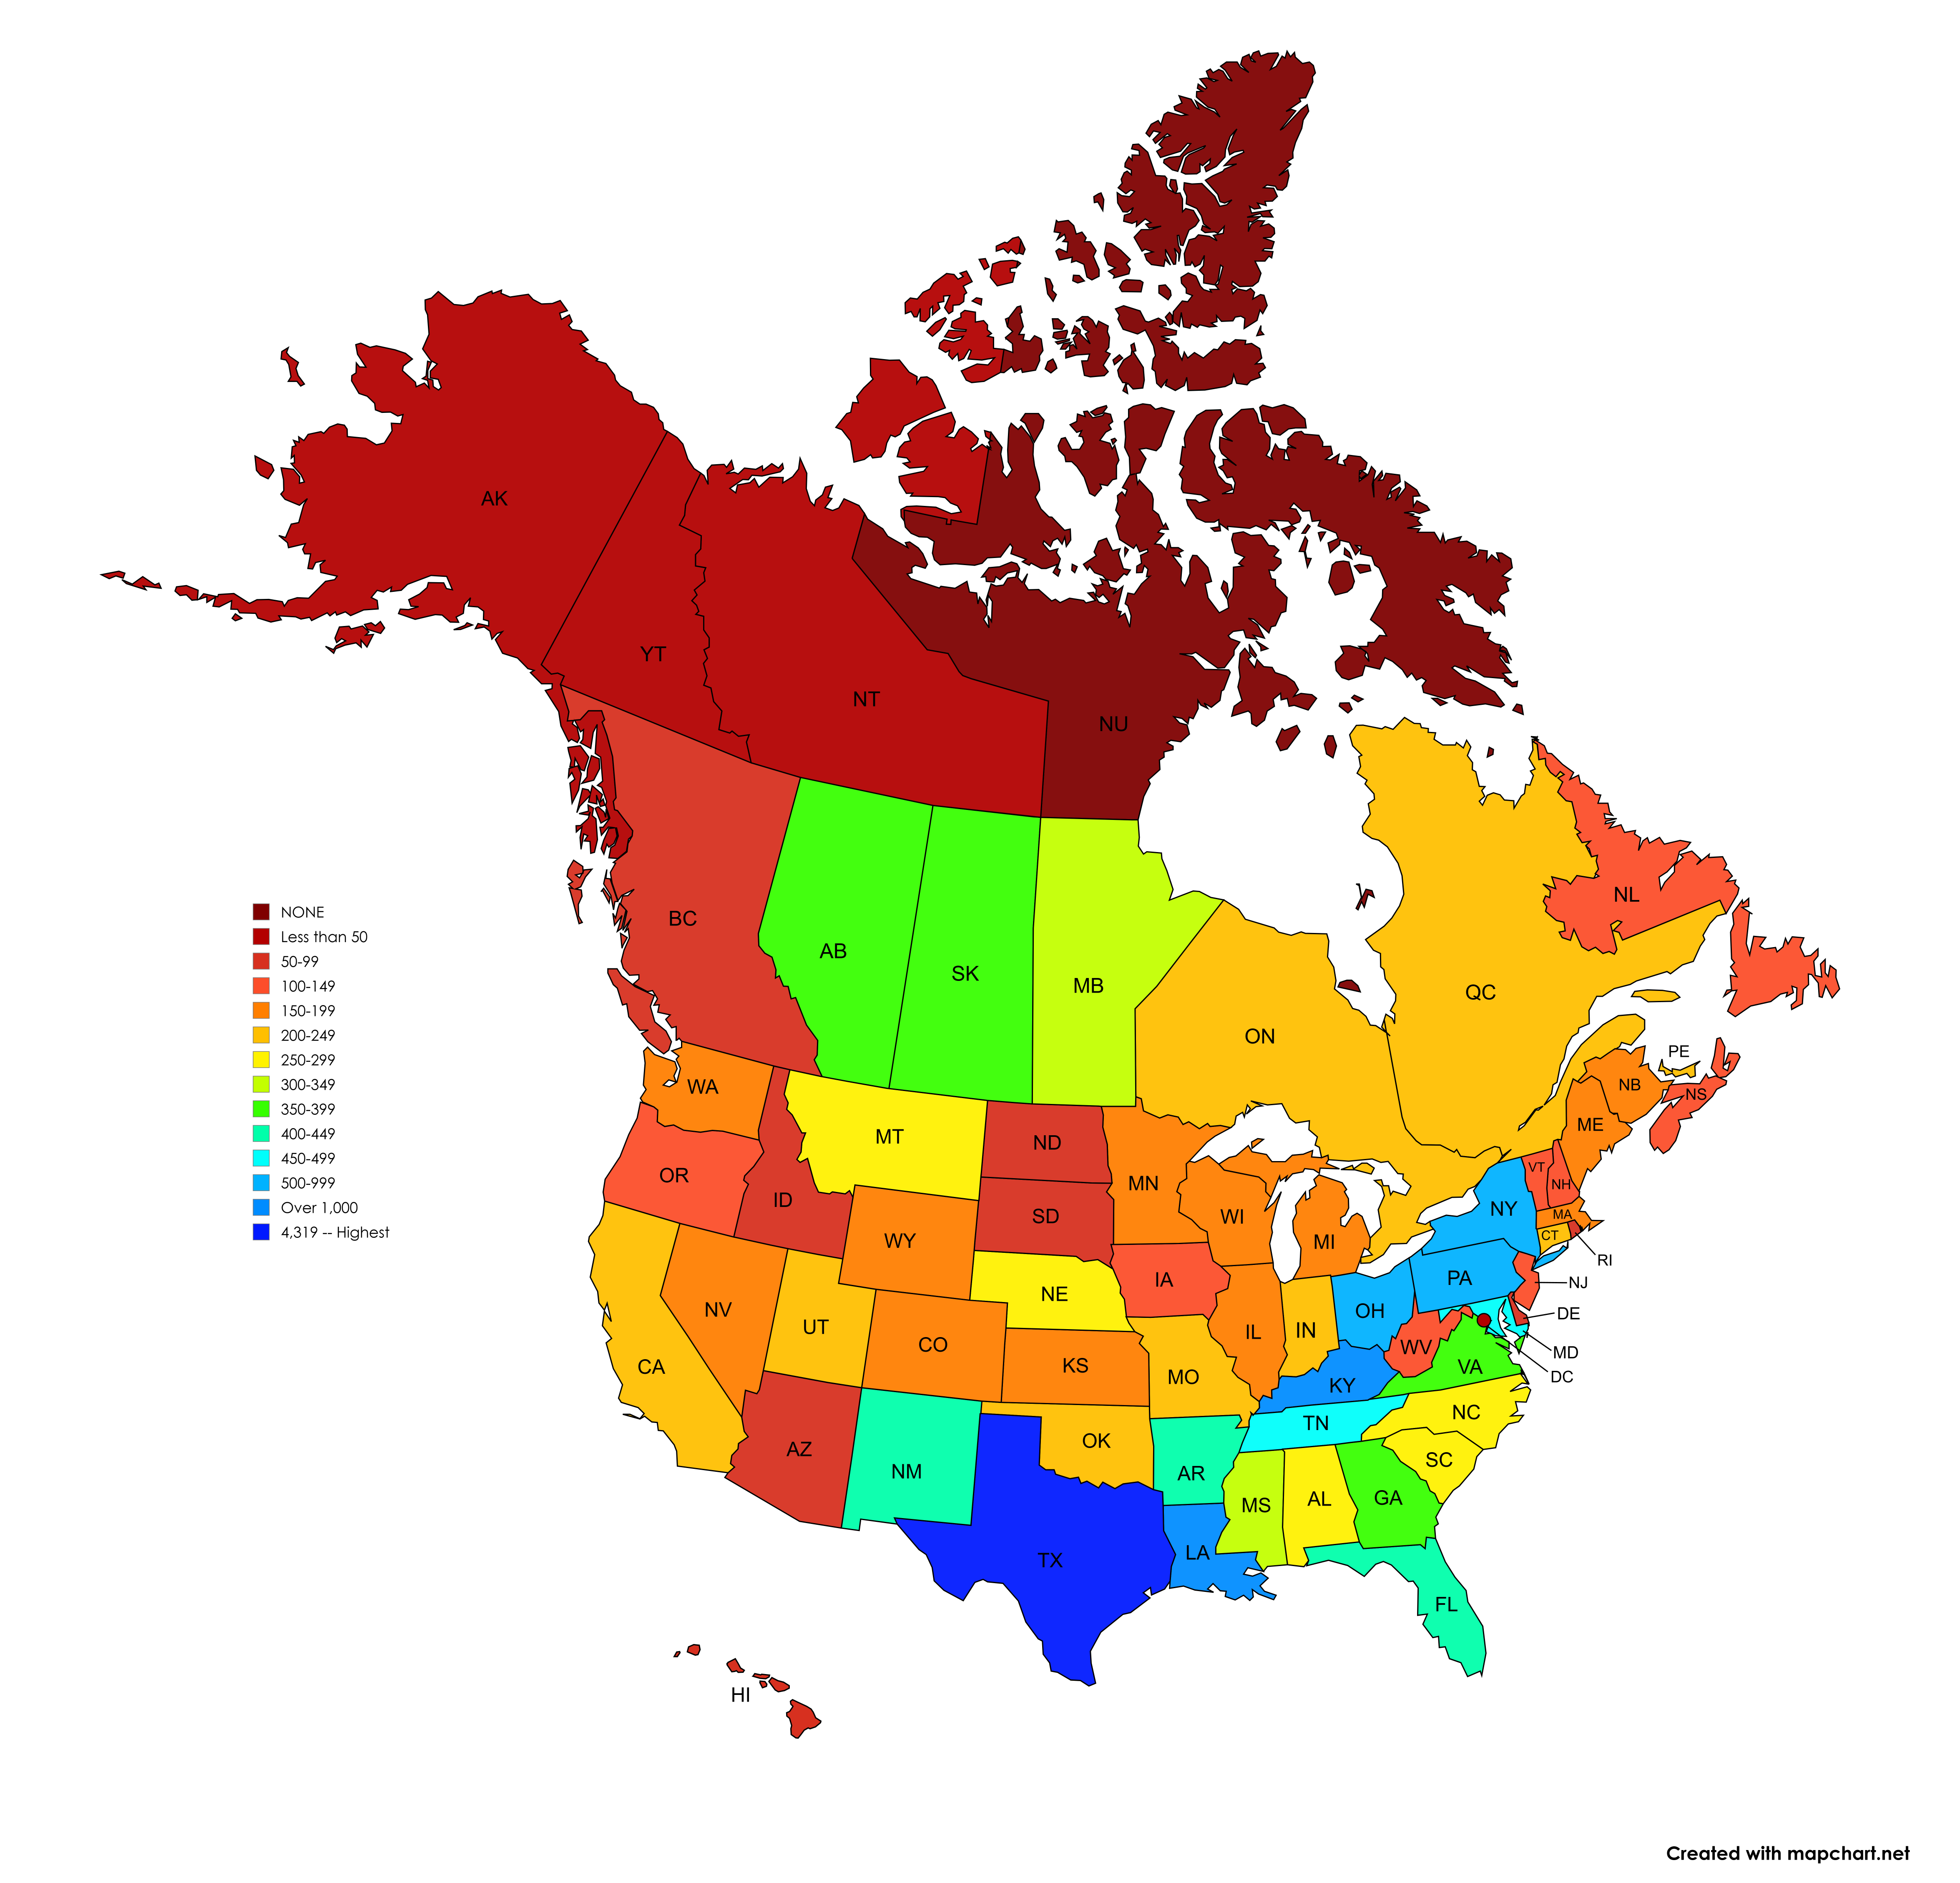
Number of Signed Highways Map by U.S. State and Canadian Province
The visualization titled 'Number of Signed Highways in each U.S. State and Canadian Province' presents a detailed count ...
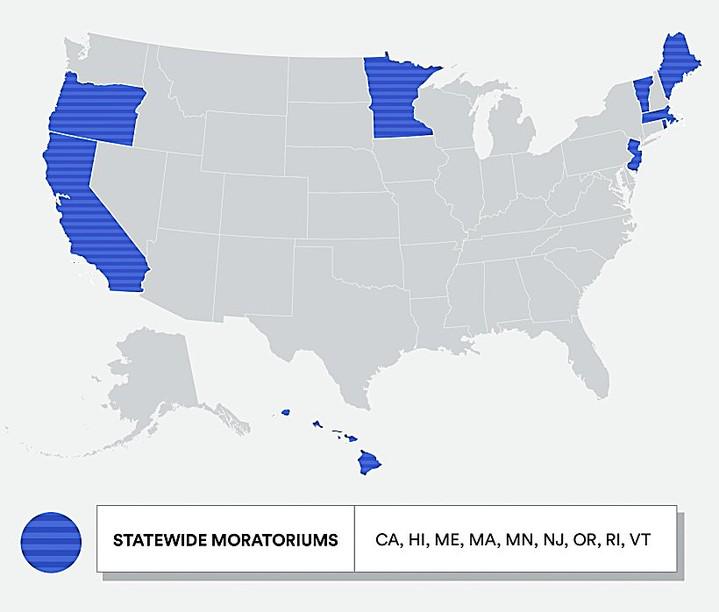
Map of U.S. States with Nuclear Power Plant Bans
This map visually represents the U.S. states that have enacted bans or restrictions on the construction of nuclear power...
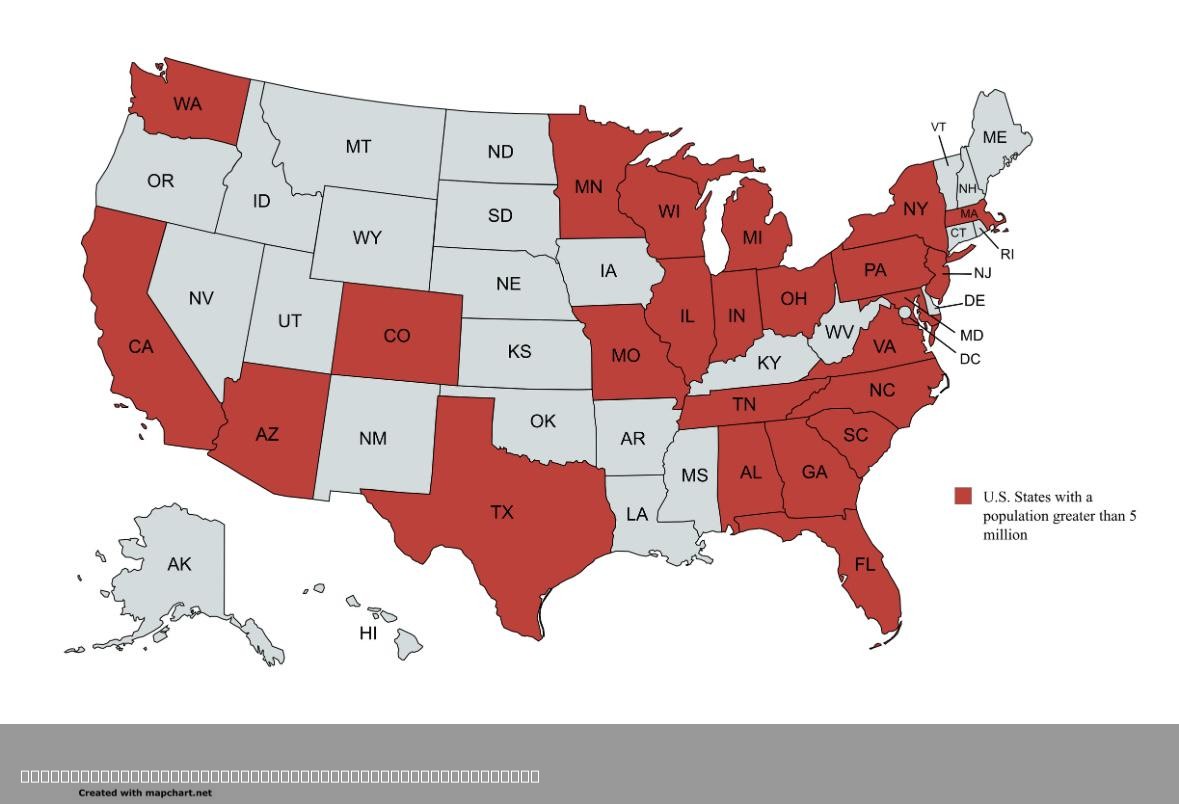
U.S. States with Population Greater than 5 Million Map
This map visualizes the U.S. states that have a population exceeding 5 million people. This population threshold highlig...
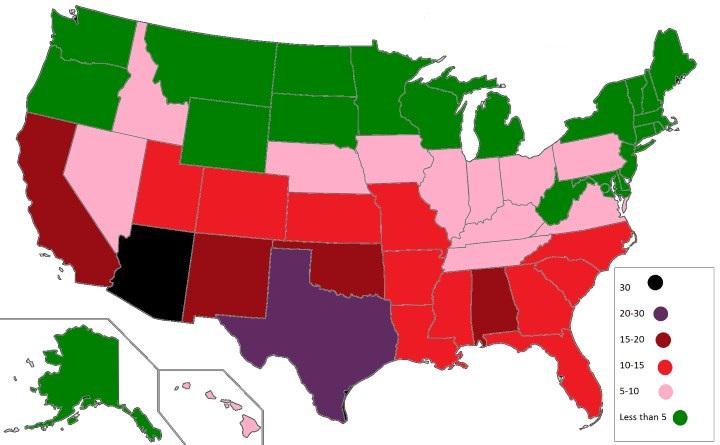
U.S. States with the Highest Number of Venomous Animals Map
The visualization titled "U.S. States with the Highest Number of Venomous Animals Map" provides a striking look at the d...
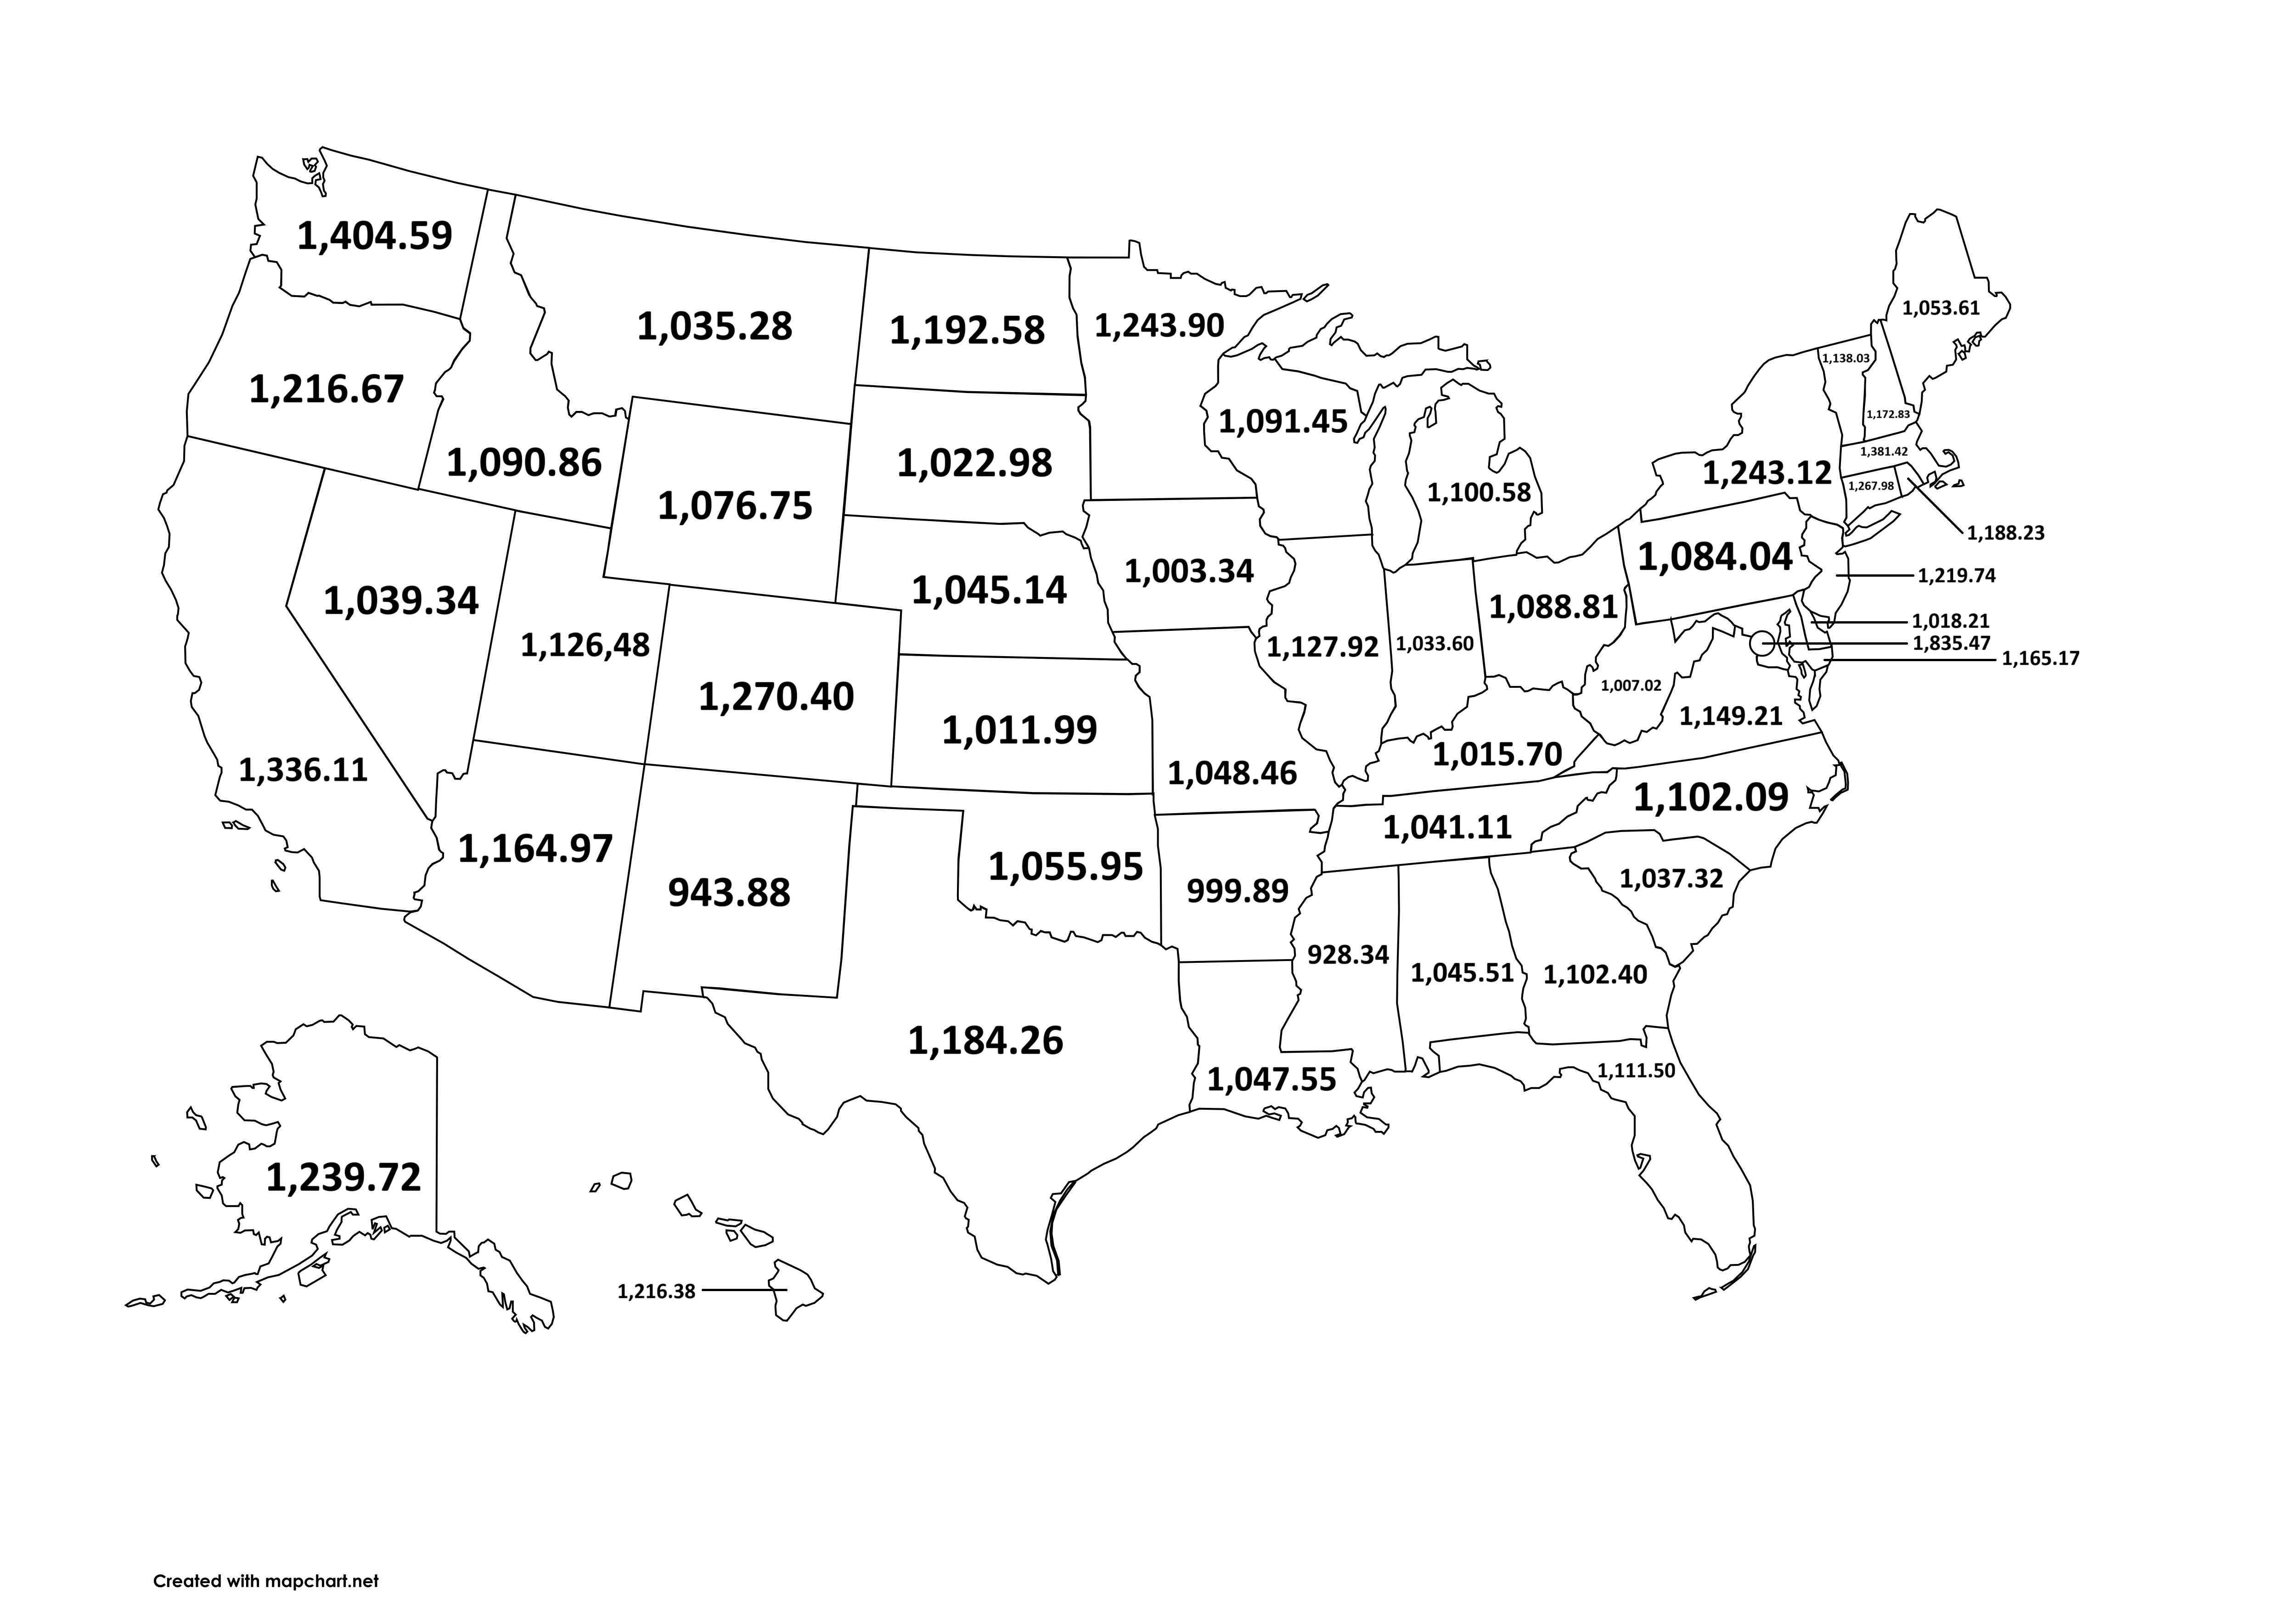
Average Weekly Earnings Map by U.S. State 2024
The map titled "Average Weekly Earnings of All Employees on Private Nonfarm Payrolls per U.S. State [2024]" provides a c...
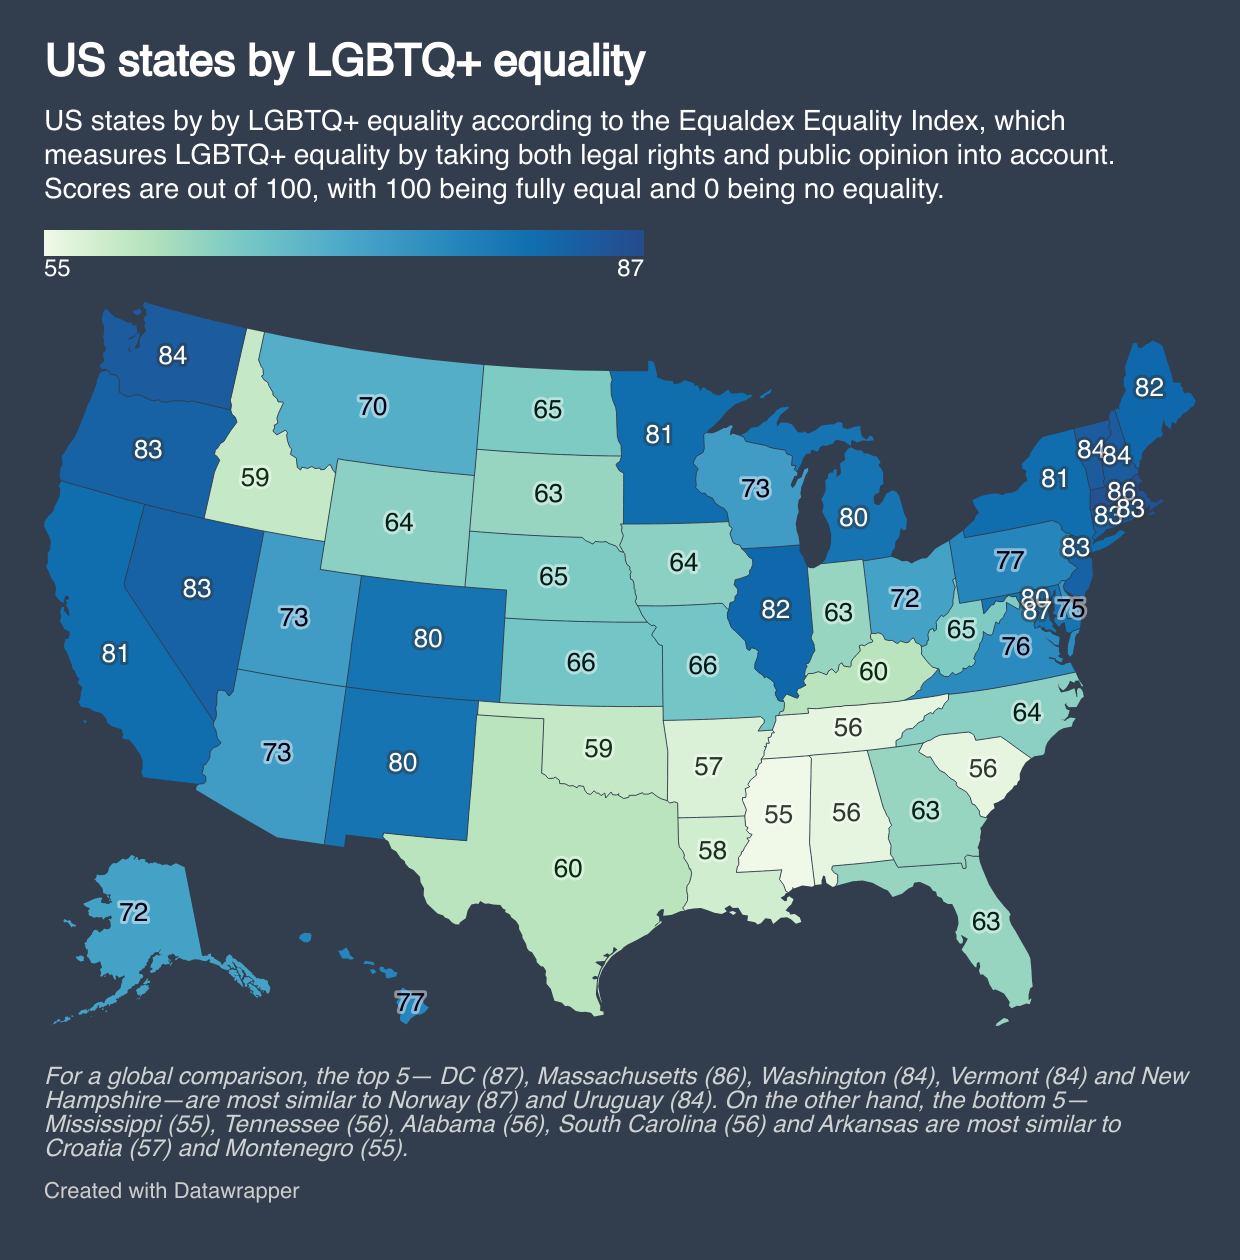
US States by LGBTQ+ Equality Map
This map visualizes LGBTQ+ equality across the United States by highlighting different states based on their laws and pr...
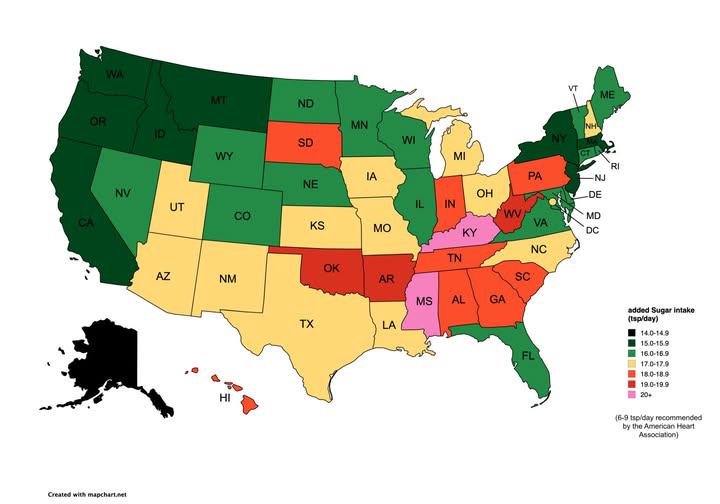
Map of Estimated Daily Sugar Intake By U.S. State
The "Map of Estimated Daily Sugar Intake By U.S. State" provides a visual representation of how much sugar the average p...
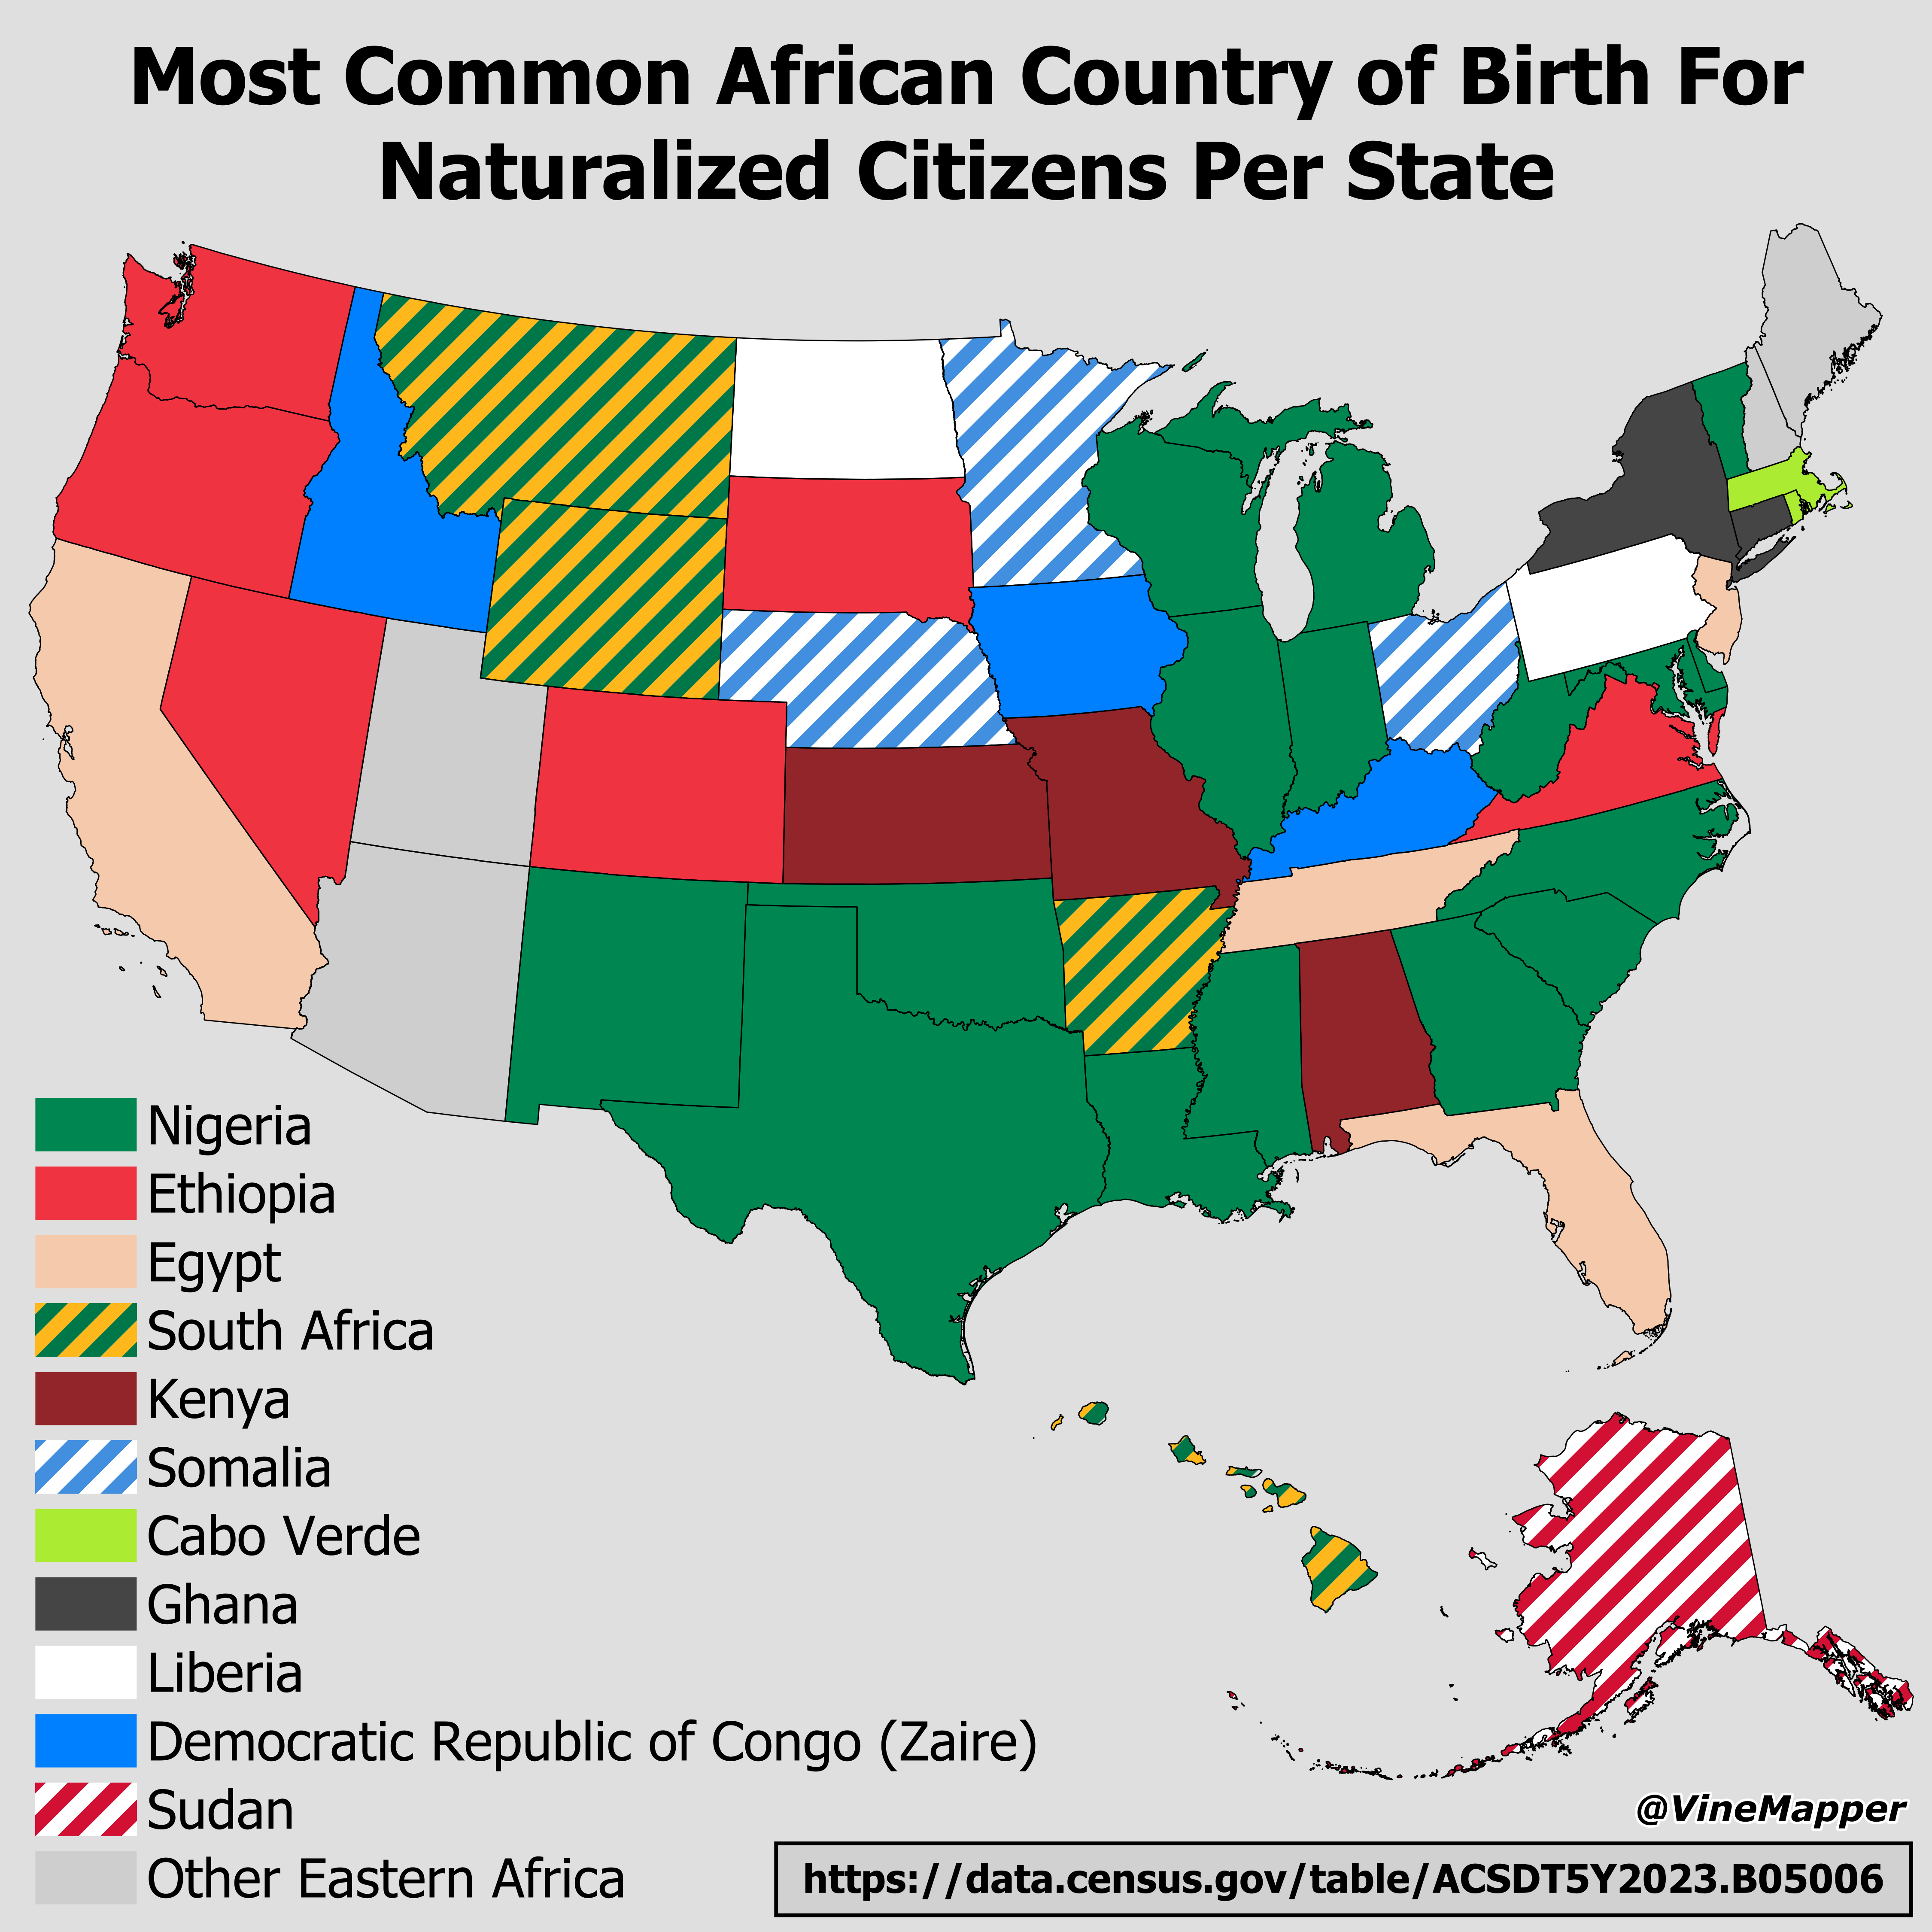
African Country of Birth for Naturalized Citizens Map
The visualization titled "Most Common African Country of Birth For Naturalized Citizens Per State" highlights the predom...
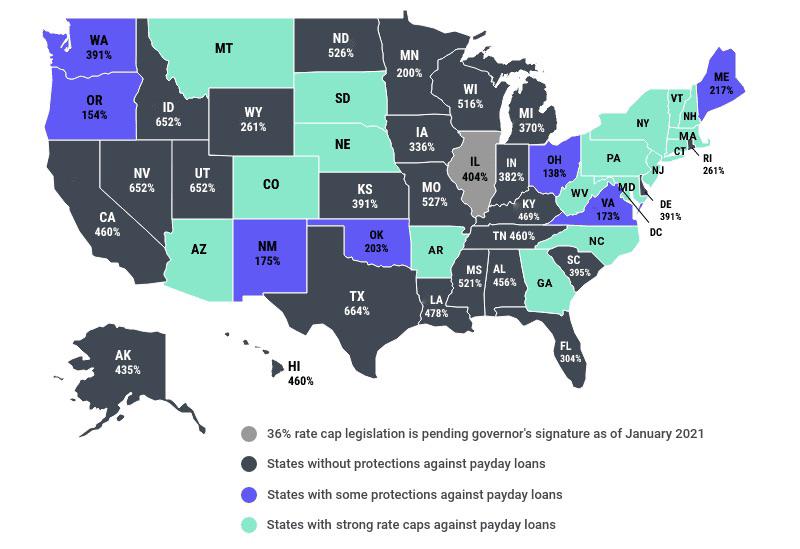
Payday Loan Interest Rates by State Map
The map titled "The Typical Payday Loan Interest Rates in U.S. States and If They Have Any Legislative Protections" prov...
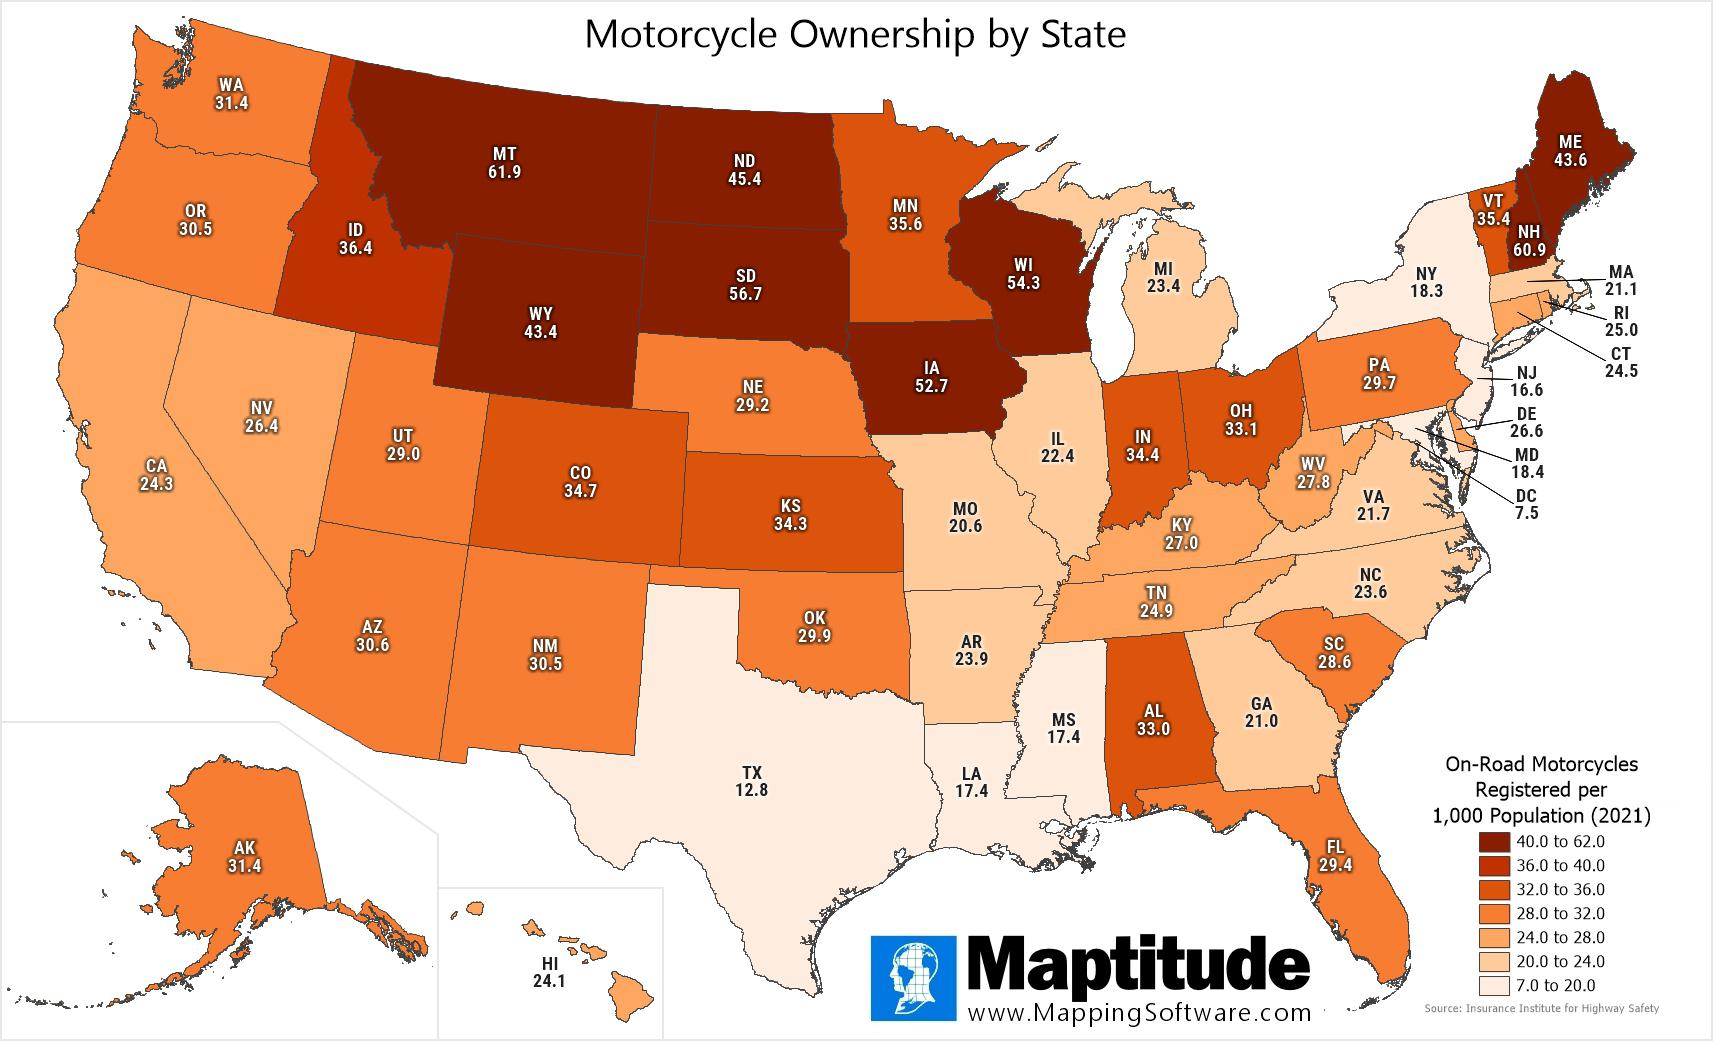
Motorcycle Ownership by U.S. State Map
The "Motorcycle Ownership by U.S. State" map presents a fascinating look into the distribution of registered, on-road mo...
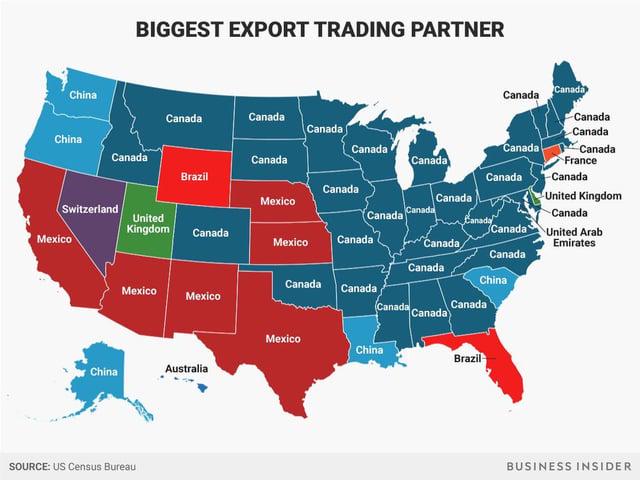
States Biggest Foreign Export Market Map
This map visualizes the biggest foreign export markets for each U.S. state, providing a clear picture of where American ...
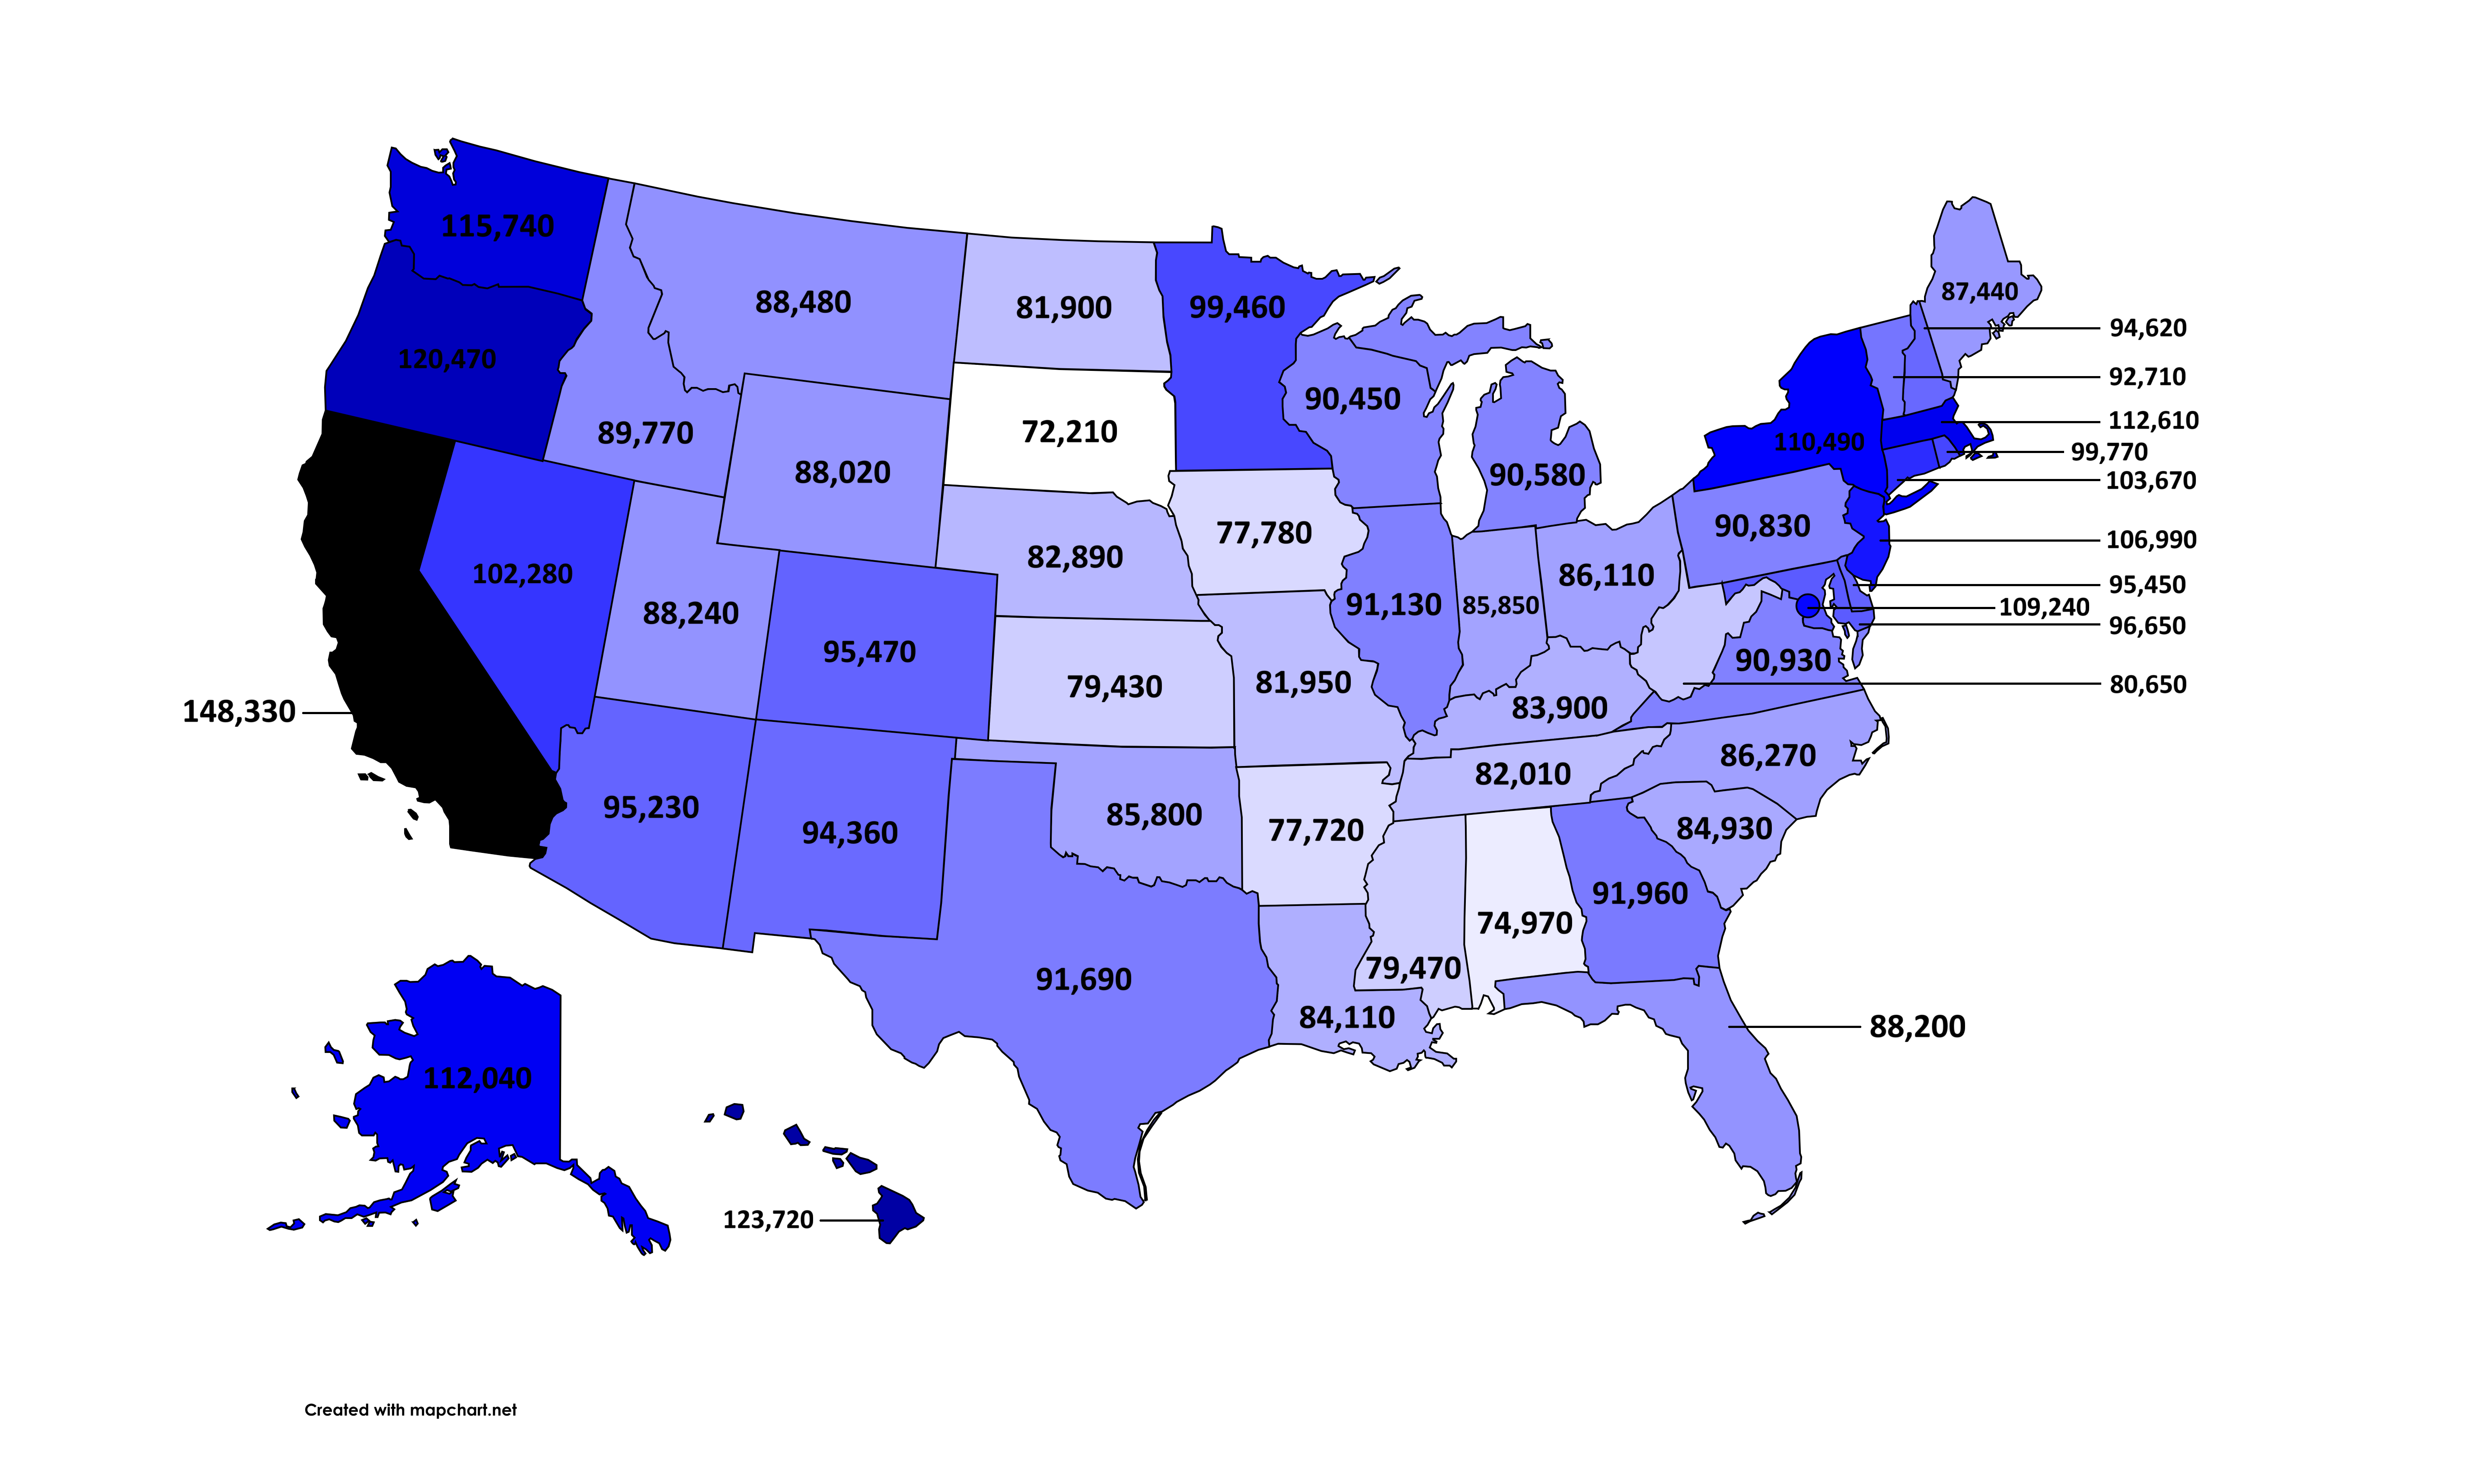
Average Salary of Registered Nurse by State Map
The visualization titled "Average Salary of a Registered Nurse by U.S. State (May 2024)" provides a comprehensive overvi...

Power Outages by State Map
This map illustrates the frequency and duration of power outages experienced by customers across various U.S. states. By...
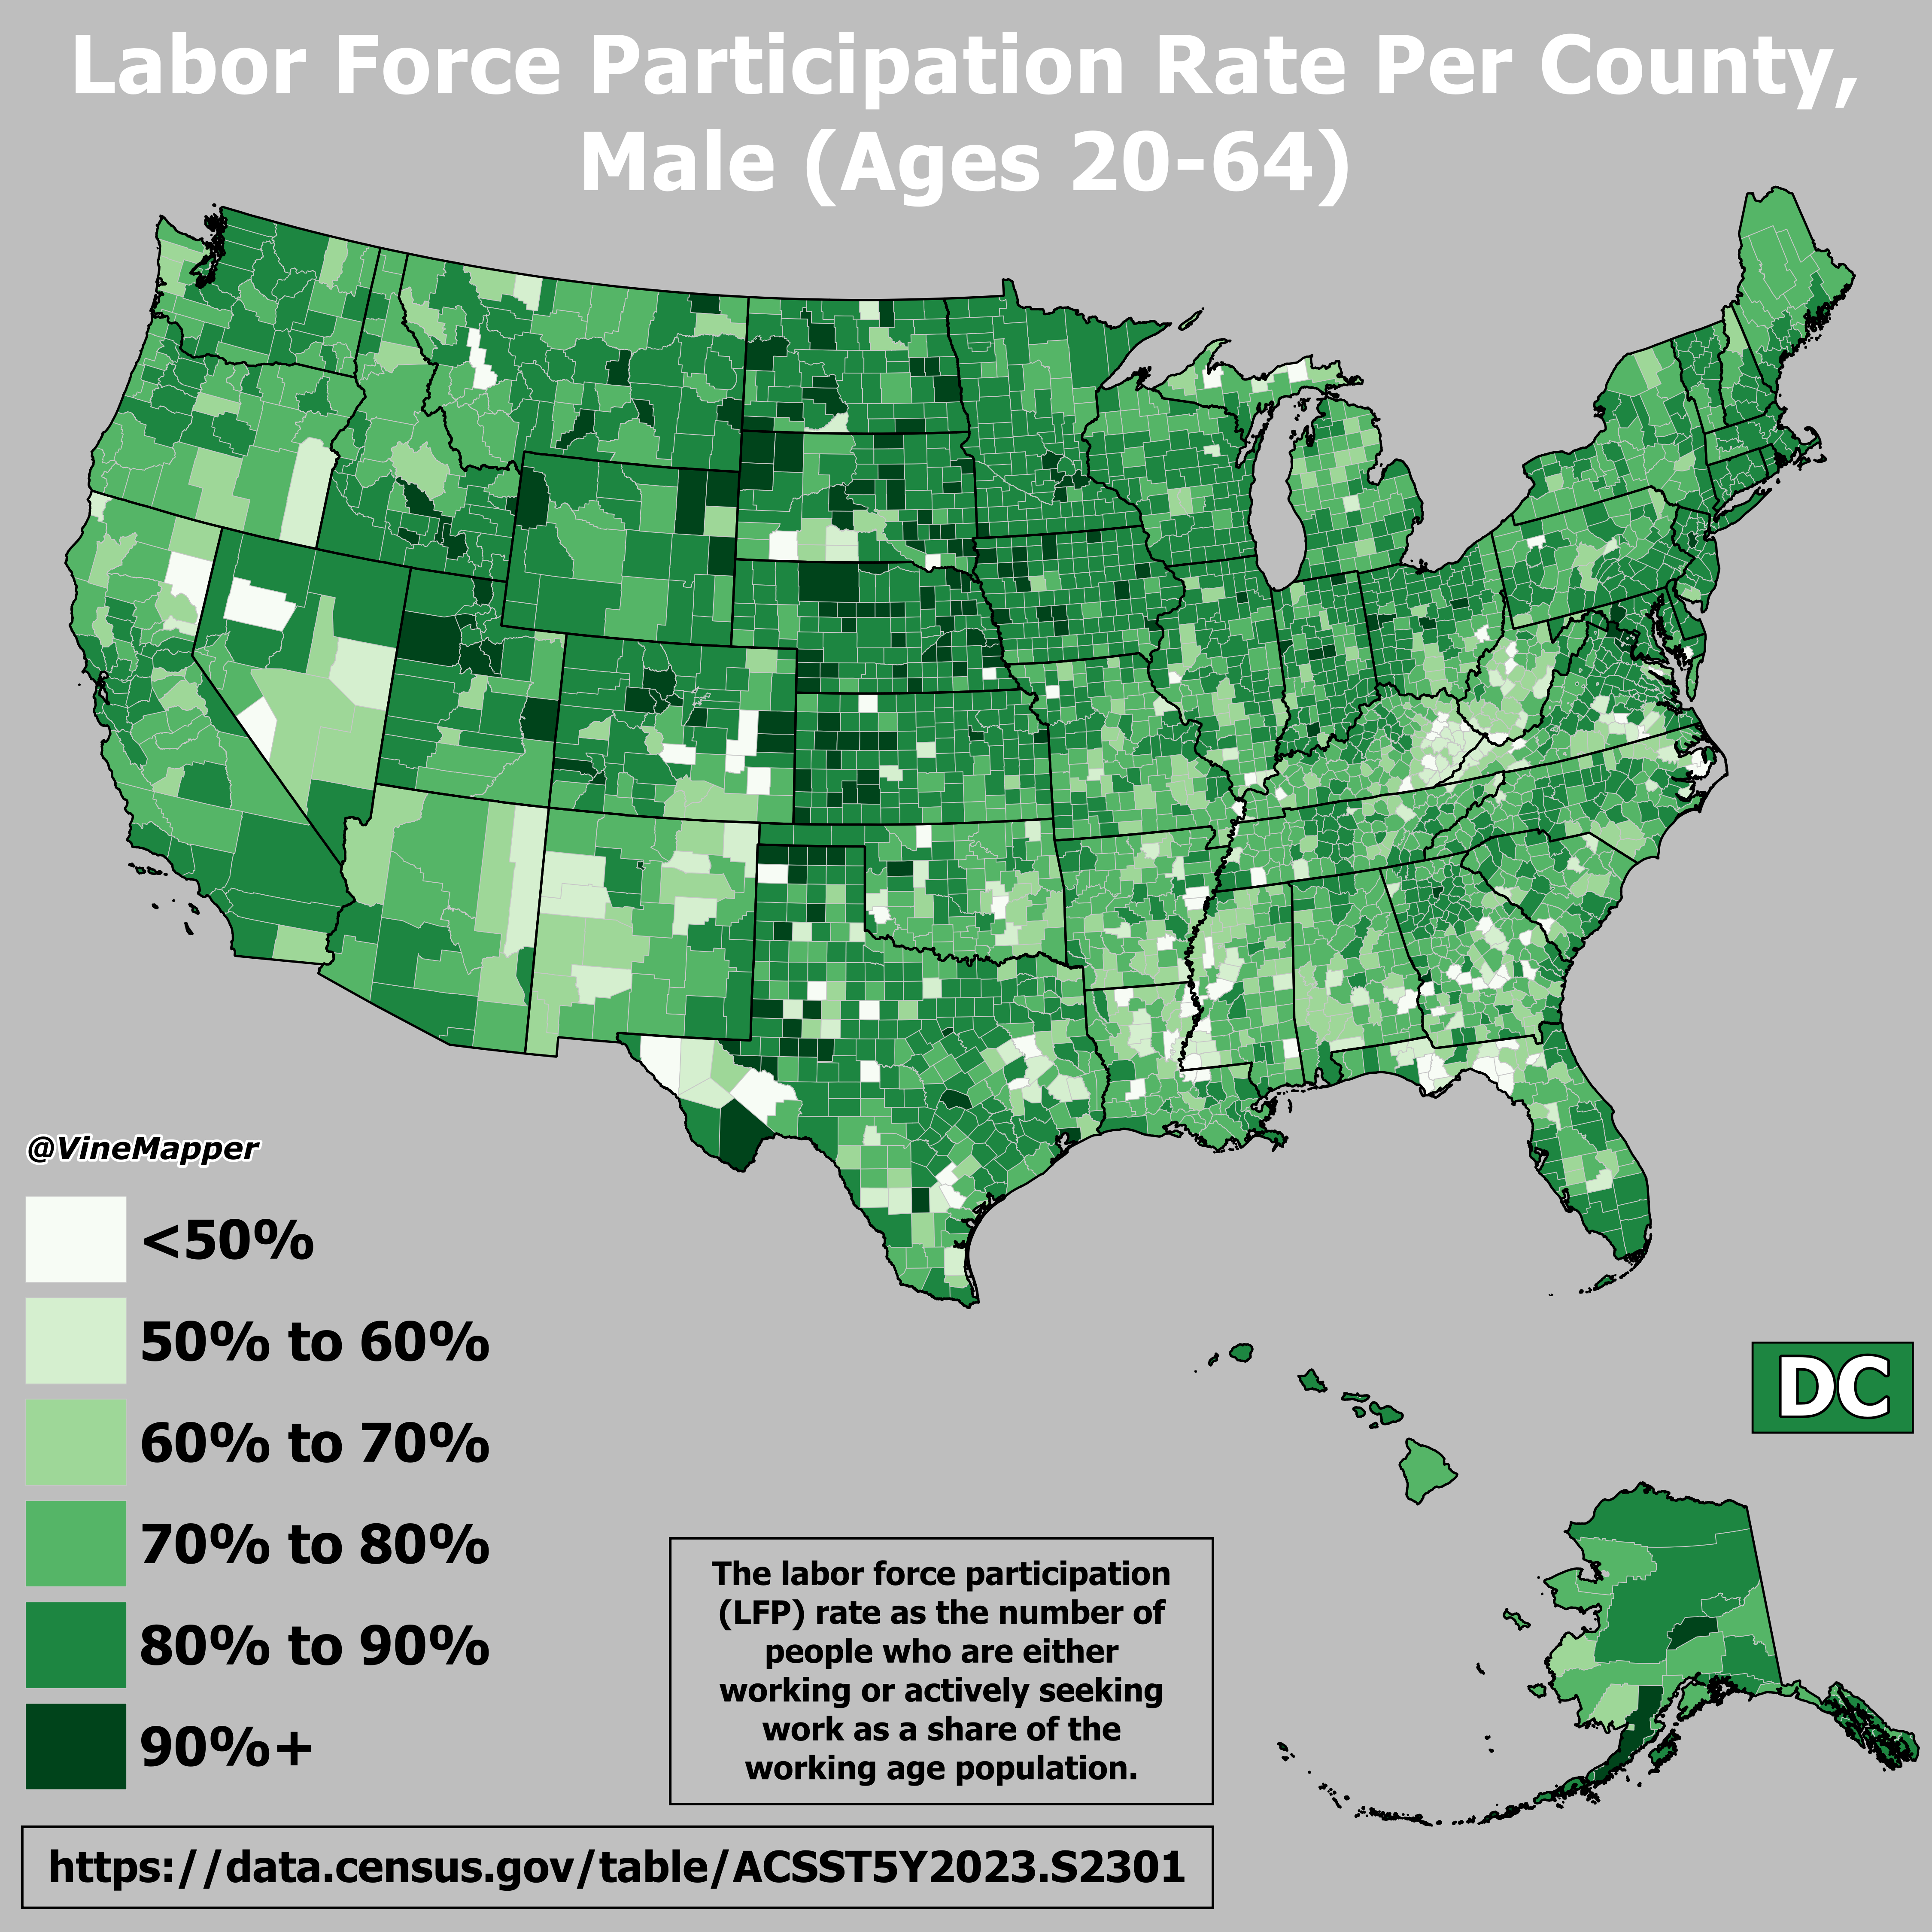
Labor Force Participation Rate Map for Males Ages 20-64
This map visualizes the labor force participation rate of males aged 20 to 64 across the United States. It highlights th...
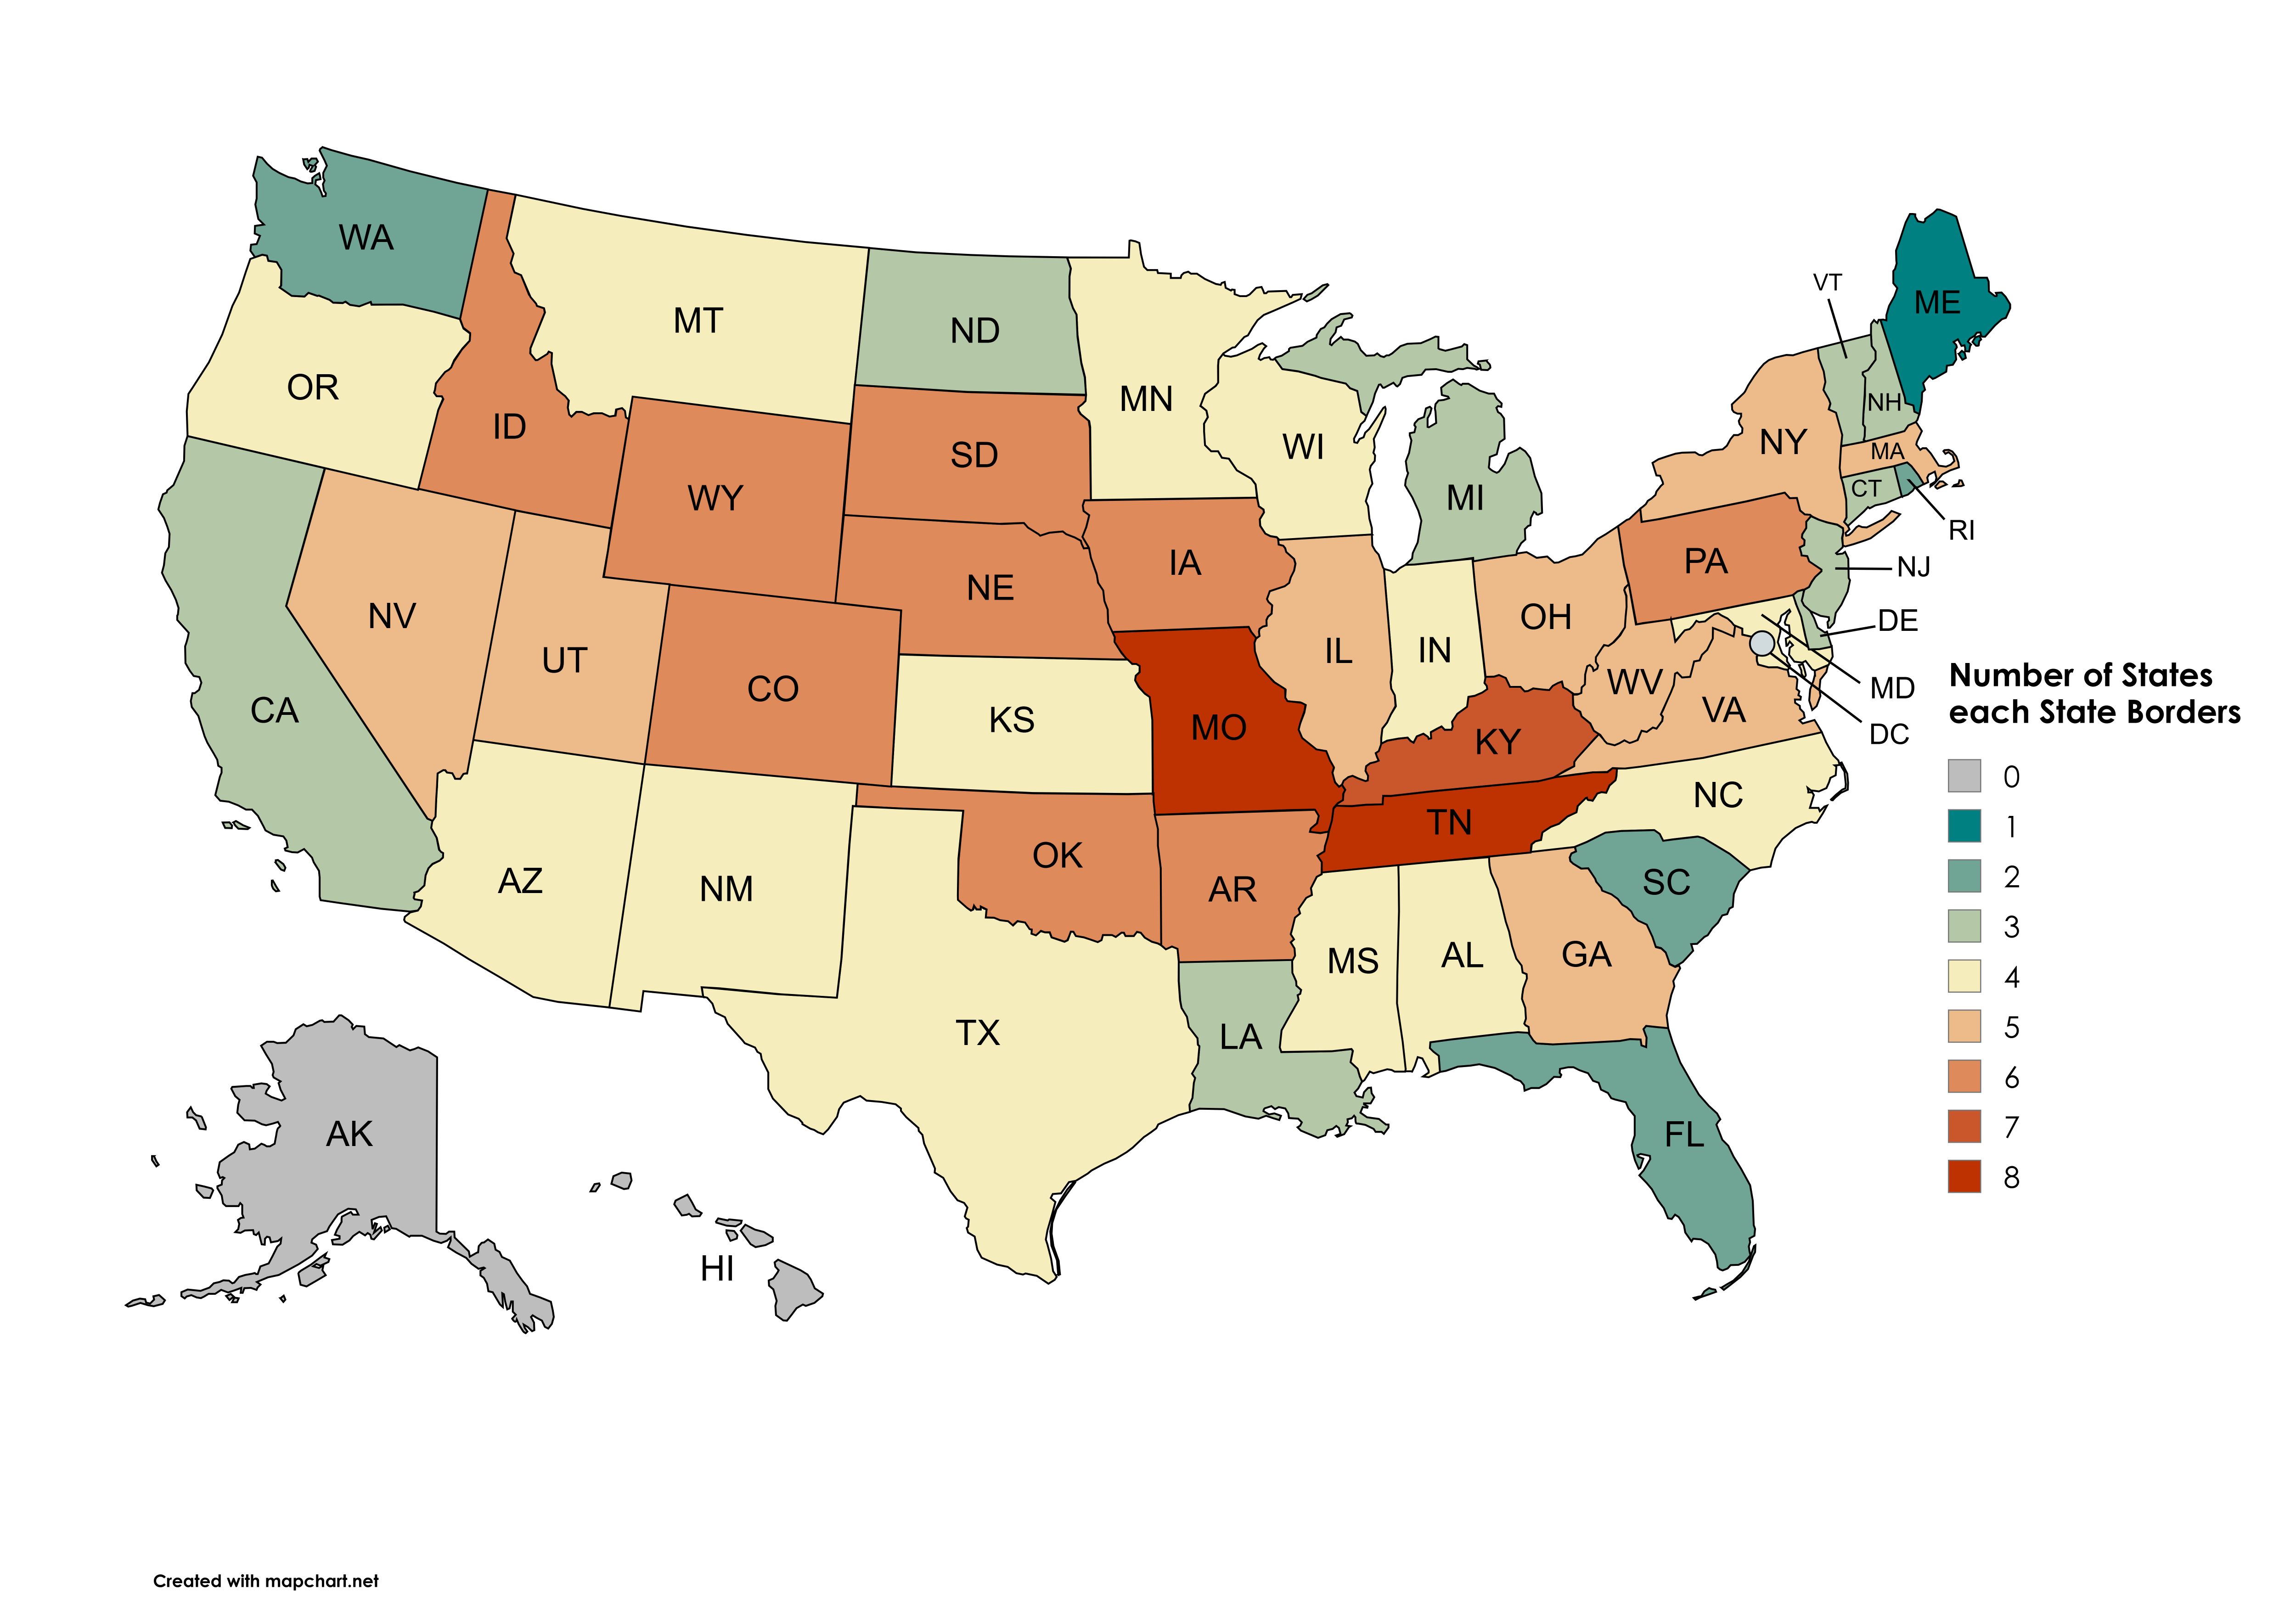
Map of States Each State Borders
This visualization illustrates the number of states each U.S. state borders, excluding Washington D.C., water borders, a...
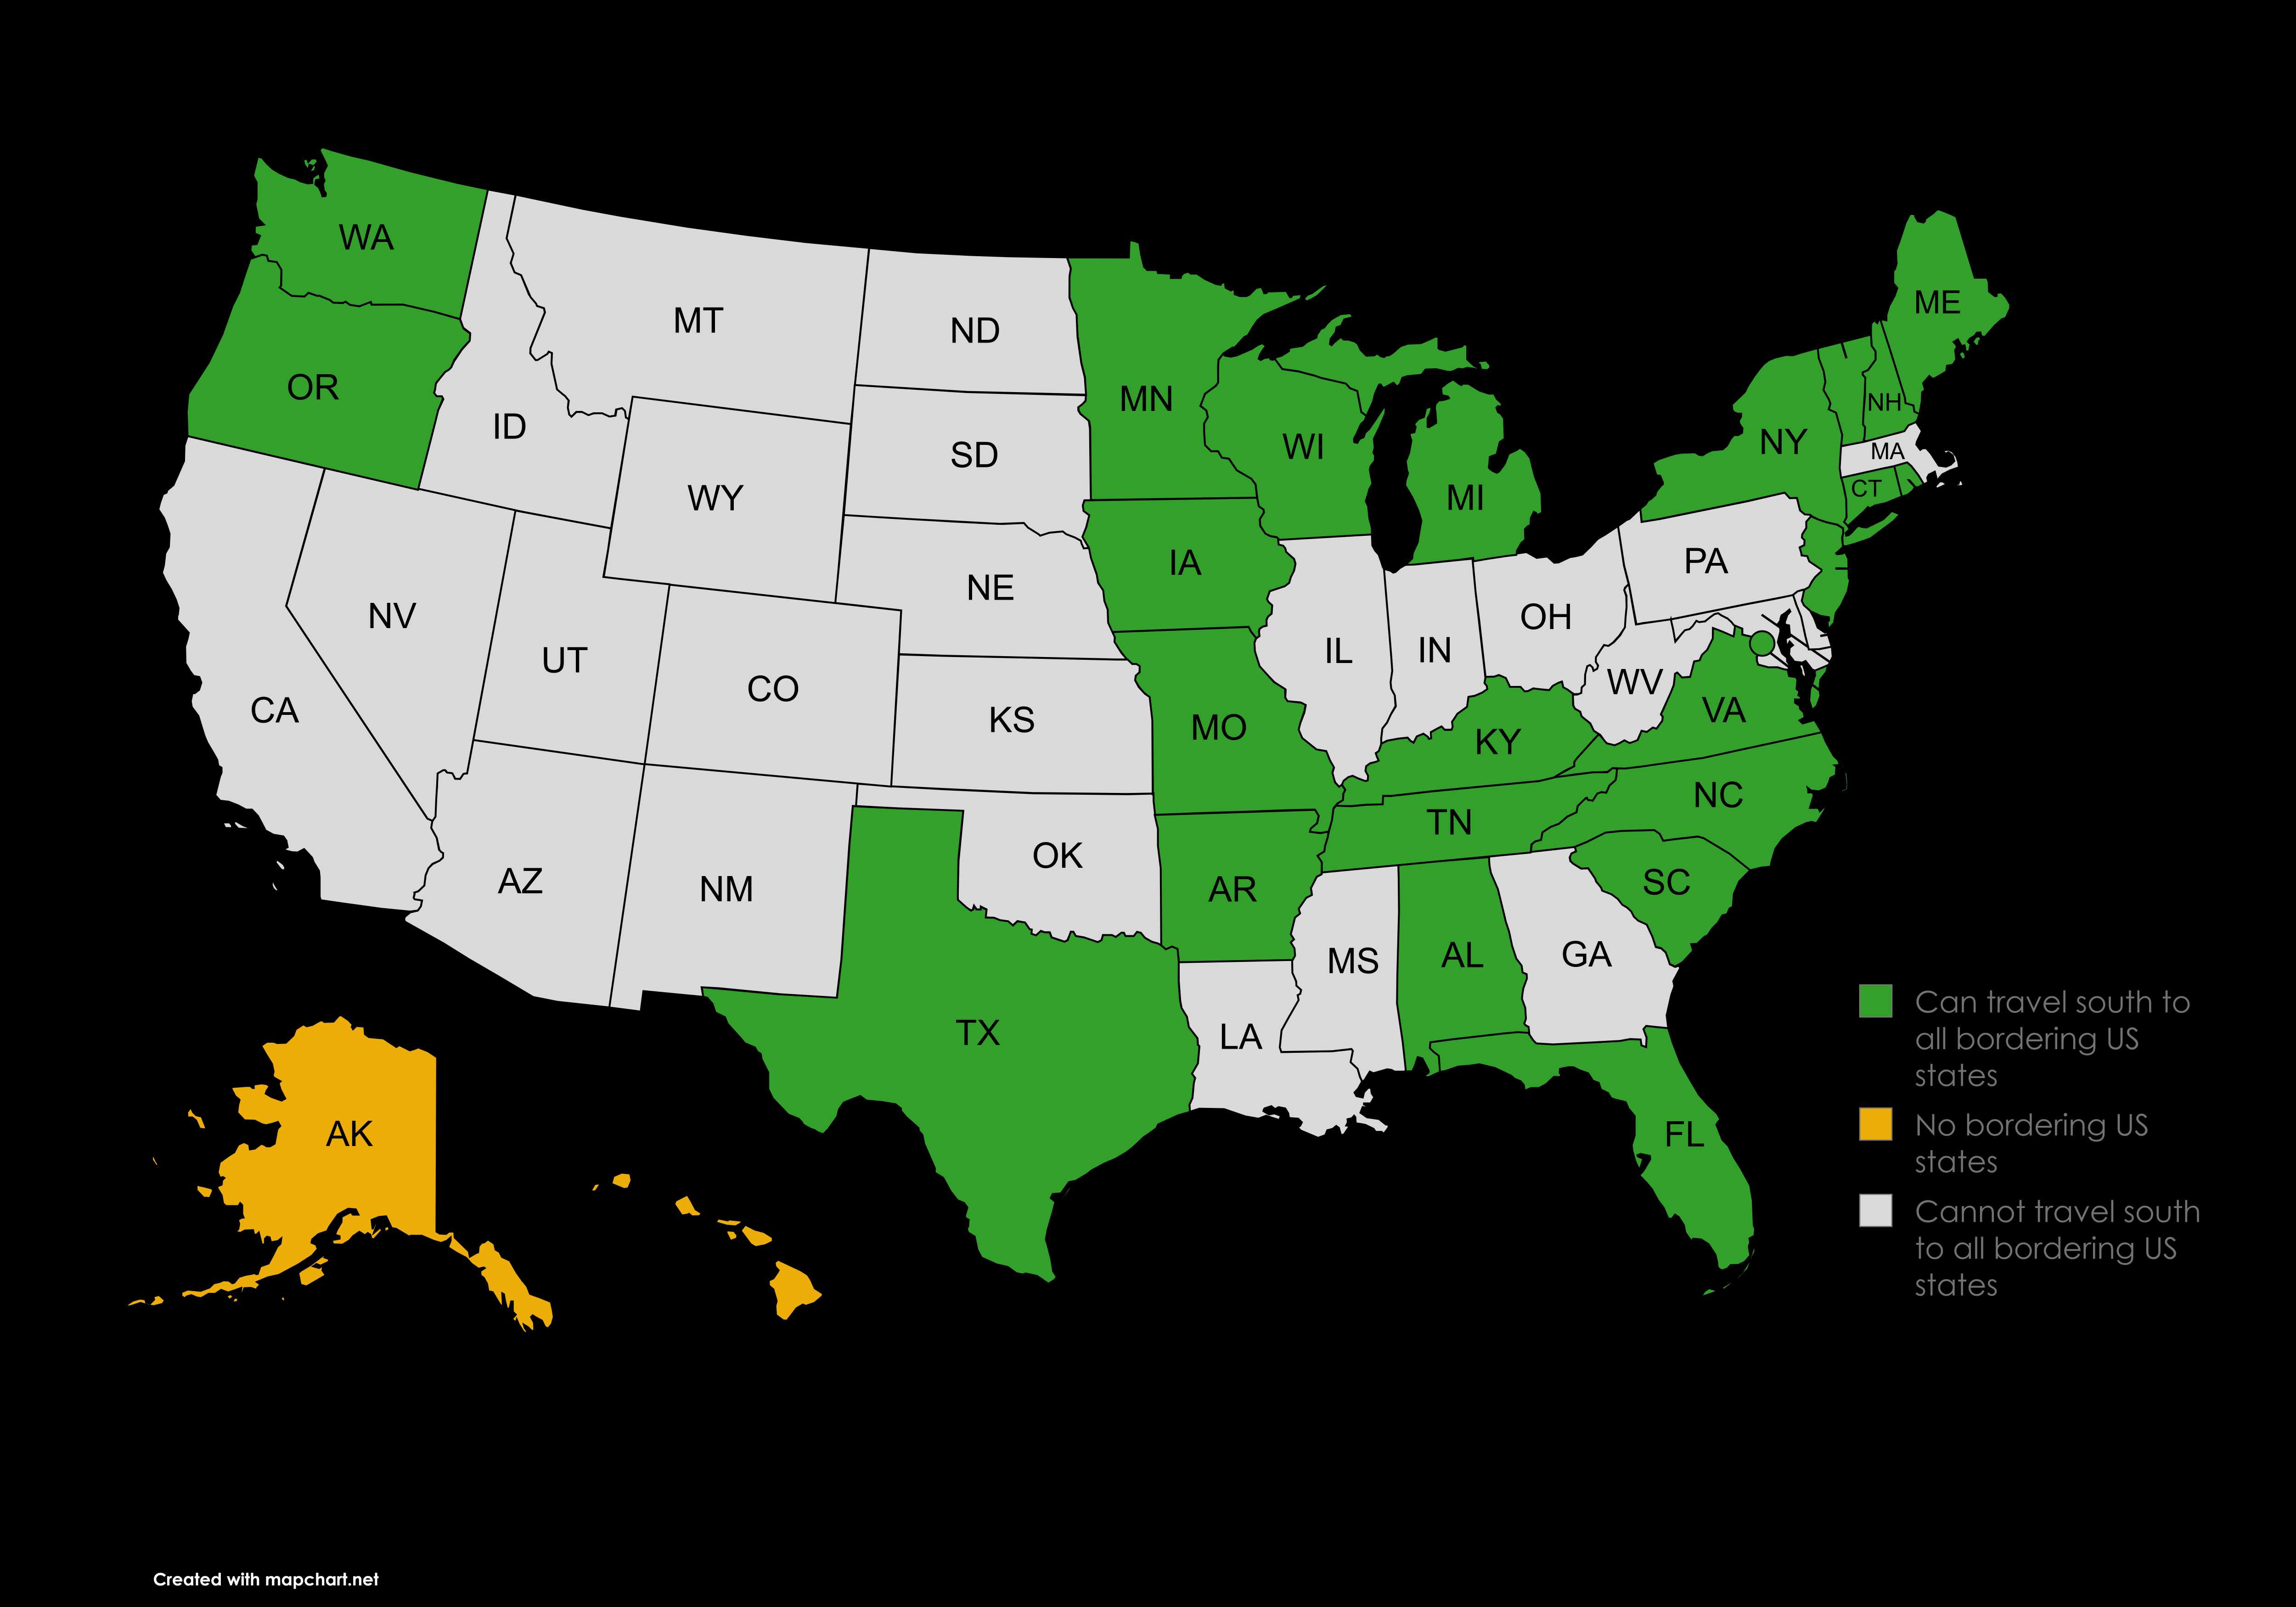
Map of US States Traveling South to Bordering States
This map illustrates a captivating geographical phenomenon: the U.S. states where it is possible to travel to every bord...