Map of Estimated Daily Sugar Intake By U.S. State

Marcus Rodriguez
Historical Geography Expert
Marcus Rodriguez specializes in historical cartography and geographic data analysis. With a background in both history and geography, he brings unique...
Geographic Analysis
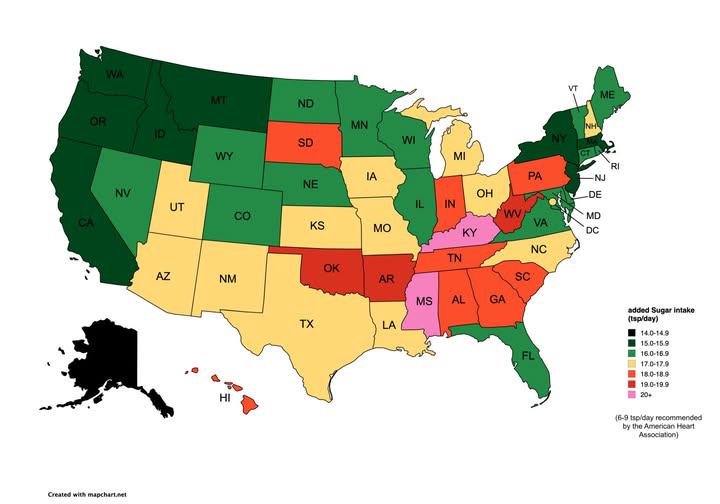
What This Map Shows
The "Map of Estimated Daily Sugar Intake By U.S. State" provides a visual representation of how much sugar the average person consumes daily across different states in the United States. This visualization highlights significant variations in sugar intake, showcasing which states have the highest and lowest consumption levels. By examining this map, viewers can gain insights into dietary habits and trends across the country, setting the stage for a deeper discussion about sugar's role in our diets and health.
Deep Dive into Sugar Intake in the U.S.
Sugar intake is an intriguing topic, especially considering the ongoing conversations about health, nutrition, and dietary guidelines. According to the U.S. Dietary Guidelines, the recommended daily limit for added sugars is about 10% of total daily caloric intake. For an average adult consuming 2,000 calories, this translates to roughly 200 calories or about 50 grams of added sugars. However, data shows that many Americans exceed this recommendation, leading to potential health risks such as obesity, diabetes, and heart disease.
Interestingly, the sugar we consume comes from various sources, including sugary beverages, desserts, and processed foods. A significant portion of added sugars can be traced back to soft drinks and energy drinks, which are particularly popular in states with high sugar consumption rates. For instance, states like Louisiana and Mississippi often report higher averages of daily sugar intake, largely due to the cultural preference for sweetened beverages and desserts.
Have you ever wondered why some regions consume more sugar than others? Cultural influences play a significant role. In the Southern states, for example, sweet tea and decadent desserts are staples of the cuisine, contributing to higher sugar levels. In contrast, states in the Pacific Northwest, like Oregon and Washington, show lower sugar consumption. This could be attributed to a greater emphasis on health and wellness trends, which often promote natural and less-processed foods.
Moreover, it’s essential to understand the implications of high sugar intake. Excessive sugar consumption is linked to various health issues, including obesity, metabolic syndrome, and dental problems. A striking statistic is that nearly 70% of adults in the U.S. are classified as overweight or obese, a condition often exacerbated by high sugar intake. As consumers become more aware of these health risks, there's a growing movement towards reducing sugar consumption, with many states advocating for public health initiatives aimed at educating individuals about the effects of sugar.
Regional Analysis
Looking at the map, you’ll notice distinct patterns in sugar intake across different regions of the United States. The Southern states, such as Alabama, Arkansas, and Tennessee, consistently report higher daily sugar intake, often exceeding 80 grams per person. This trend correlates with cultural dietary preferences that favor sweetened beverages and desserts.
Conversely, states like California and Colorado show much lower sugar consumption, with averages hovering around 60 grams per day. These differences might be influenced by demographic factors, such as age and income levels, as well as lifestyle choices that prioritize health and fitness. In urban areas, where access to fresh produce and health-conscious food options is more prevalent, sugar intake tends to be lower compared to rural regions.
Interestingly, the Midwest presents a mixed bag; states like Minnesota show moderate sugar consumption, while others like Indiana may exhibit higher levels, perhaps due to the popularity of sugary snacks and processed foods. This regional variation highlights the complex interplay between culture, accessibility to healthy foods, and local dietary habits.
Significance and Impact
Understanding sugar intake by state is more than just a statistic; it has profound implications for public health. As sugar consumption continues to be linked to chronic health issues, states with higher average intakes may need to prioritize health education and intervention programs. The increasing awareness of sugar's role in health issues is prompting changes in consumer behavior, with many looking for healthier alternatives or reducing their sugar intake altogether.
Moreover, this map can serve as a vital tool for policymakers and health advocates aiming to create tailored strategies that address dietary health in specific regions. For example, states with higher sugar consumption might benefit from initiatives that promote healthier eating habits, such as educational campaigns on nutrition and the dangers of excessive sugar intake.
In summary, the "Map of Estimated Daily Sugar Intake By U.S. State" not only reveals current consumption patterns but also acts as a call to action for individuals and communities to reconsider their dietary choices. As we move forward, tracking these trends will be crucial for understanding and improving public health across the nation.
Visualization Details
- Published
- September 3, 2025
- Views
- 88
Comments
Loading comments...