nutrition Maps
12 geographic visualizations tagged with "nutrition"
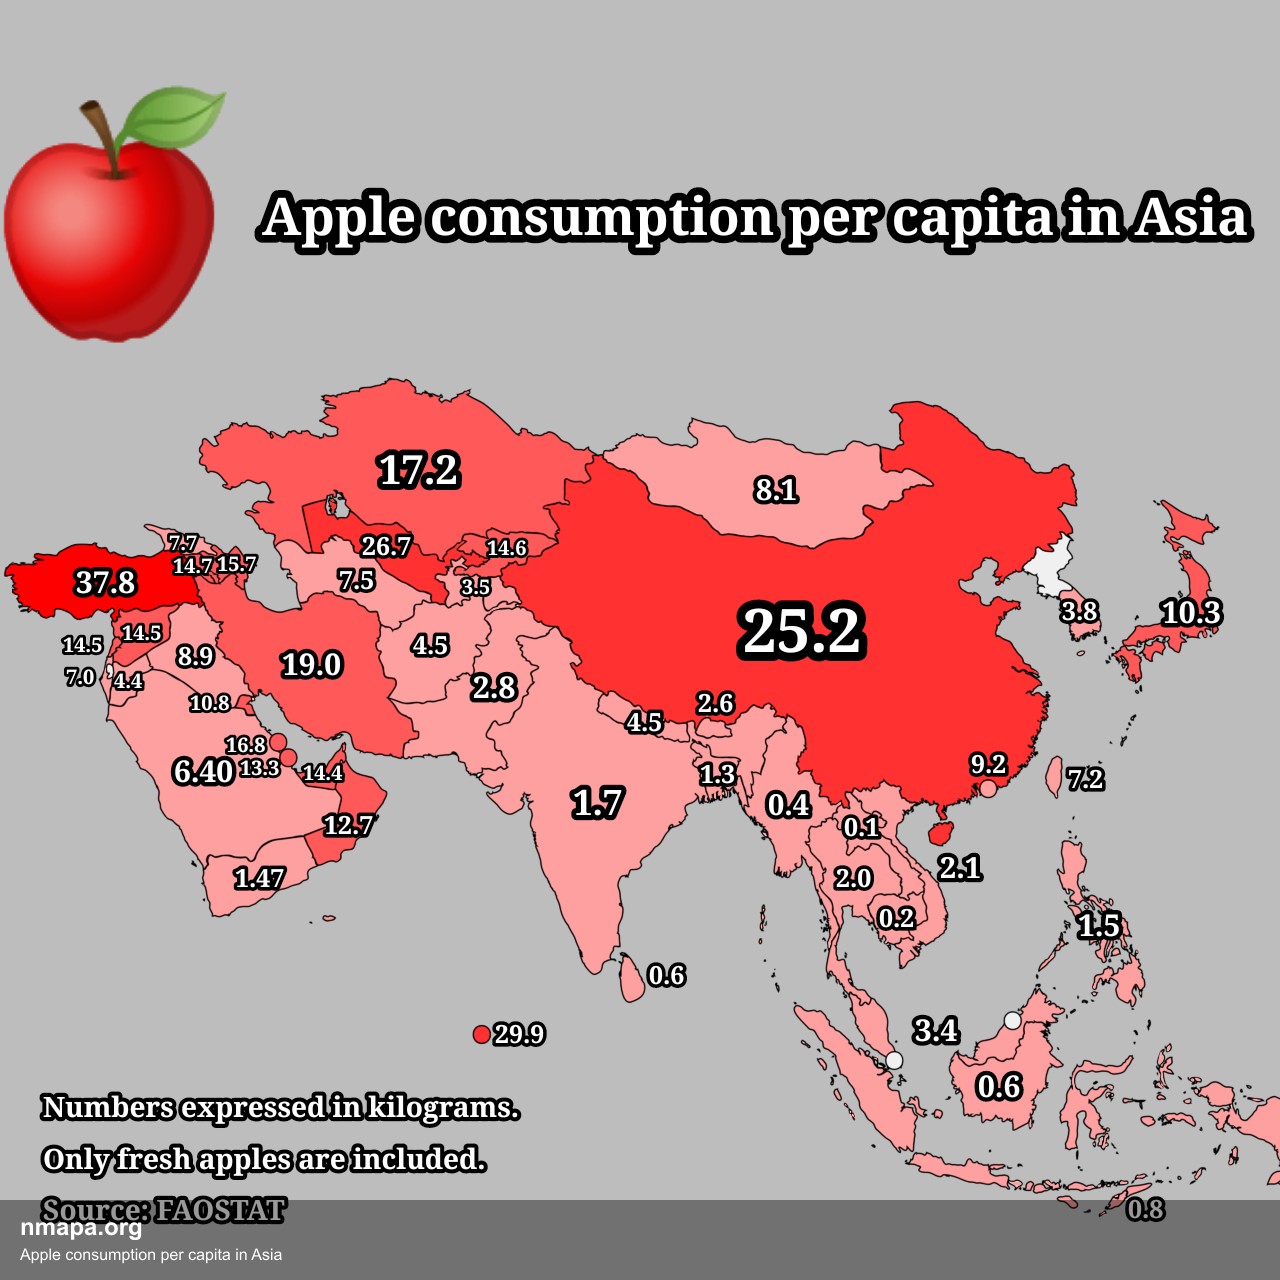
Apple Consumption Per Capita in Asia Map
The 'Apple Consumption Per Capita in Asia Map' presents a comprehensive visualization of apple consumption across variou...
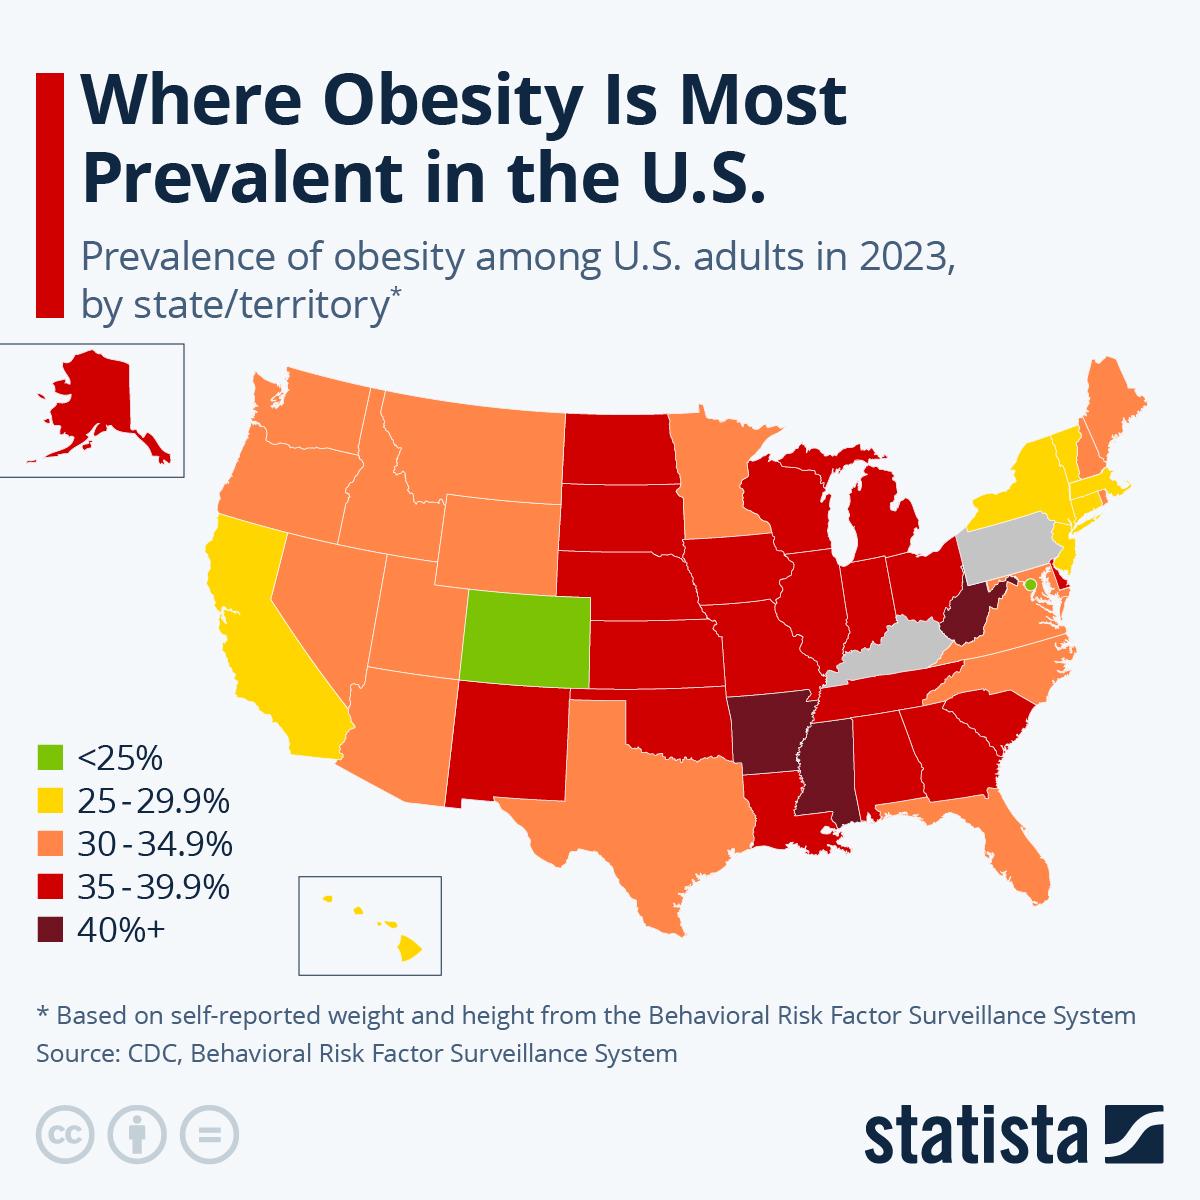
American Obesity Statistics Map
The American Obesity Statistics Map visually represents the prevalence of obesity across the United States. It highlight...
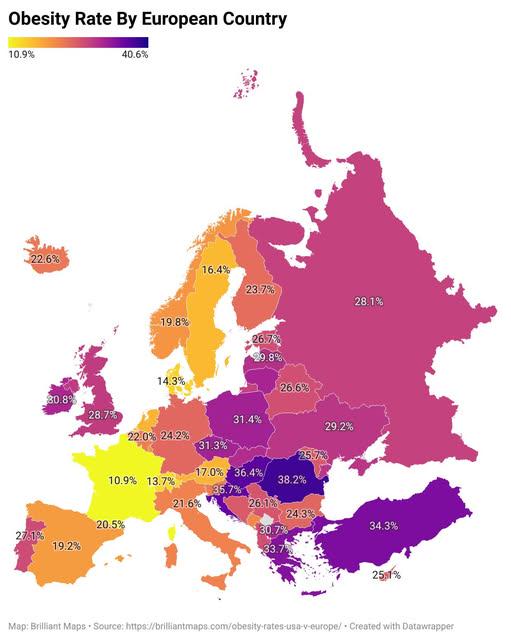
European Obesity Rate by Country Map
The "European Obesity Rate by Country Map" for 2024 offers a vivid depiction of the prevalence of obesity across various...
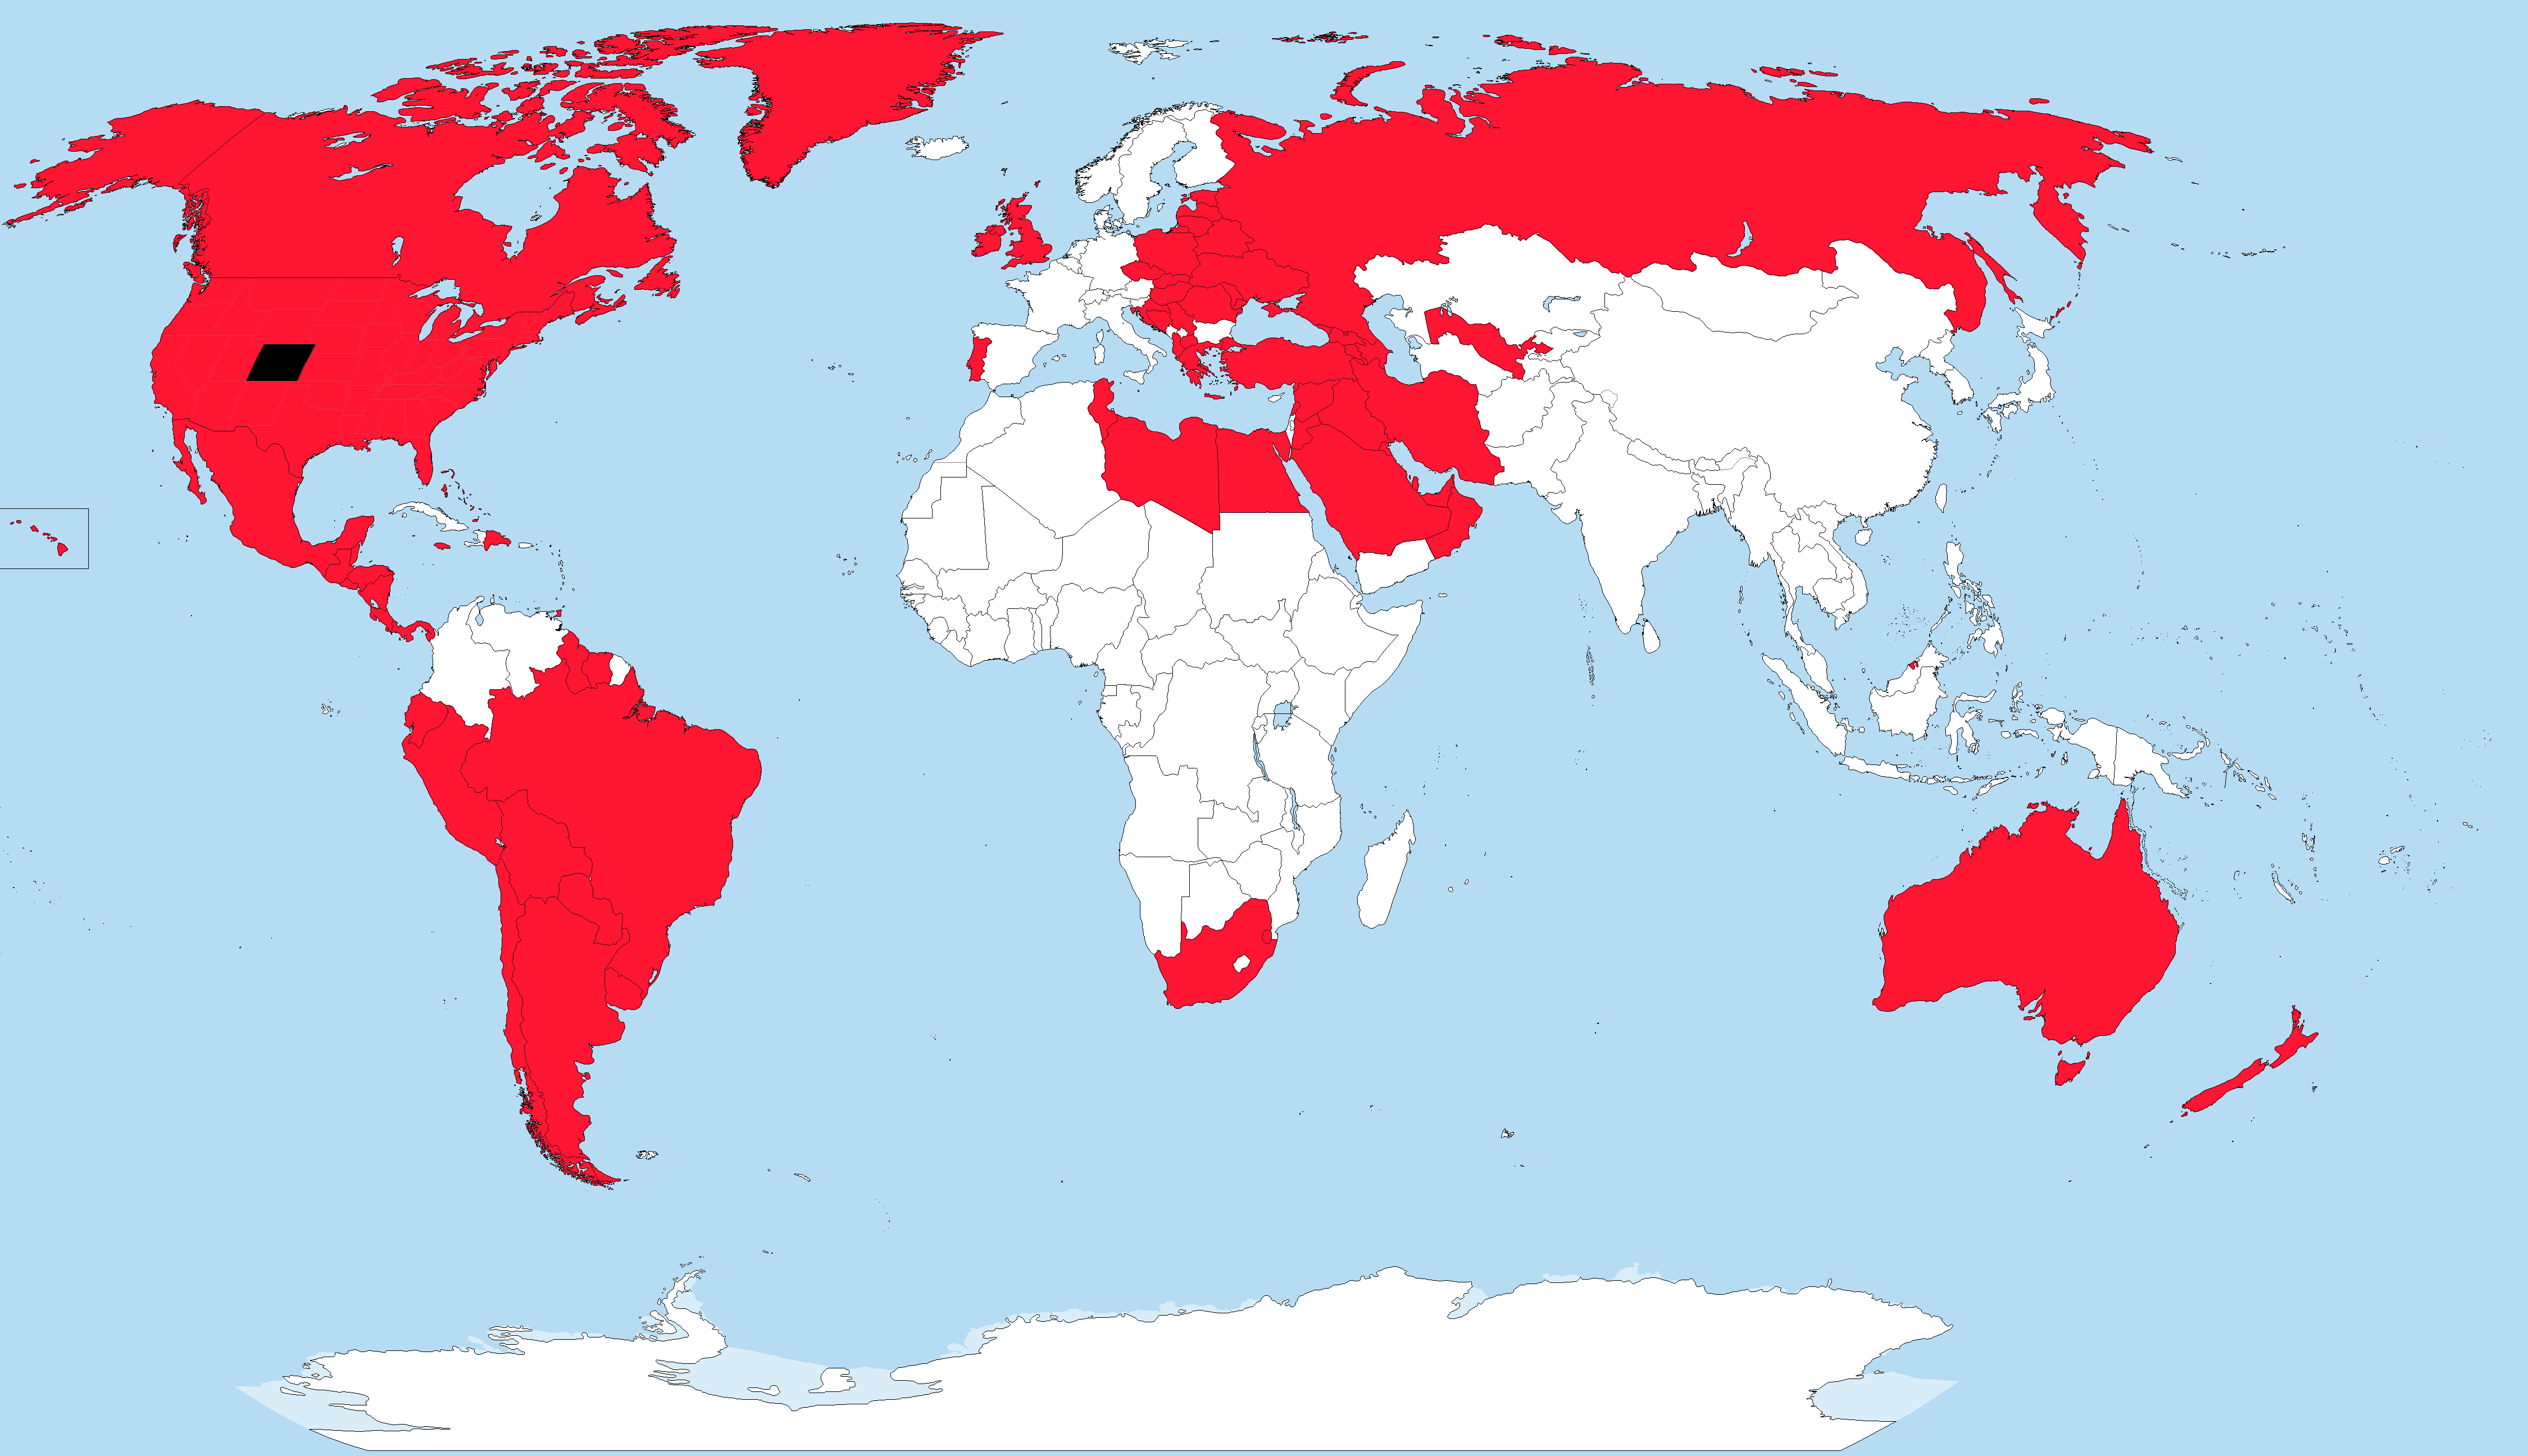
Obesity Rates Compared to Colorado Map
The visualization illustrates the obesity rates across various countries and states, highlighting those with a higher pr...
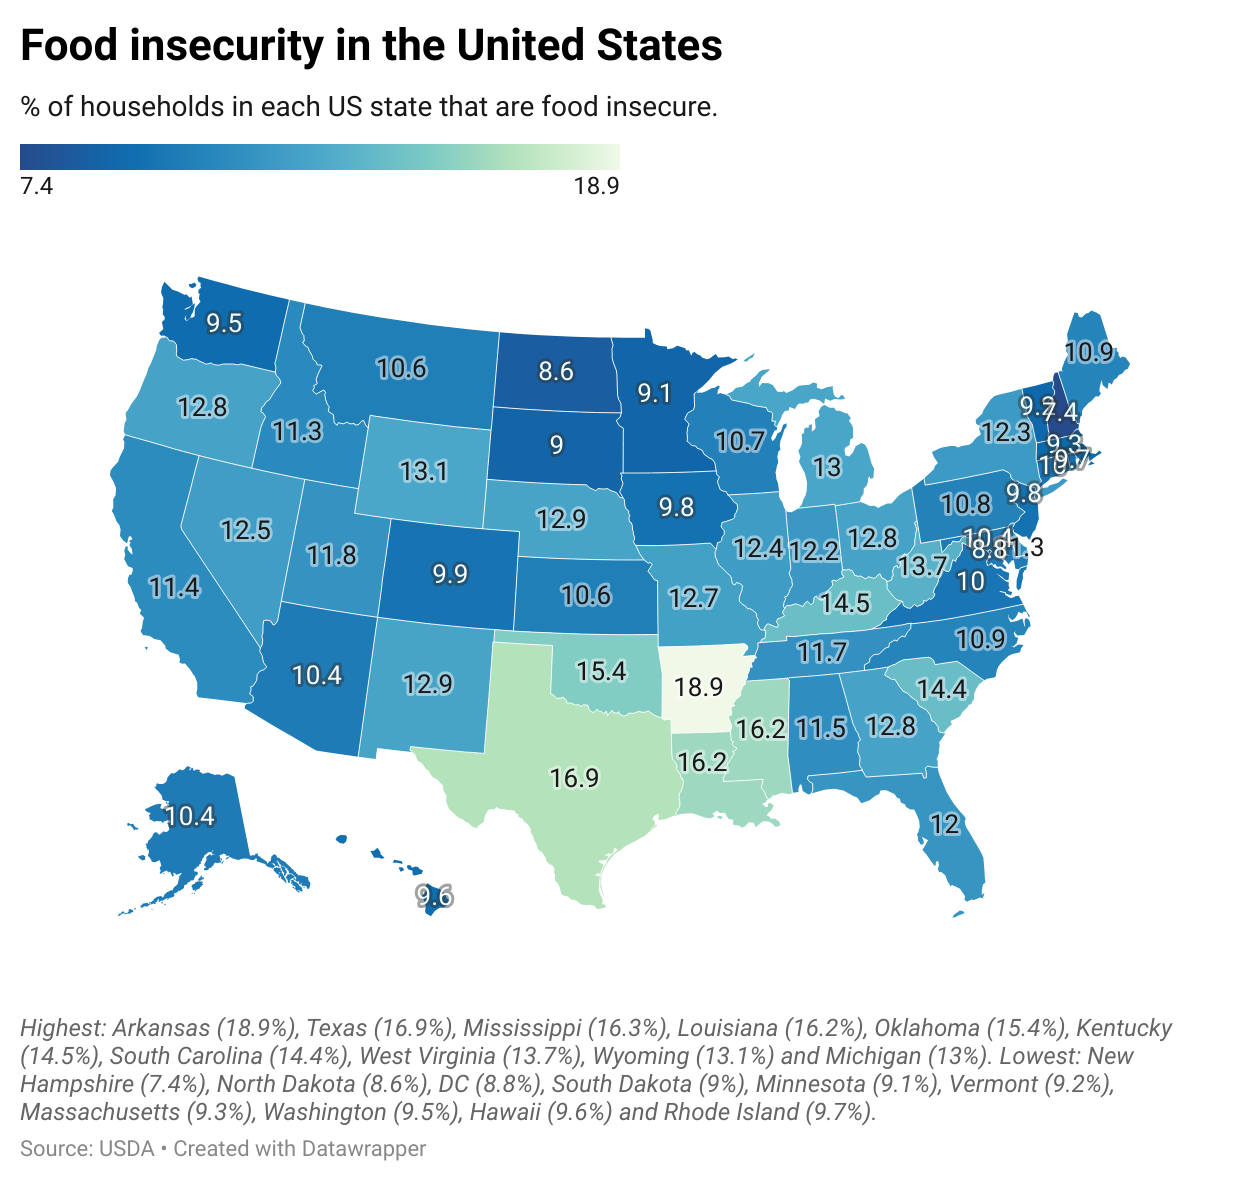
Food Insecurity in the United States Map
The "Food Insecurity in the United States Map" provides an intricate view of the varying levels of food insecurity acros...
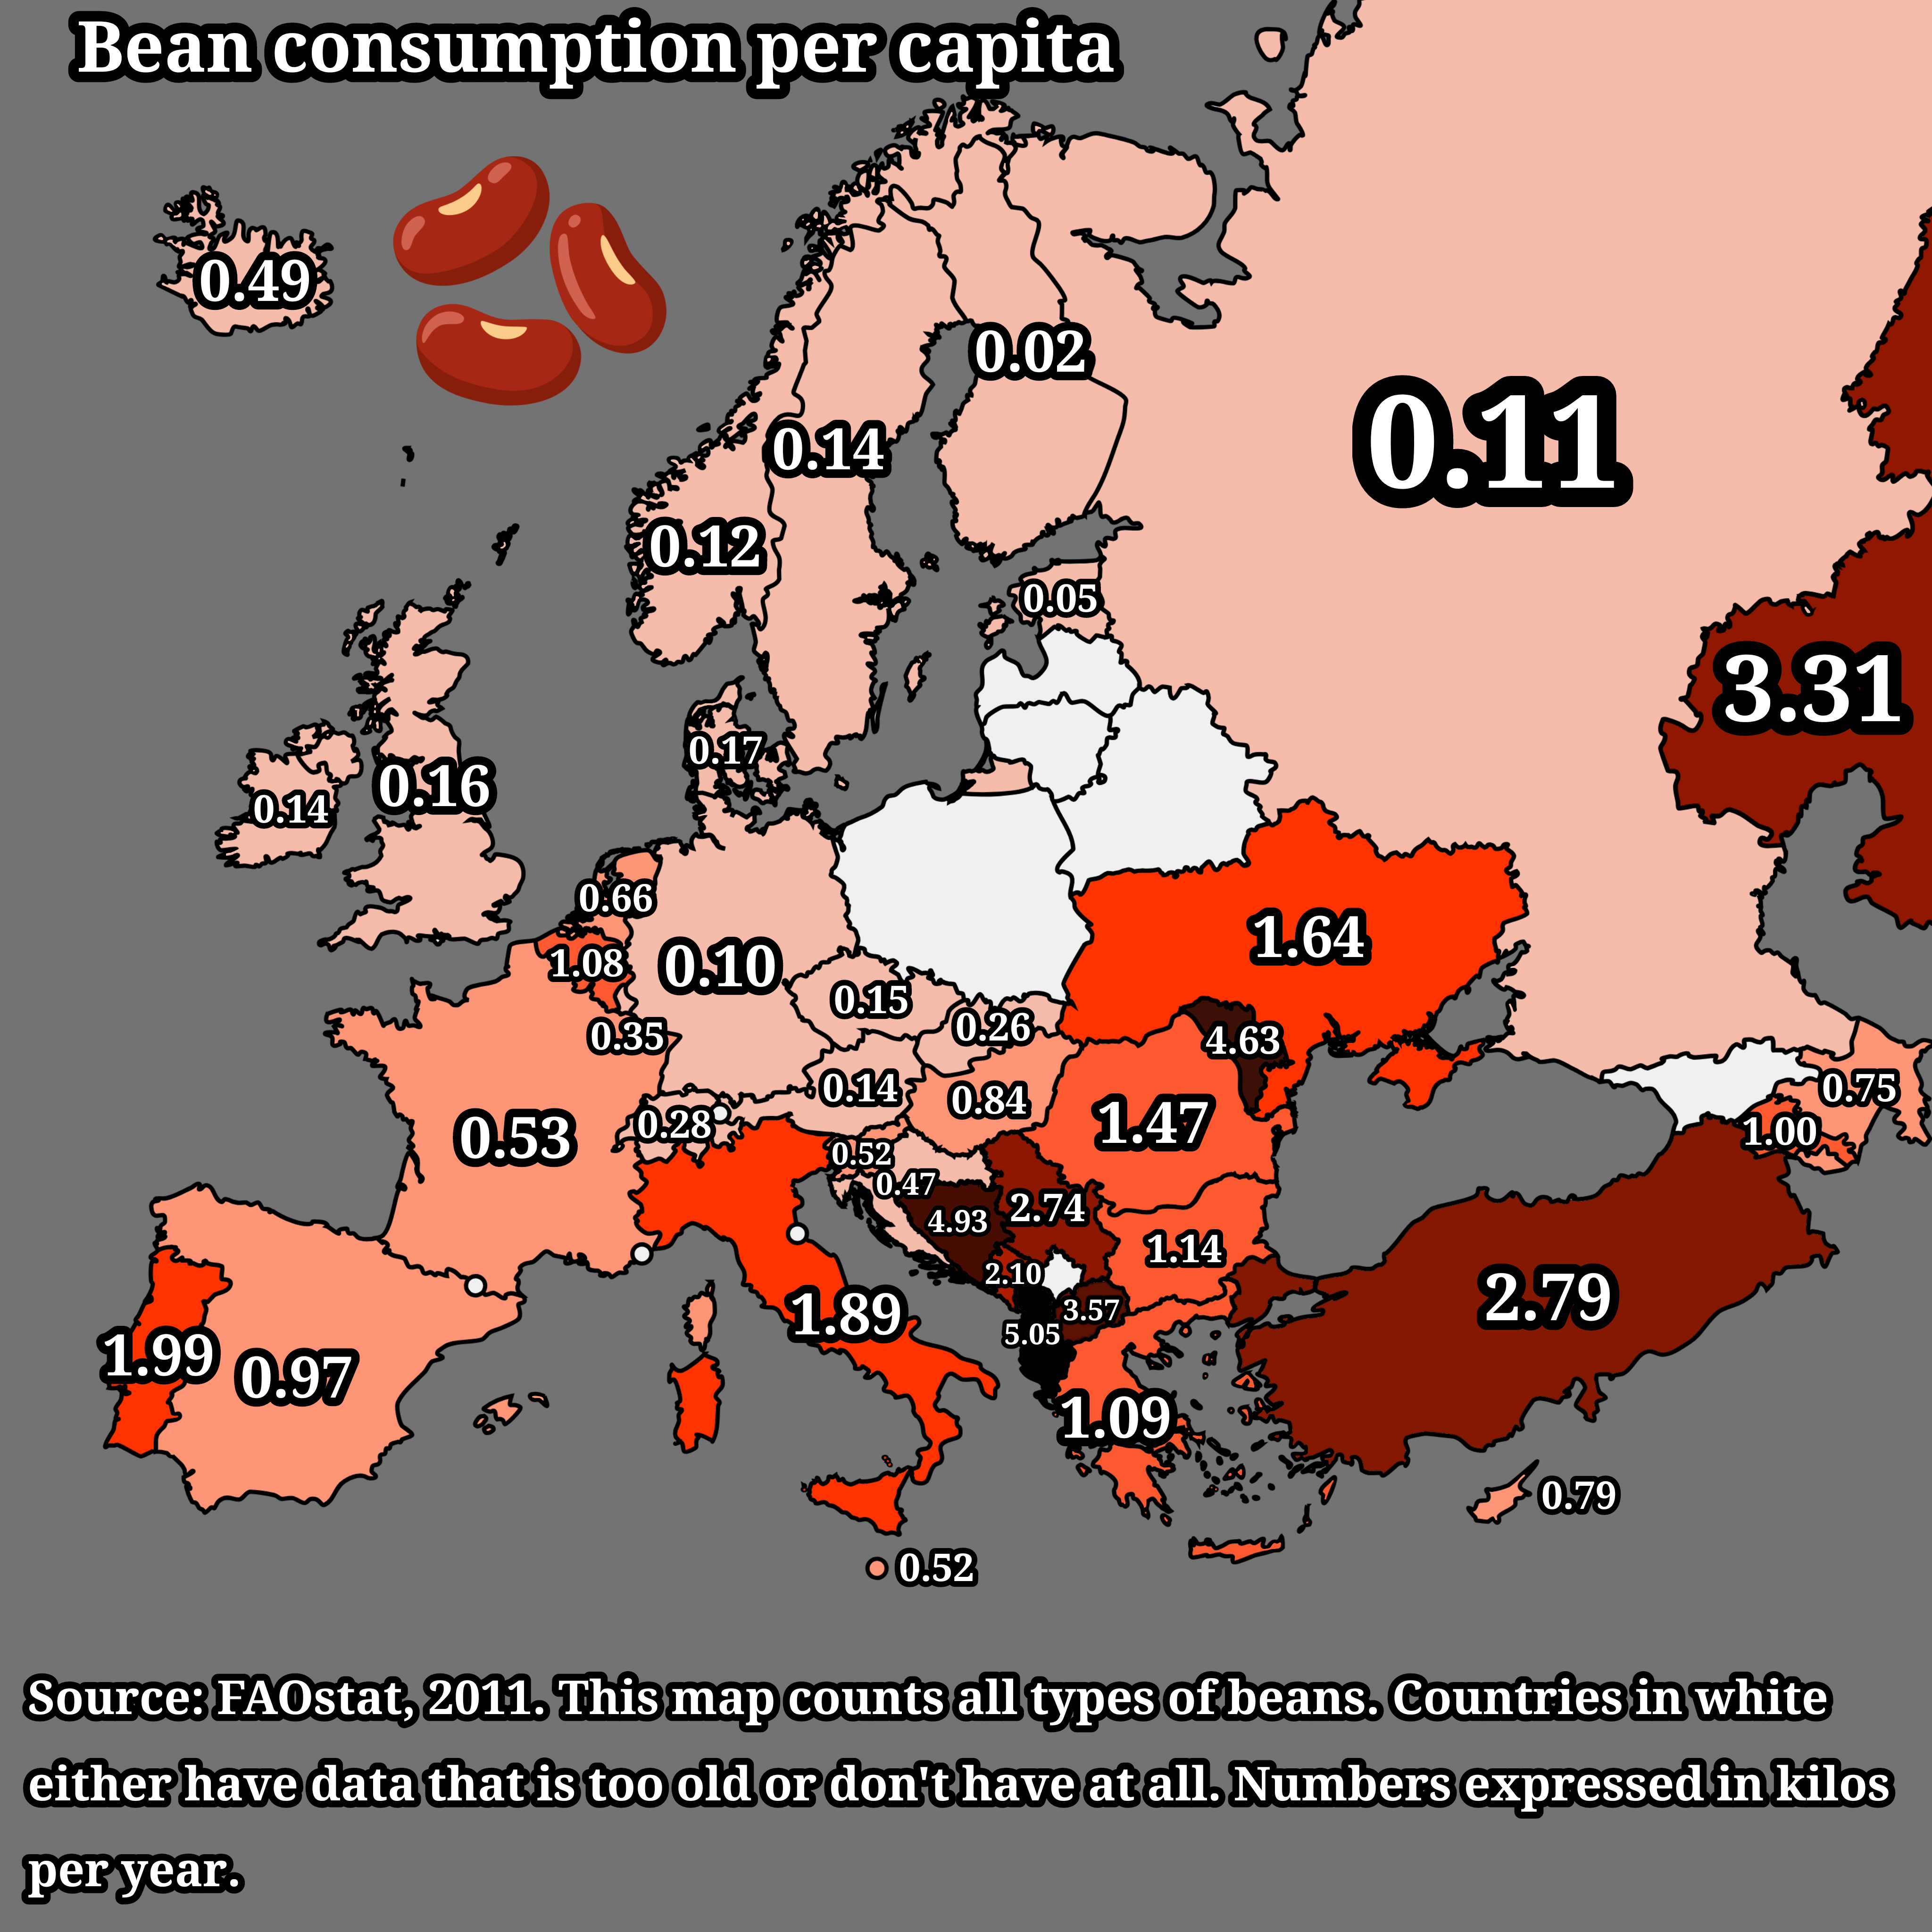
Bean Consumption Per Capita in Europe Map
The "Bean Consumption Per Capita in Europe Map" provides a detailed visualization of the average bean consumption across...
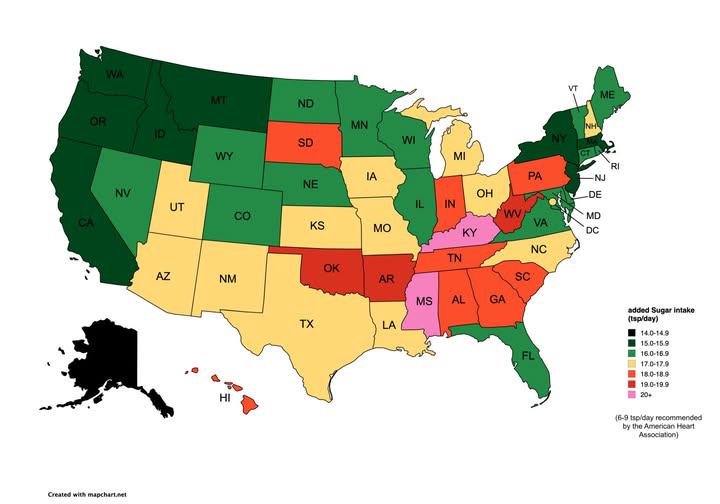
Map of Estimated Daily Sugar Intake By U.S. State
The "Map of Estimated Daily Sugar Intake By U.S. State" provides a visual representation of how much sugar the average p...
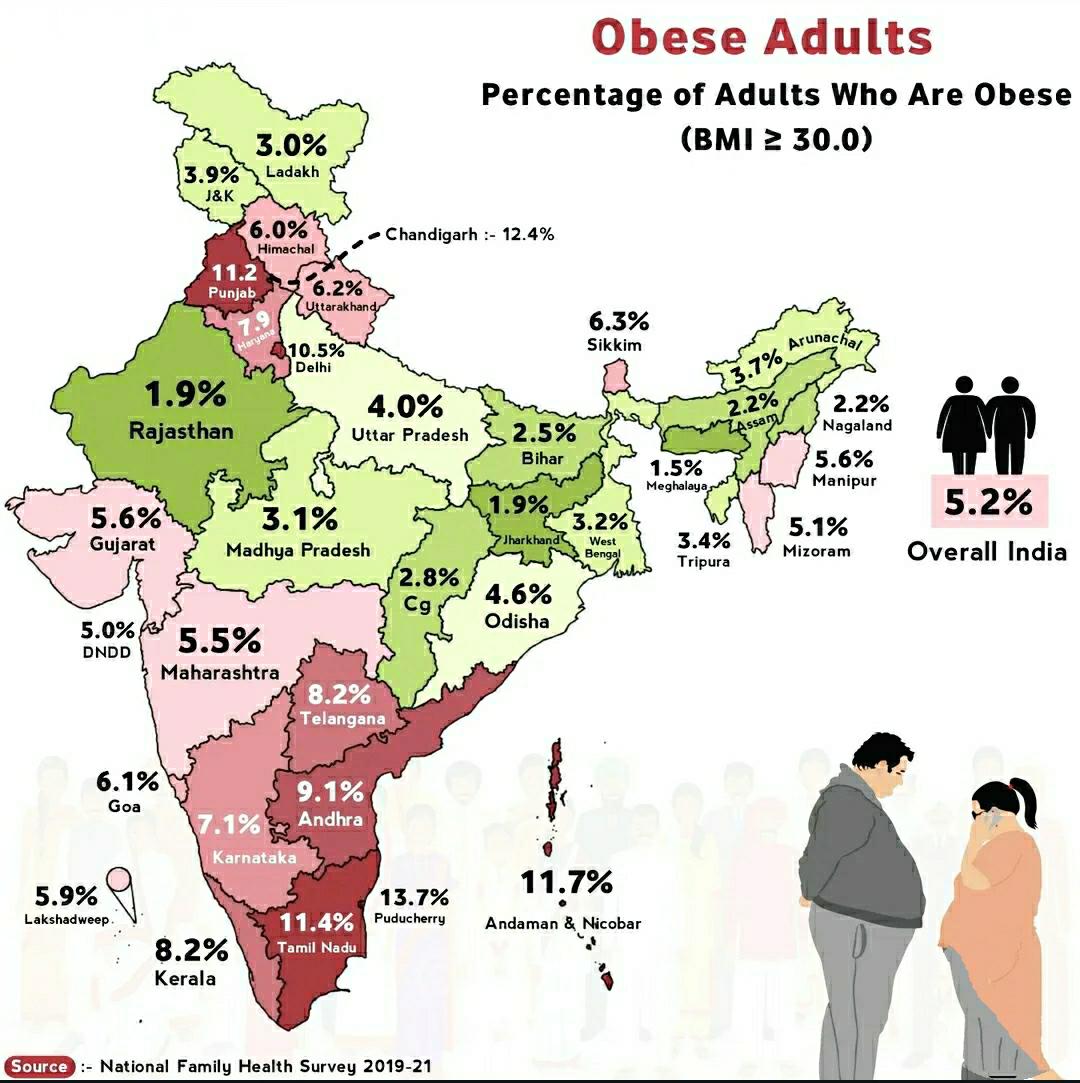
Obese Adults in India Map
The "Obese Adults in India Map" provides a visual representation of the prevalence of obesity among adults across variou...
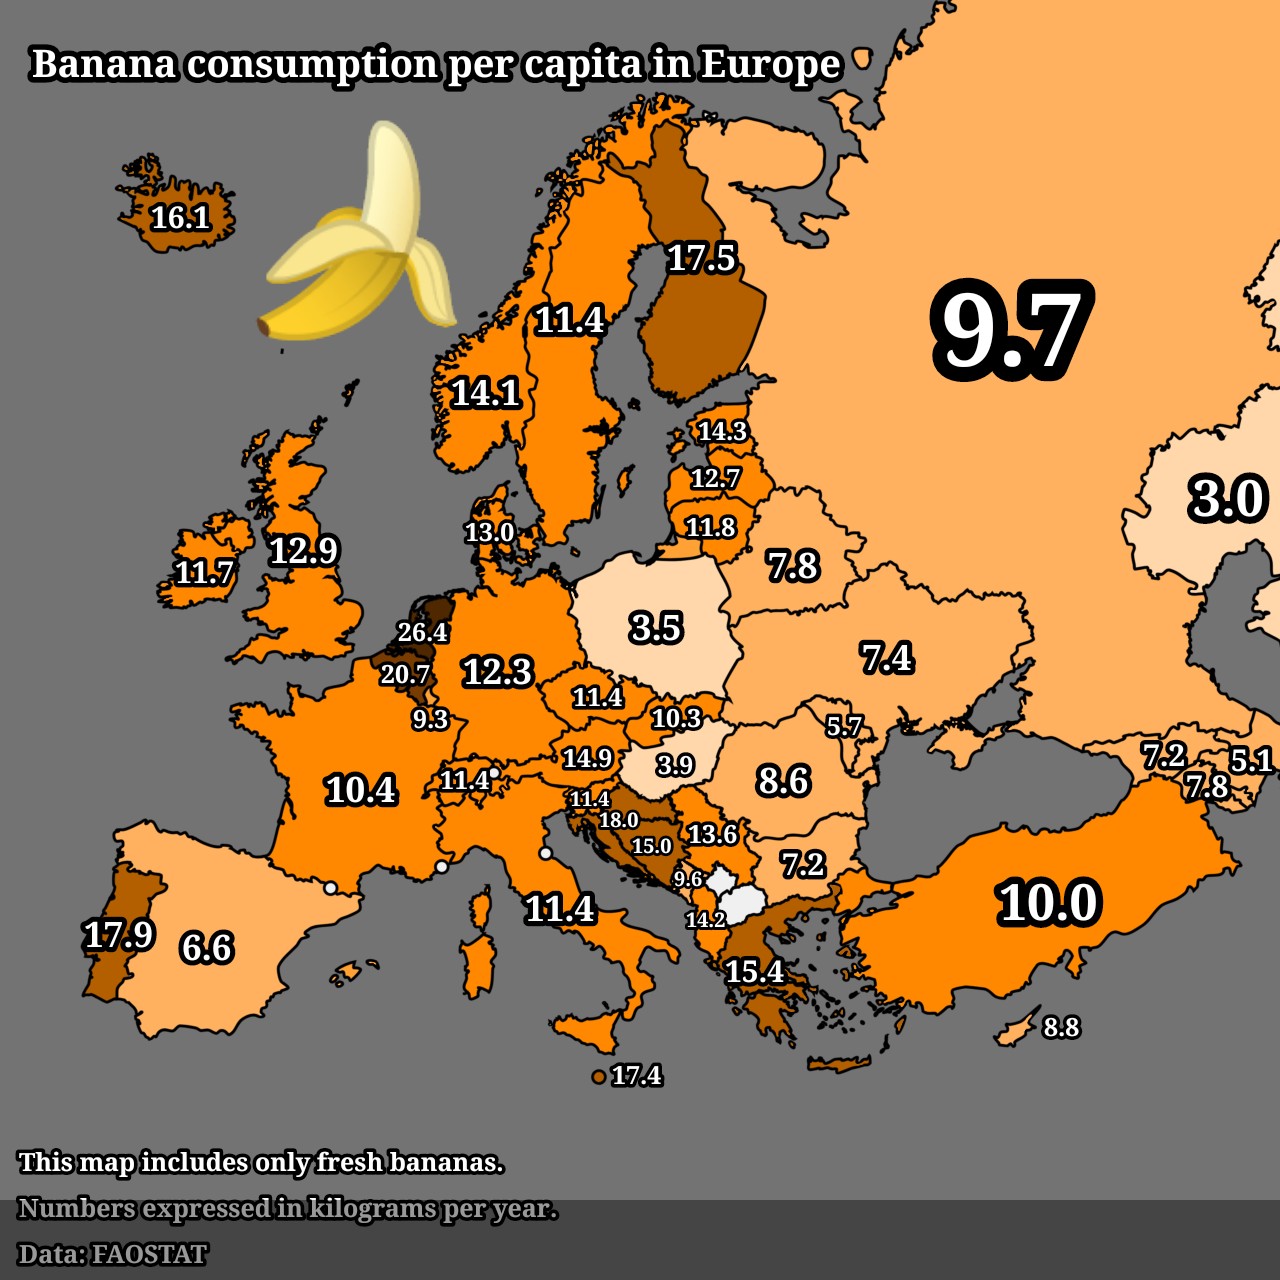
Banana Consumption Per Capita in Europe Map
The "Banana Consumption Per Capita in Europe" map provides a visual representation of the average banana consumption acr...
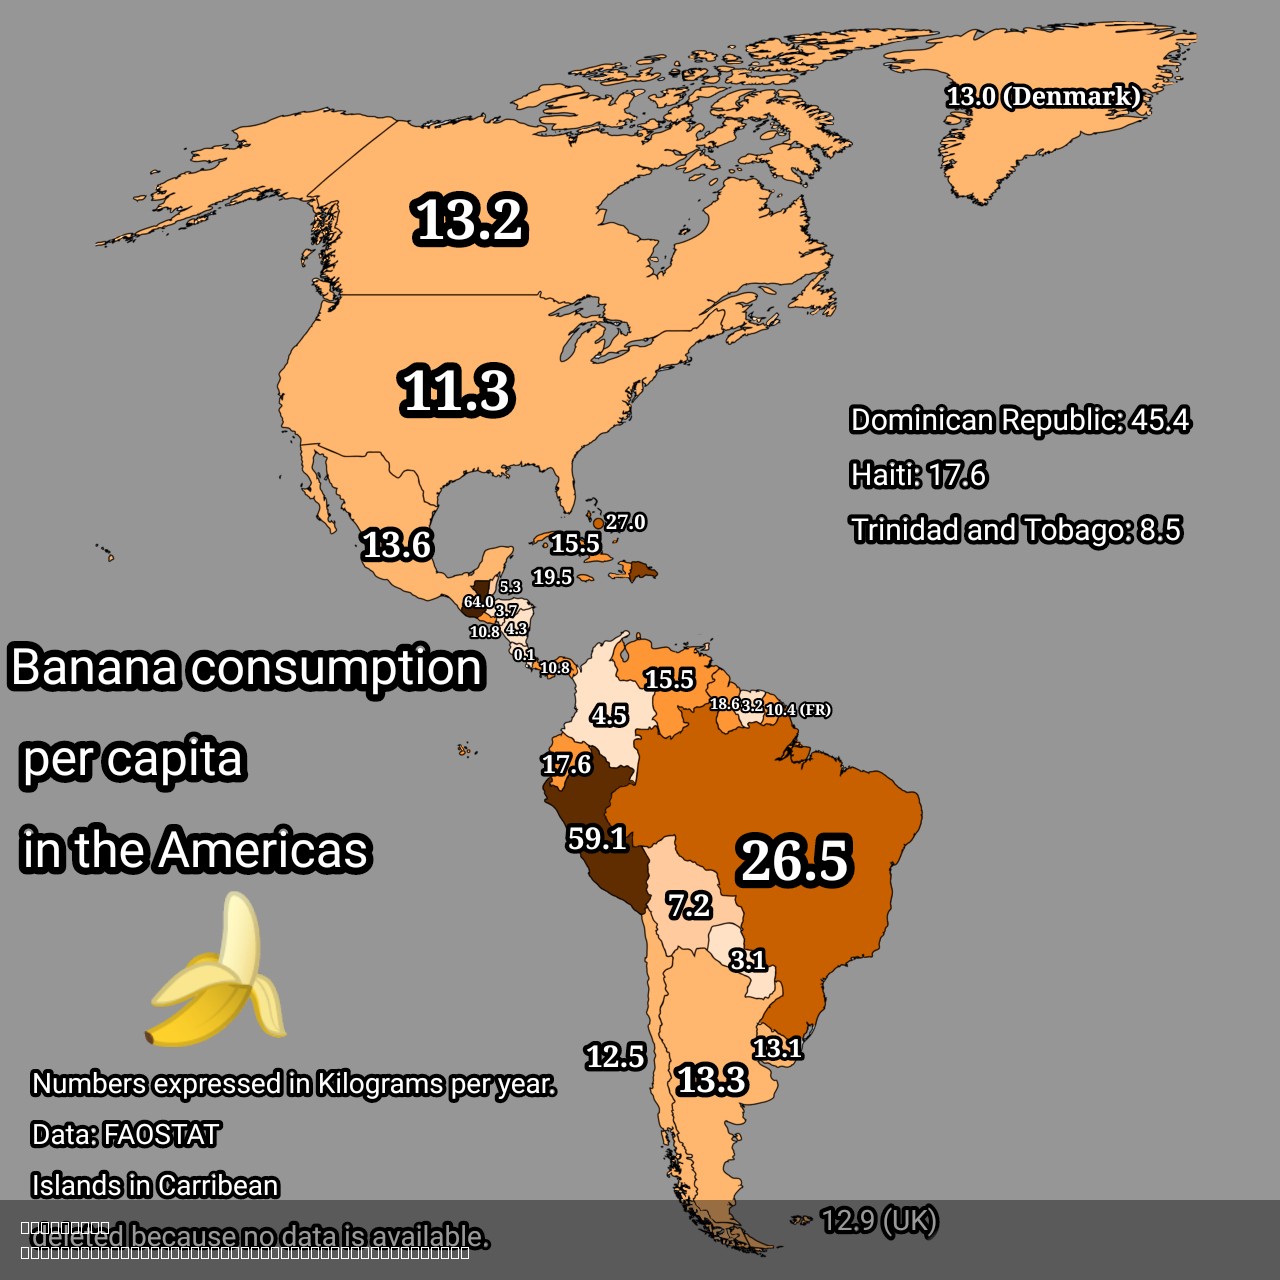
Banana Consumption Per Capita in the Americas Map
This map displays banana consumption per capita across various countries in the Americas, allowing us to visualize not o...
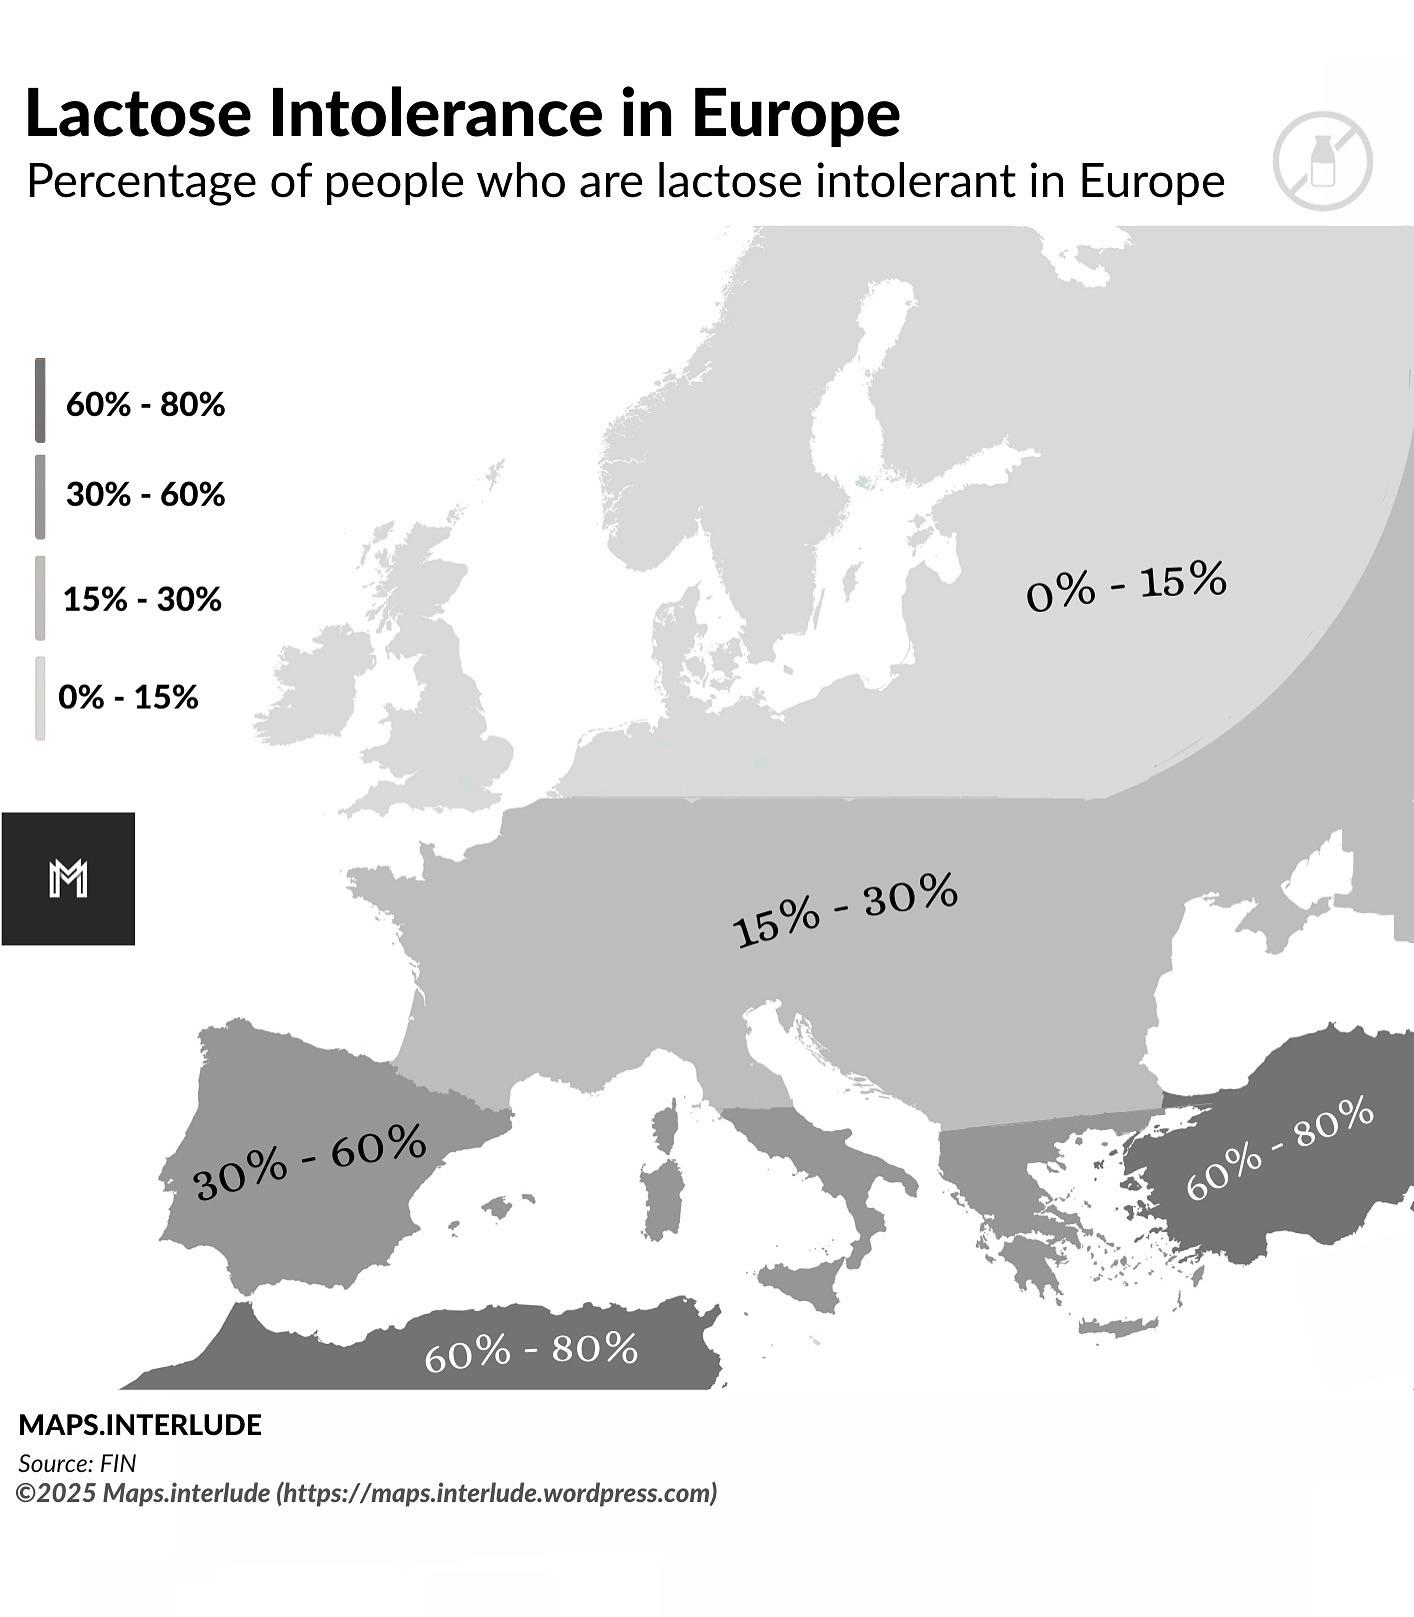
Lactose Intolerance in Europe Map
This visualization highlights the prevalence of lactose intolerance across various regions in Europe. It provides a clea...
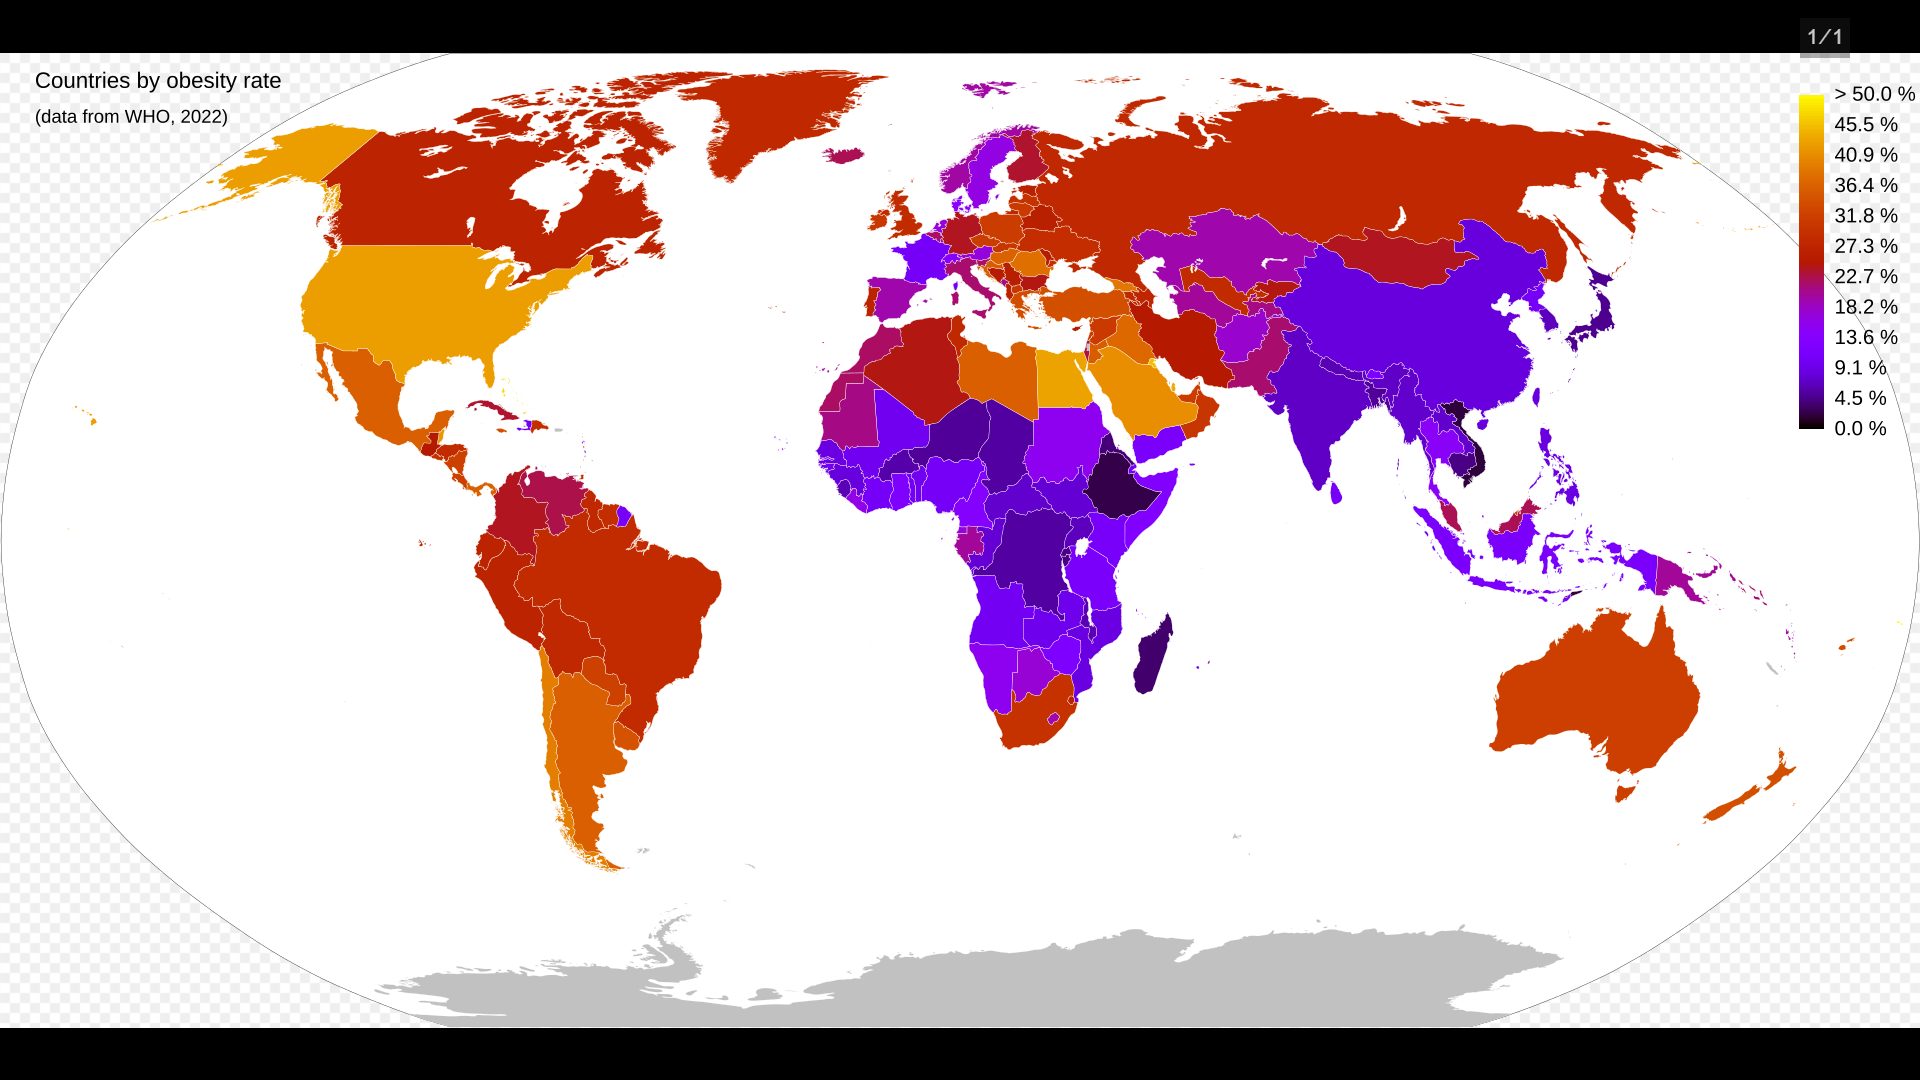
Obesity Rate by Country Map
The "Countries by Obesity Rate, WHO 2022" map provides a comprehensive overview of global obesity rates, highlighting th...