American Obesity Statistics Map

Alex Cartwright
Senior Cartographer & GIS Specialist
Alex Cartwright is a renowned cartographer and geographic information systems specialist with over 15 years of experience in spatial analysis and data...
Geographic Analysis
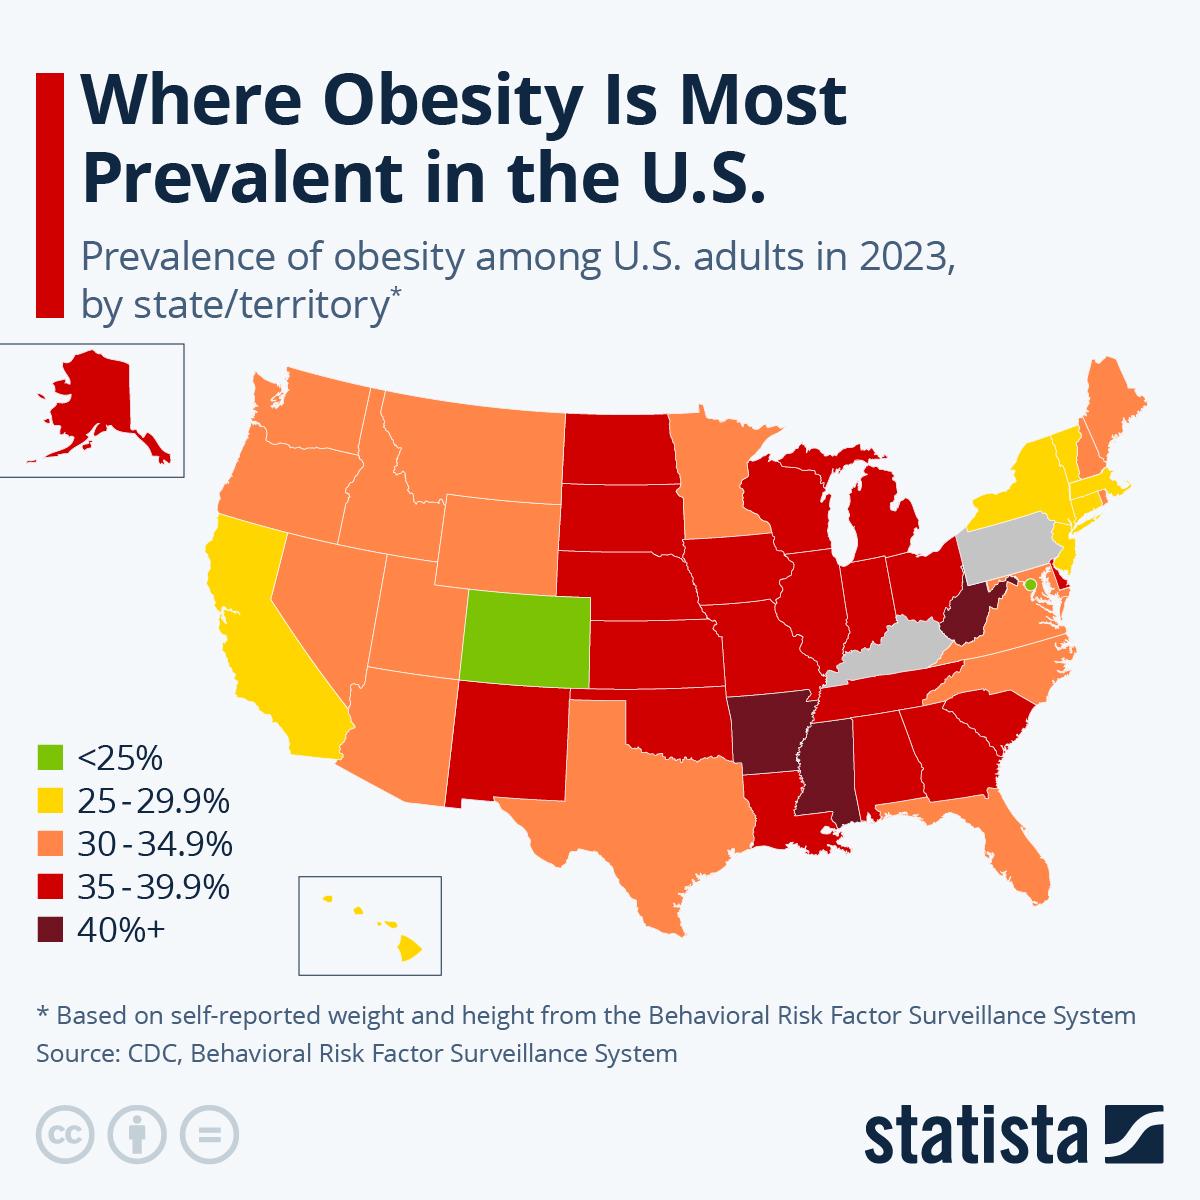
What This Map Shows
The American Obesity Statistics Map visually represents the prevalence of obesity across the United States. It highlights the percentage of adults classified as obese in various states, providing a clear picture of how weight issues are distributed nationwide. This map is crucial for understanding public health trends and regional health disparities, setting the stage for a deeper dive into obesity as a significant health concern.
Deep Dive into Obesity in America
Obesity is defined as having a body mass index (BMI) of 30 or higher. It is a complex condition influenced by a multitude of factors, including genetics, environment, and lifestyle choices. According to the Centers for Disease Control and Prevention (CDC), the prevalence of obesity in the U.S. has steadily increased over the past several decades. As of 2021, the CDC reported that approximately 42.4% of adults in the United States were classified as obese.
Interestingly, obesity is not just an issue of personal health; it is closely linked to various chronic diseases such as heart disease, diabetes, and certain cancers. Furthermore, it can significantly impact mental health, leading to issues like depression and anxiety. The map illustrates stark contrasts between states, revealing that obesity rates can be as high as 39.5% in places like Arkansas, while states like Colorado boast rates of just 27.1%. This disparity raises important questions about the underlying causes of obesity in different regions.
Several factors contribute to this obesity epidemic. Socioeconomic status plays a critical role; individuals with lower income levels often have limited access to healthy foods and safe environments for physical activity. Urban areas may offer more access to fresh produce, but they can also present food deserts where nutritious options are scarce. Additionally, cultural attitudes toward food and exercise vary widely, influencing dietary habits and lifestyle choices.
Moreover, what’s fascinating is how obesity intersects with race and ethnicity. Studies indicate that certain racial and ethnic groups, particularly African Americans and Hispanics, experience higher rates of obesity compared to their white counterparts. Understanding these disparities is crucial for developing targeted interventions and policies to combat obesity.
Regional Analysis
When examining the map closely, distinct regional trends emerge. The Southern states, often referred to as the "Stroke Belt," display the highest obesity rates. For instance, Arkansas, Louisiana, and Mississippi all rank among the top states for obesity prevalence. This trend can be attributed to a combination of factors such as high rates of poverty, cultural dietary preferences (like fried foods and sugary beverages), and limited access to healthcare.
In contrast, states in the West, such as California and Colorado, tend to have lower obesity rates. These areas often promote healthier lifestyles, with more emphasis on outdoor activities and access to fresh, healthy foods. Interestingly, California has implemented various public health initiatives aimed at reducing obesity, such as increasing access to parks and promoting nutrition education.
The Midwest presents a mixed picture. States like Minnesota and Iowa report lower obesity rates, likely due to their agricultural economy, which provides easier access to fresh produce. However, neighboring states such as Indiana and Ohio exhibit higher rates, which might be influenced by industrial food systems and lifestyle choices.
Significance and Impact
The implications of the obesity epidemic extend beyond individual health. Economically, obesity-related health issues lead to significant healthcare costs, estimated to be over $147 billion annually in the U.S. Furthermore, the workforce productivity can be affected, resulting in lost economic output. Communities grappling with high obesity rates also face increased healthcare burdens, which can strain local resources.
Addressing obesity is crucial for improving overall public health, but it requires a multifaceted approach. Initiatives aimed at increasing physical activity, improving access to healthy foods, and educating the public about nutrition are essential. Moreover, as we look to the future, trends indicate that without significant intervention, obesity rates may continue to rise, further exacerbating health disparities and economic challenges.
In conclusion, the American Obesity Statistics Map serves as a vital tool for understanding the complexities of obesity across the nation. By examining the underlying factors and regional variations, we can better appreciate the importance of addressing this pressing public health issue. Have you noticed how community resources, like parks and farmers' markets, can influence healthy living? The fight against obesity may very well start at the local level, making community engagement essential for lasting change.
Visualization Details
- Published
- August 22, 2025
- Views
- 90
Comments
Loading comments...