public health Maps
82 geographic visualizations tagged with "public health"
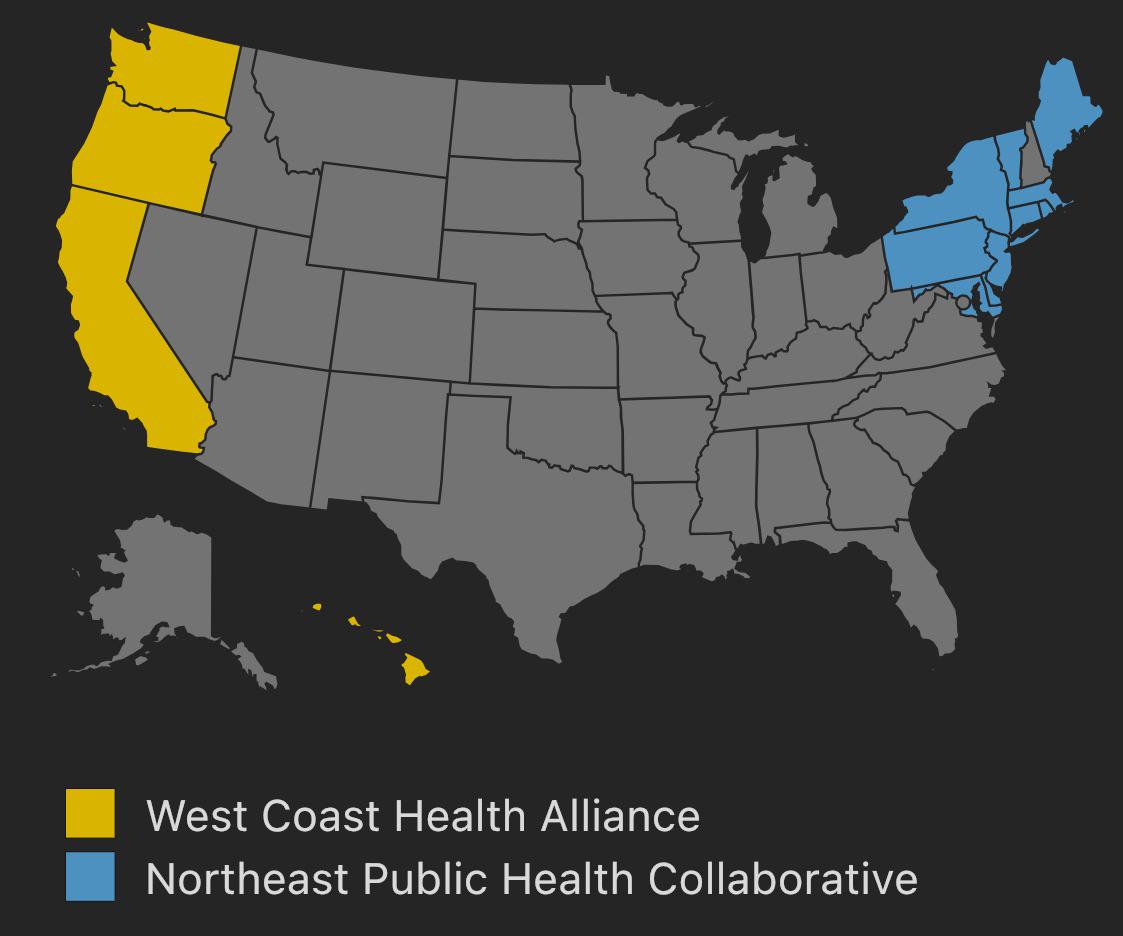
State Alliances Map for Independent Vaccine Mandates
The visualization titled \...
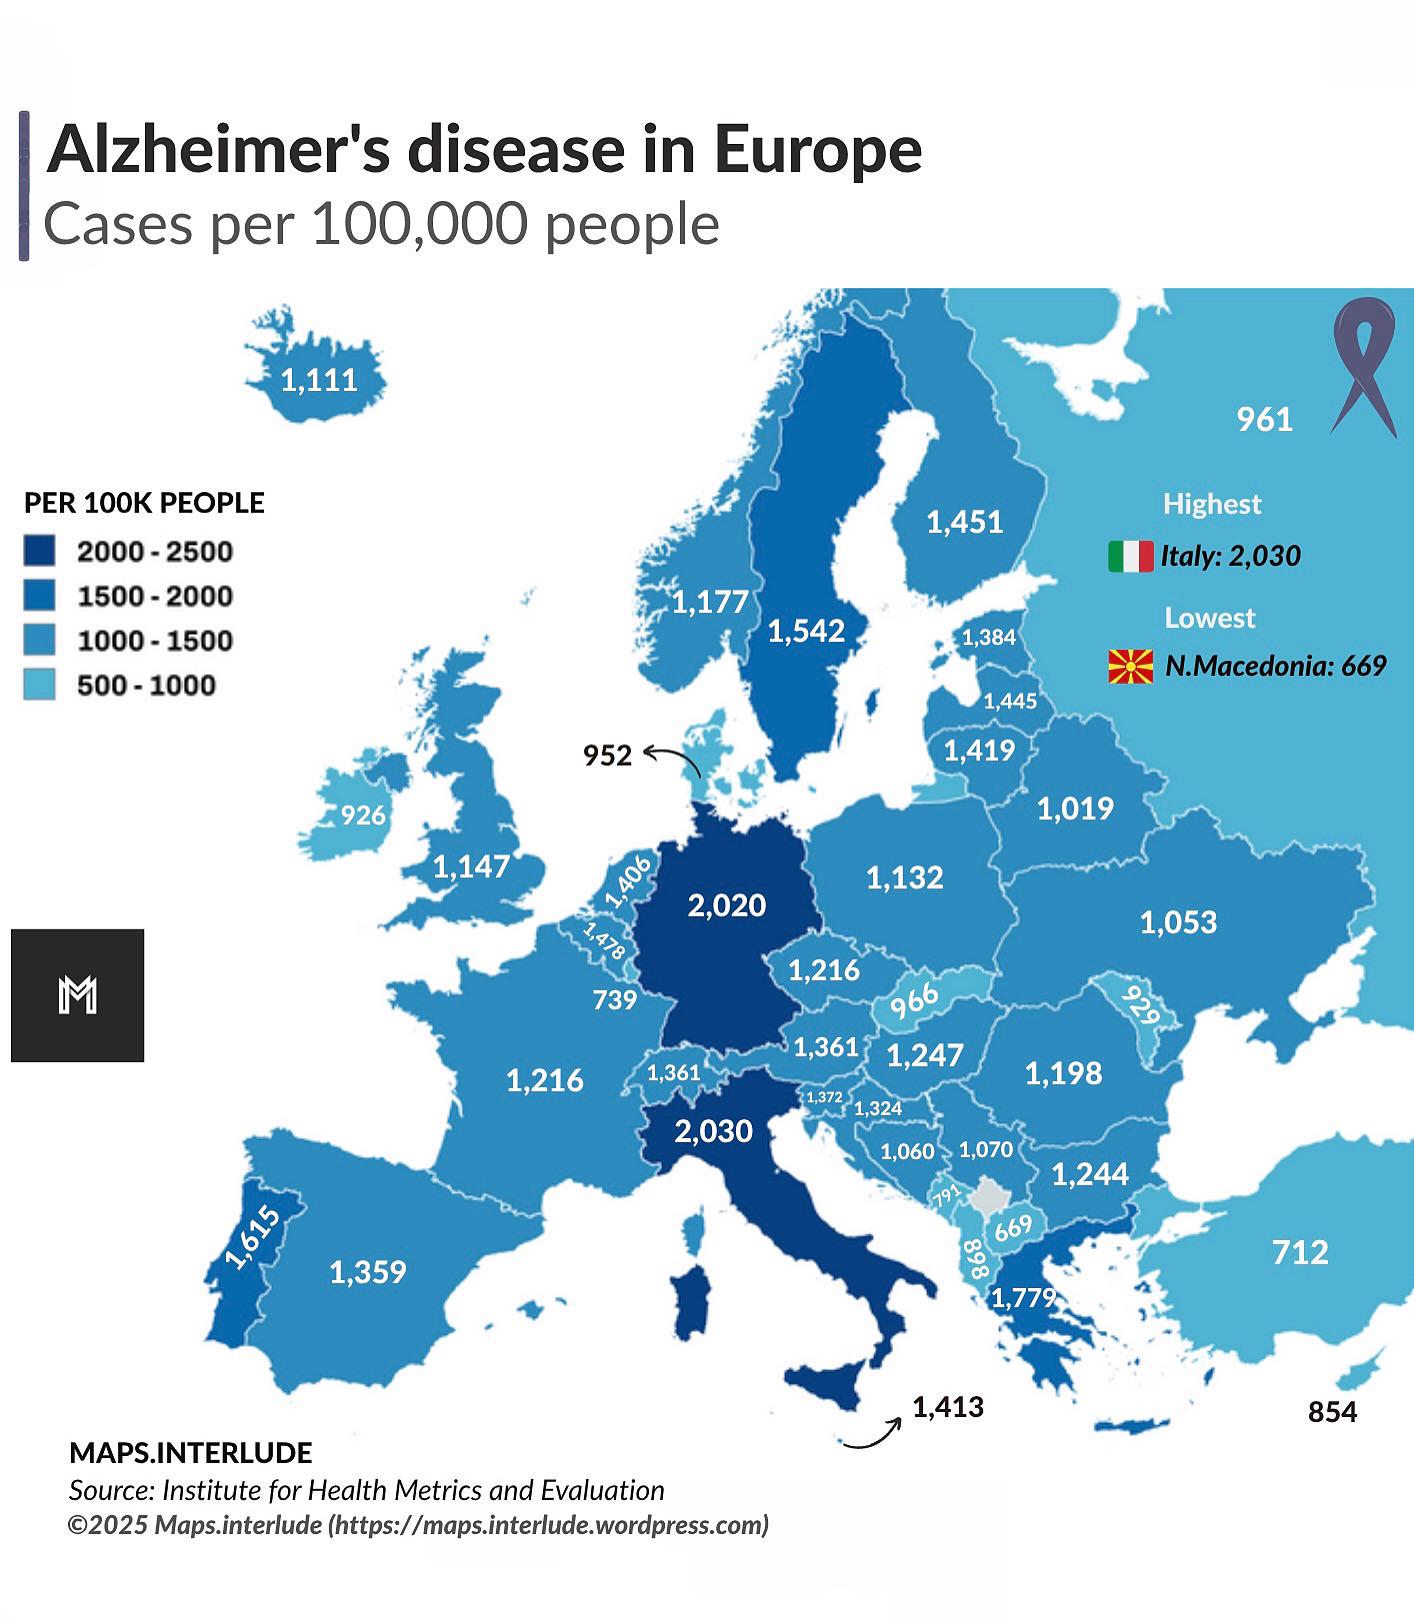
Alzheimer’s Disease Prevalence Map in Europe
The "Alzheimer’s Disease Prevalence Map in Europe" provides a visual representation of the distribution of Alzheimer’s d...

Cancer Rates Worldwide Map
The "Cancer Rates Worldwide" map provides a comprehensive overview of cancer prevalence and mortality across different r...
Life Expectancy in Europe Map
The "Life Expectancy in Europe Map" offers a visual representation of how life expectancy has evolved across different c...
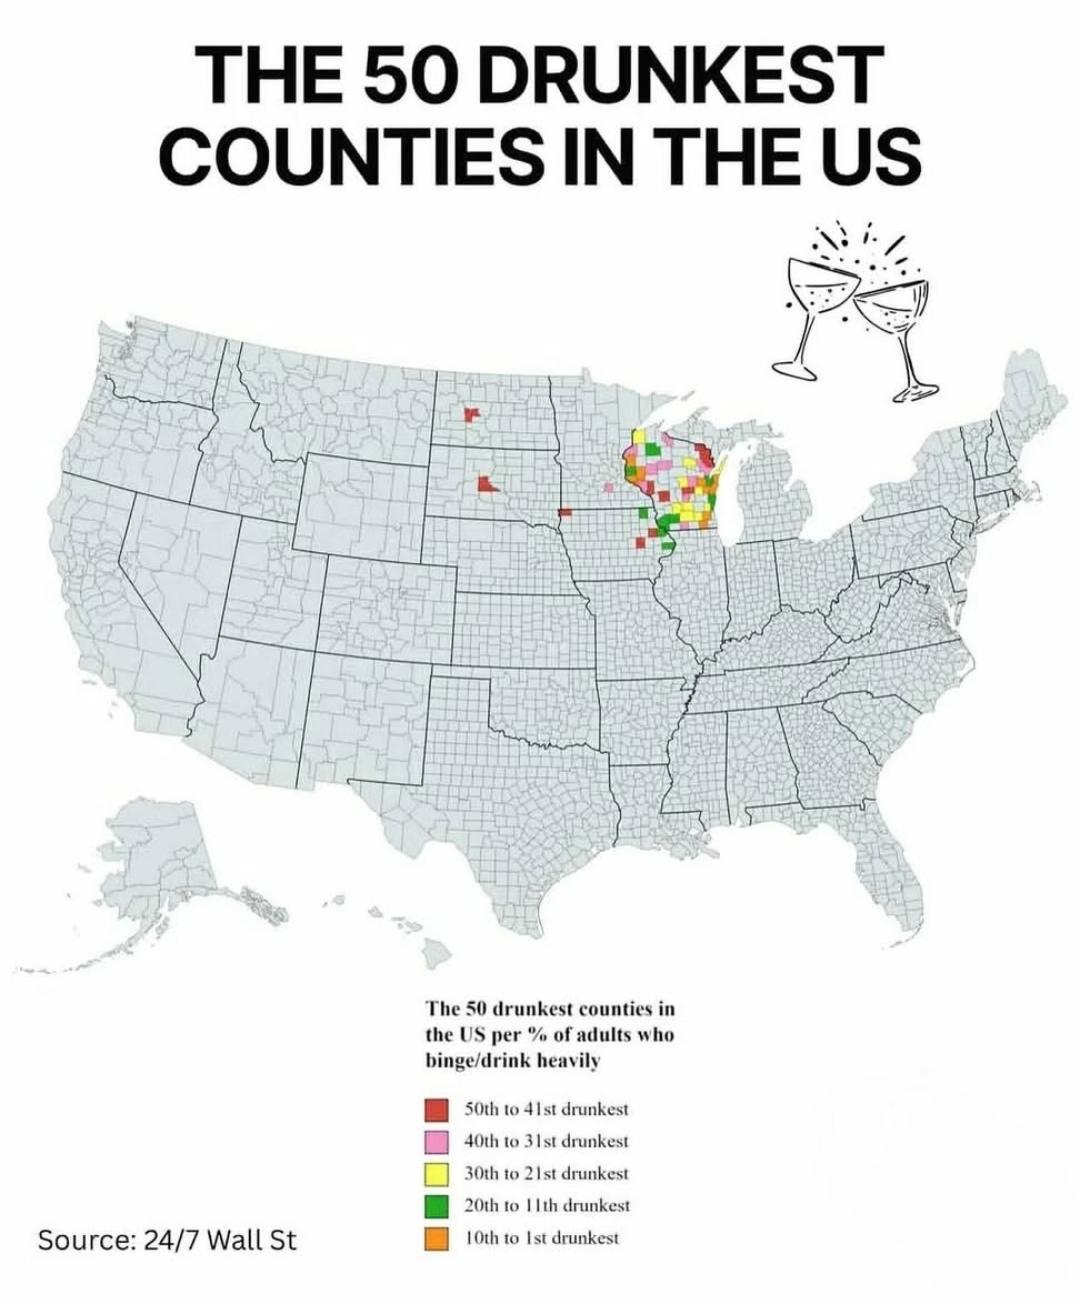
Map of the 50 Drunkest Counties in the US
The "50 Drunkest Counties in the US" map presents a detailed visualization of alcohol consumption patterns across variou...
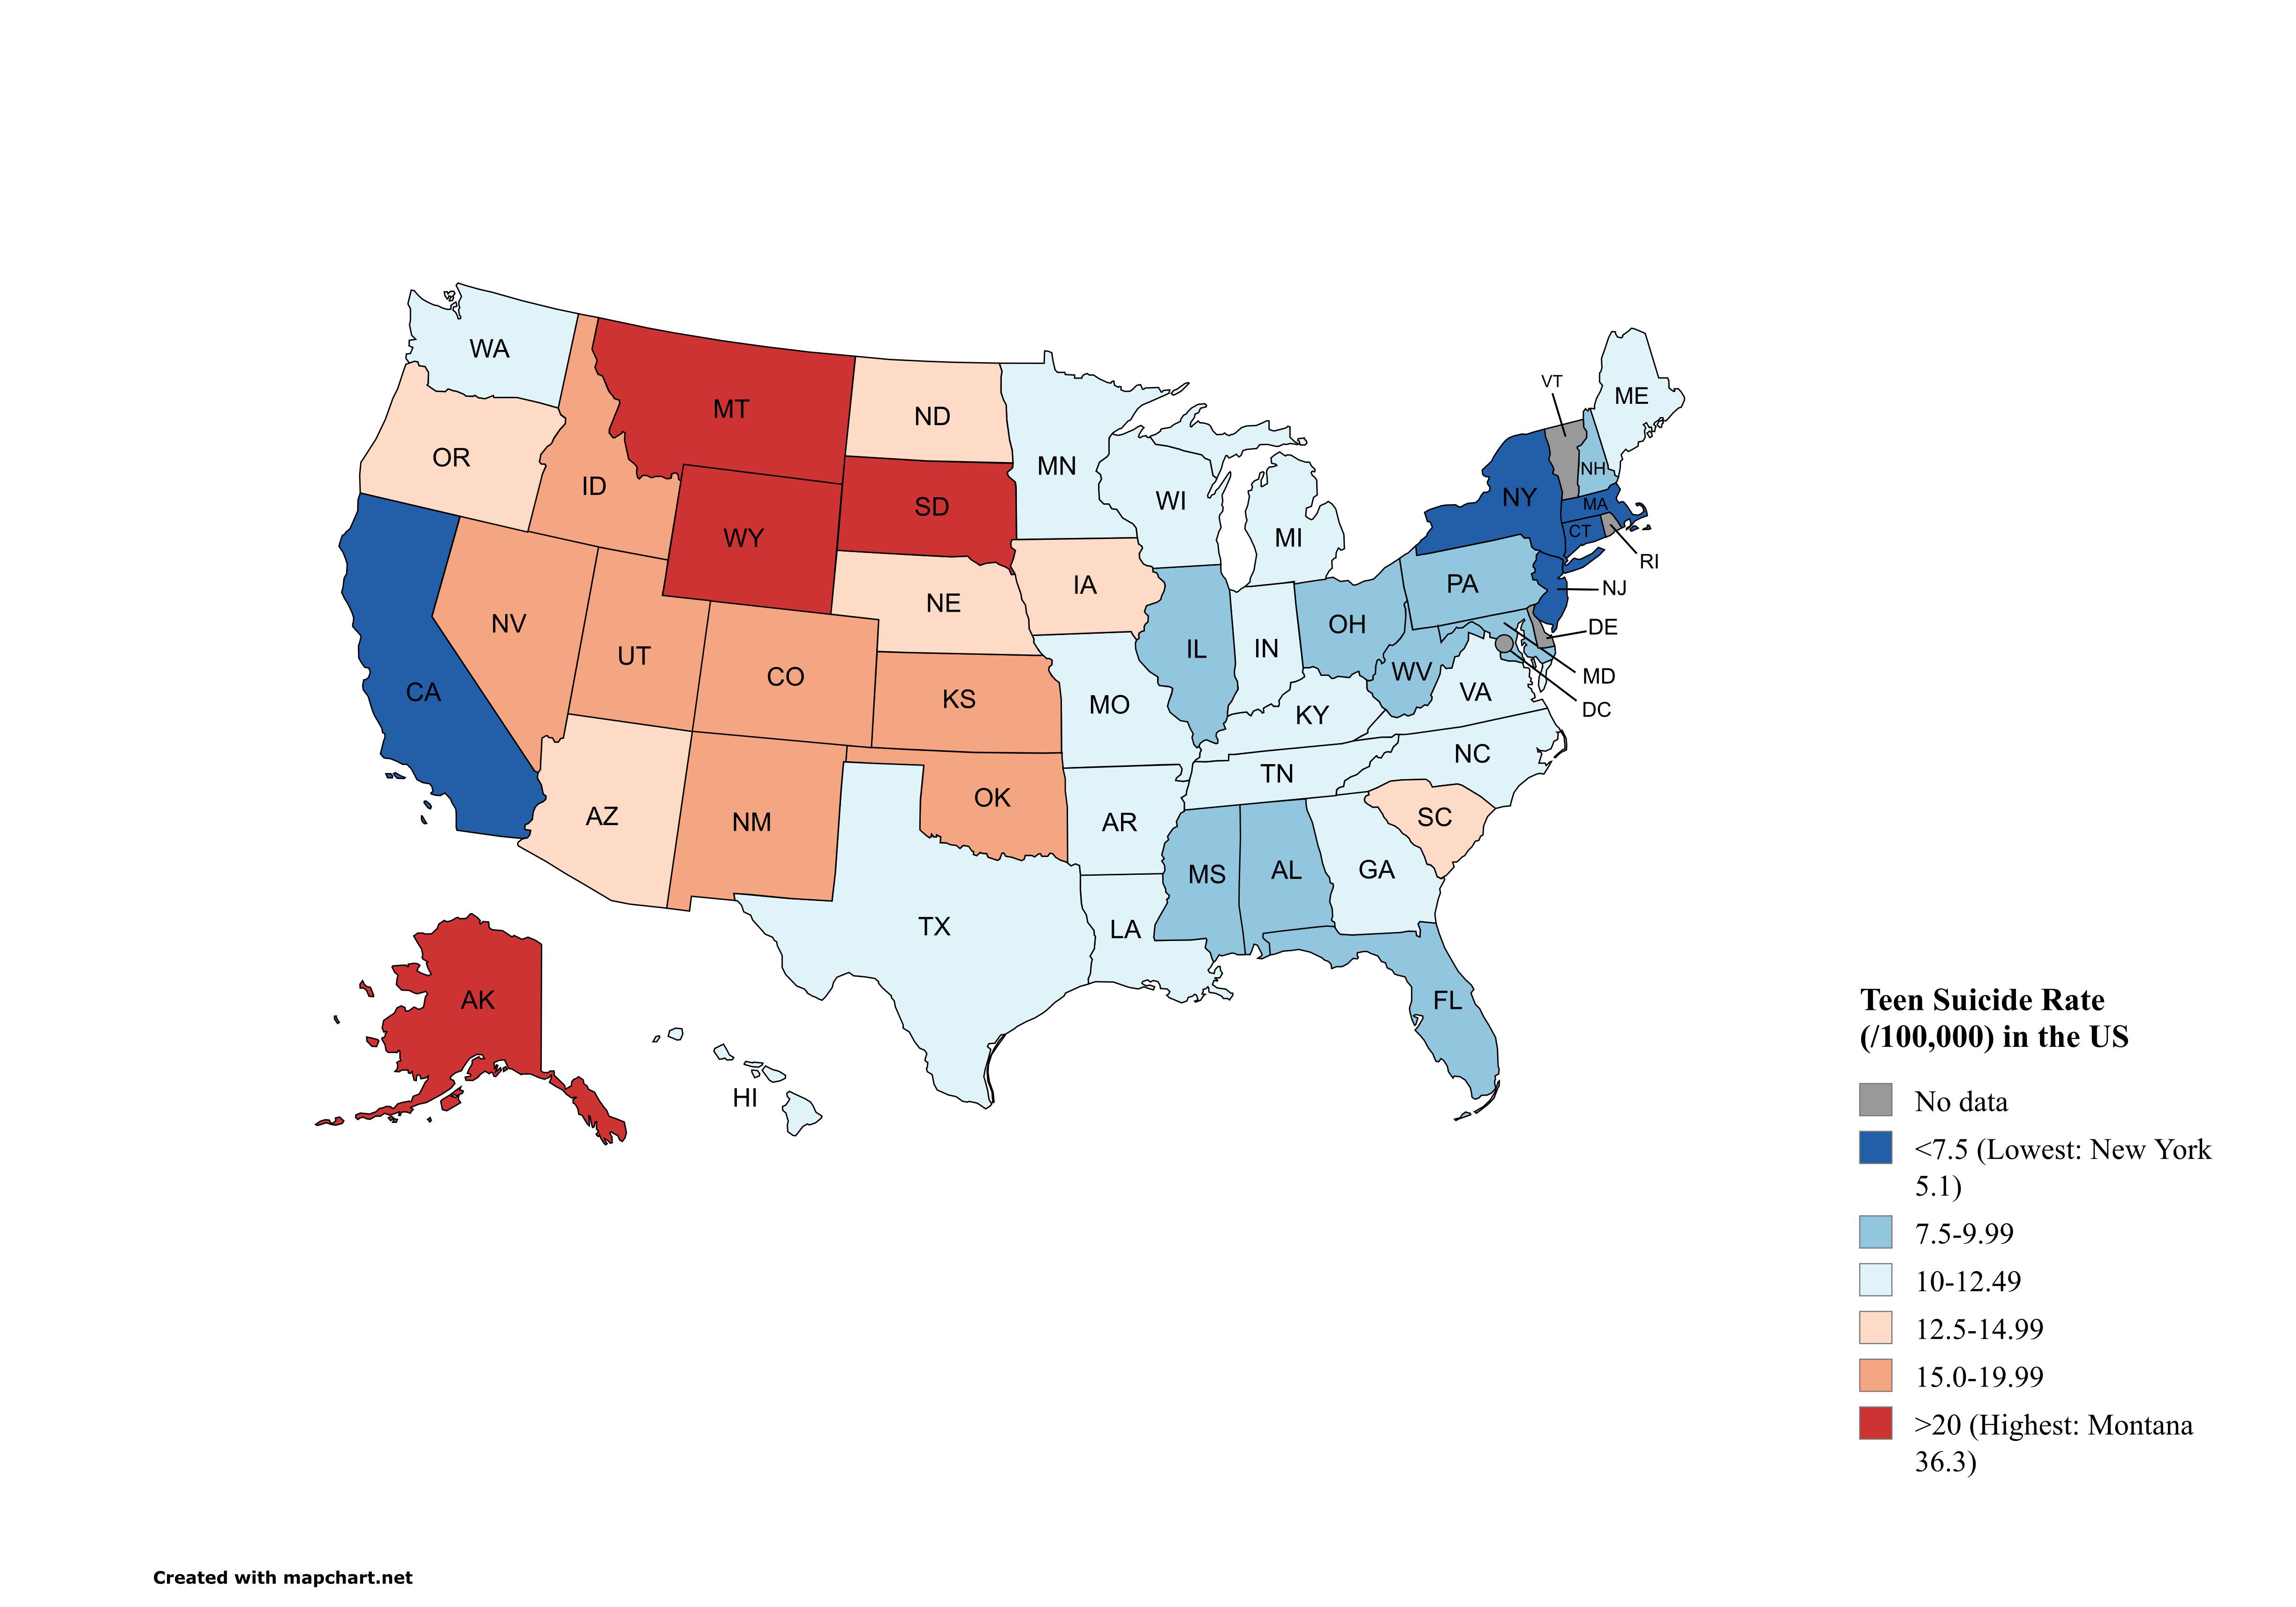
Teen Suicide Rates by State Map (2020-2022)
The map titled "U.S. States by Teen Suicide Rates (aged 15-19) from 2020-2022" presents a stark visualization of the ado...
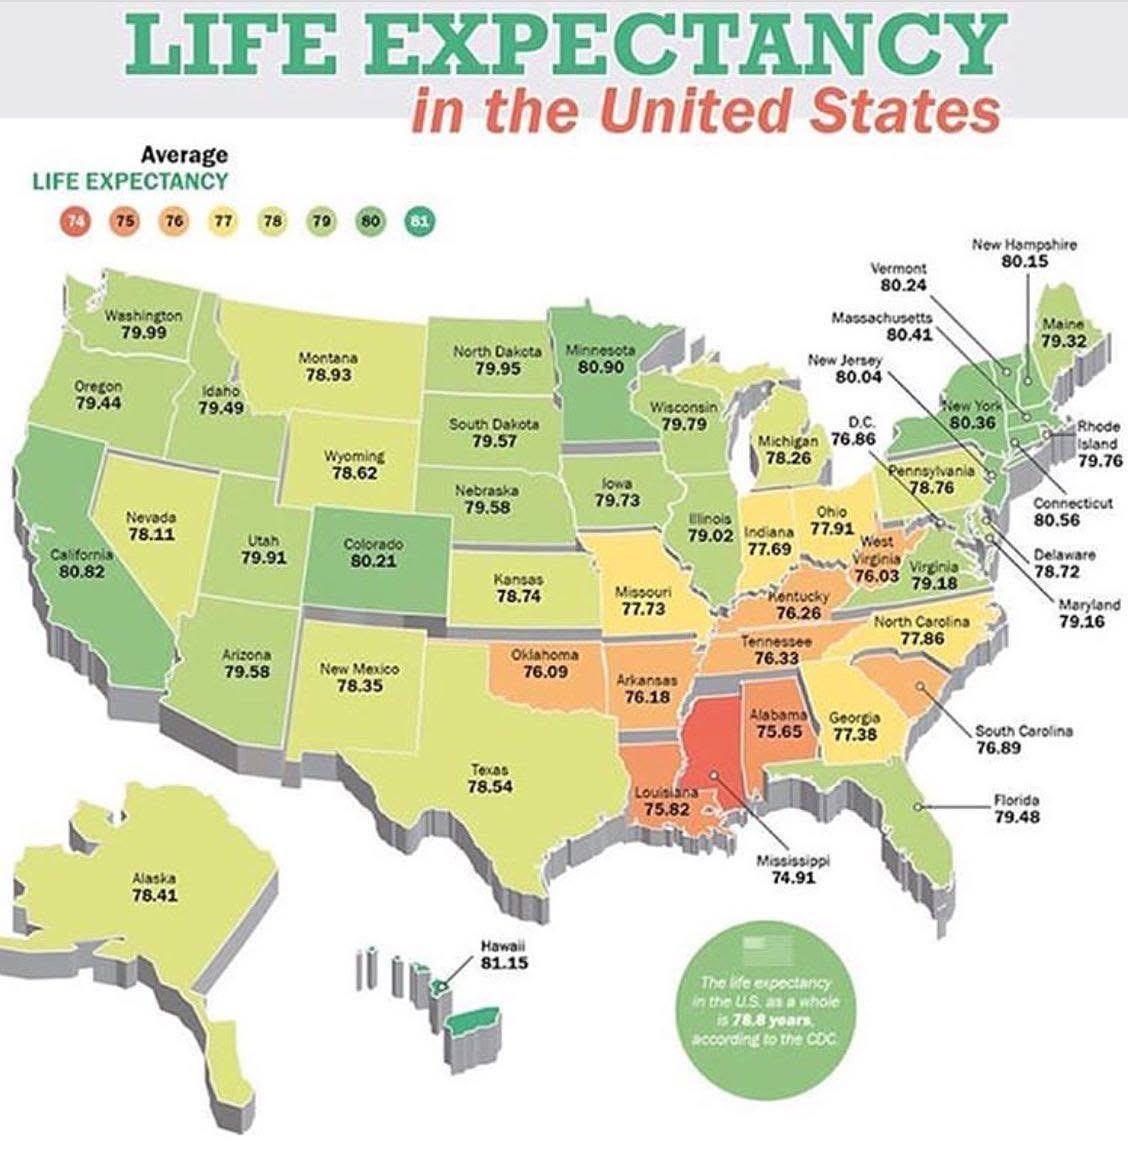
Life Expectancy by State in the USA Map
The \...
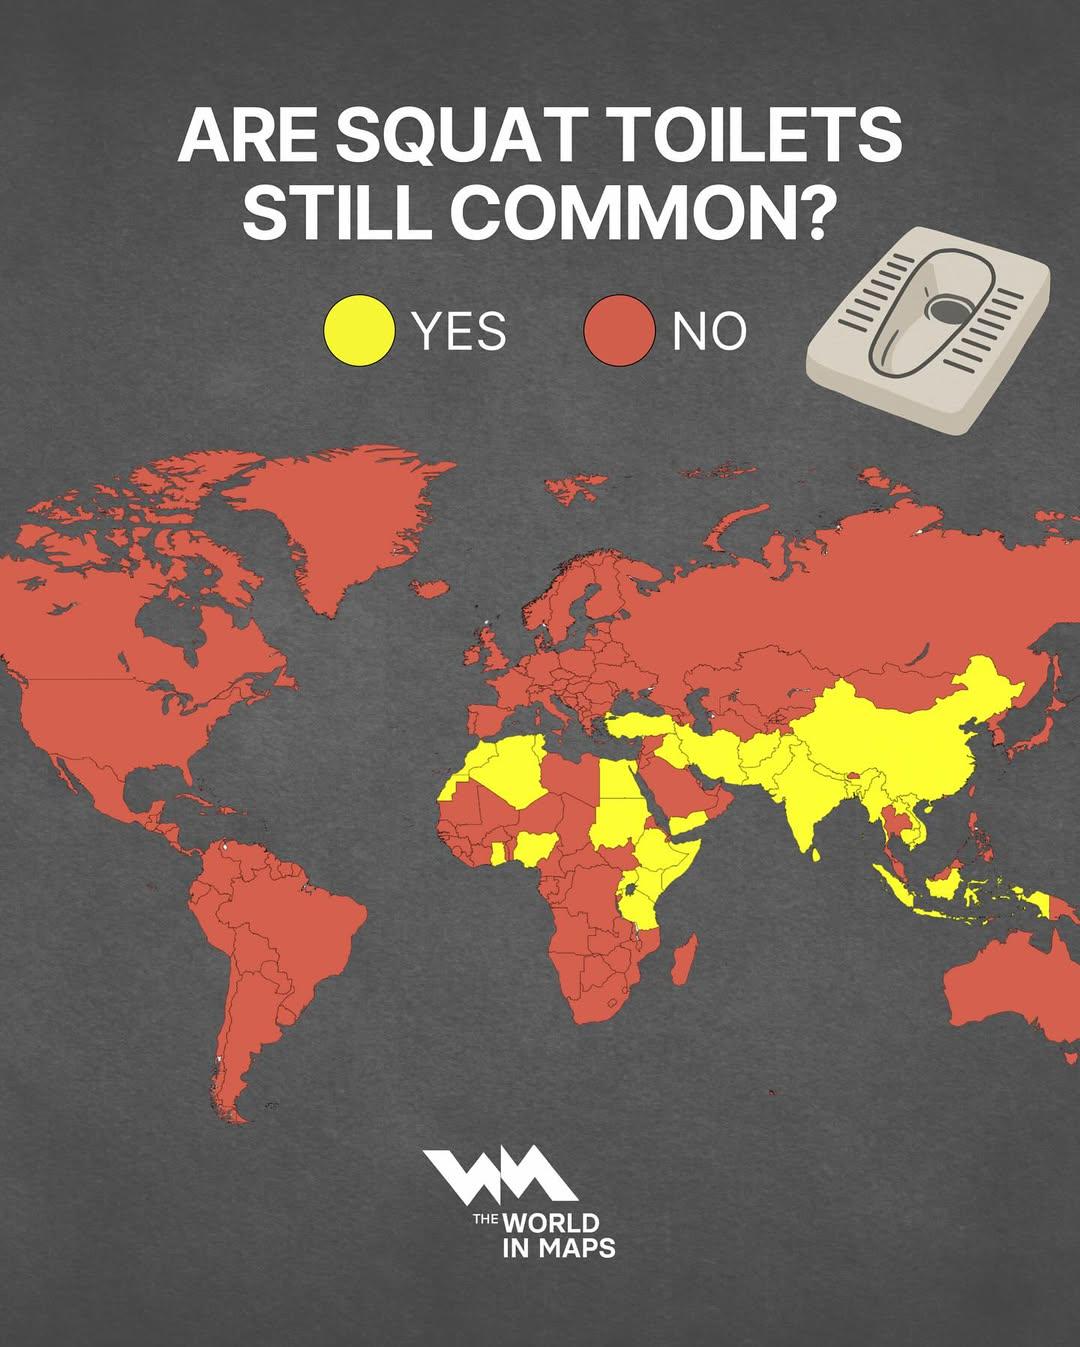
Global Map of Squat Toilet Prevalence
The map titled "Are Squat Toilets Still Common?" provides a visual representation of the prevalence of squat toilets acr...
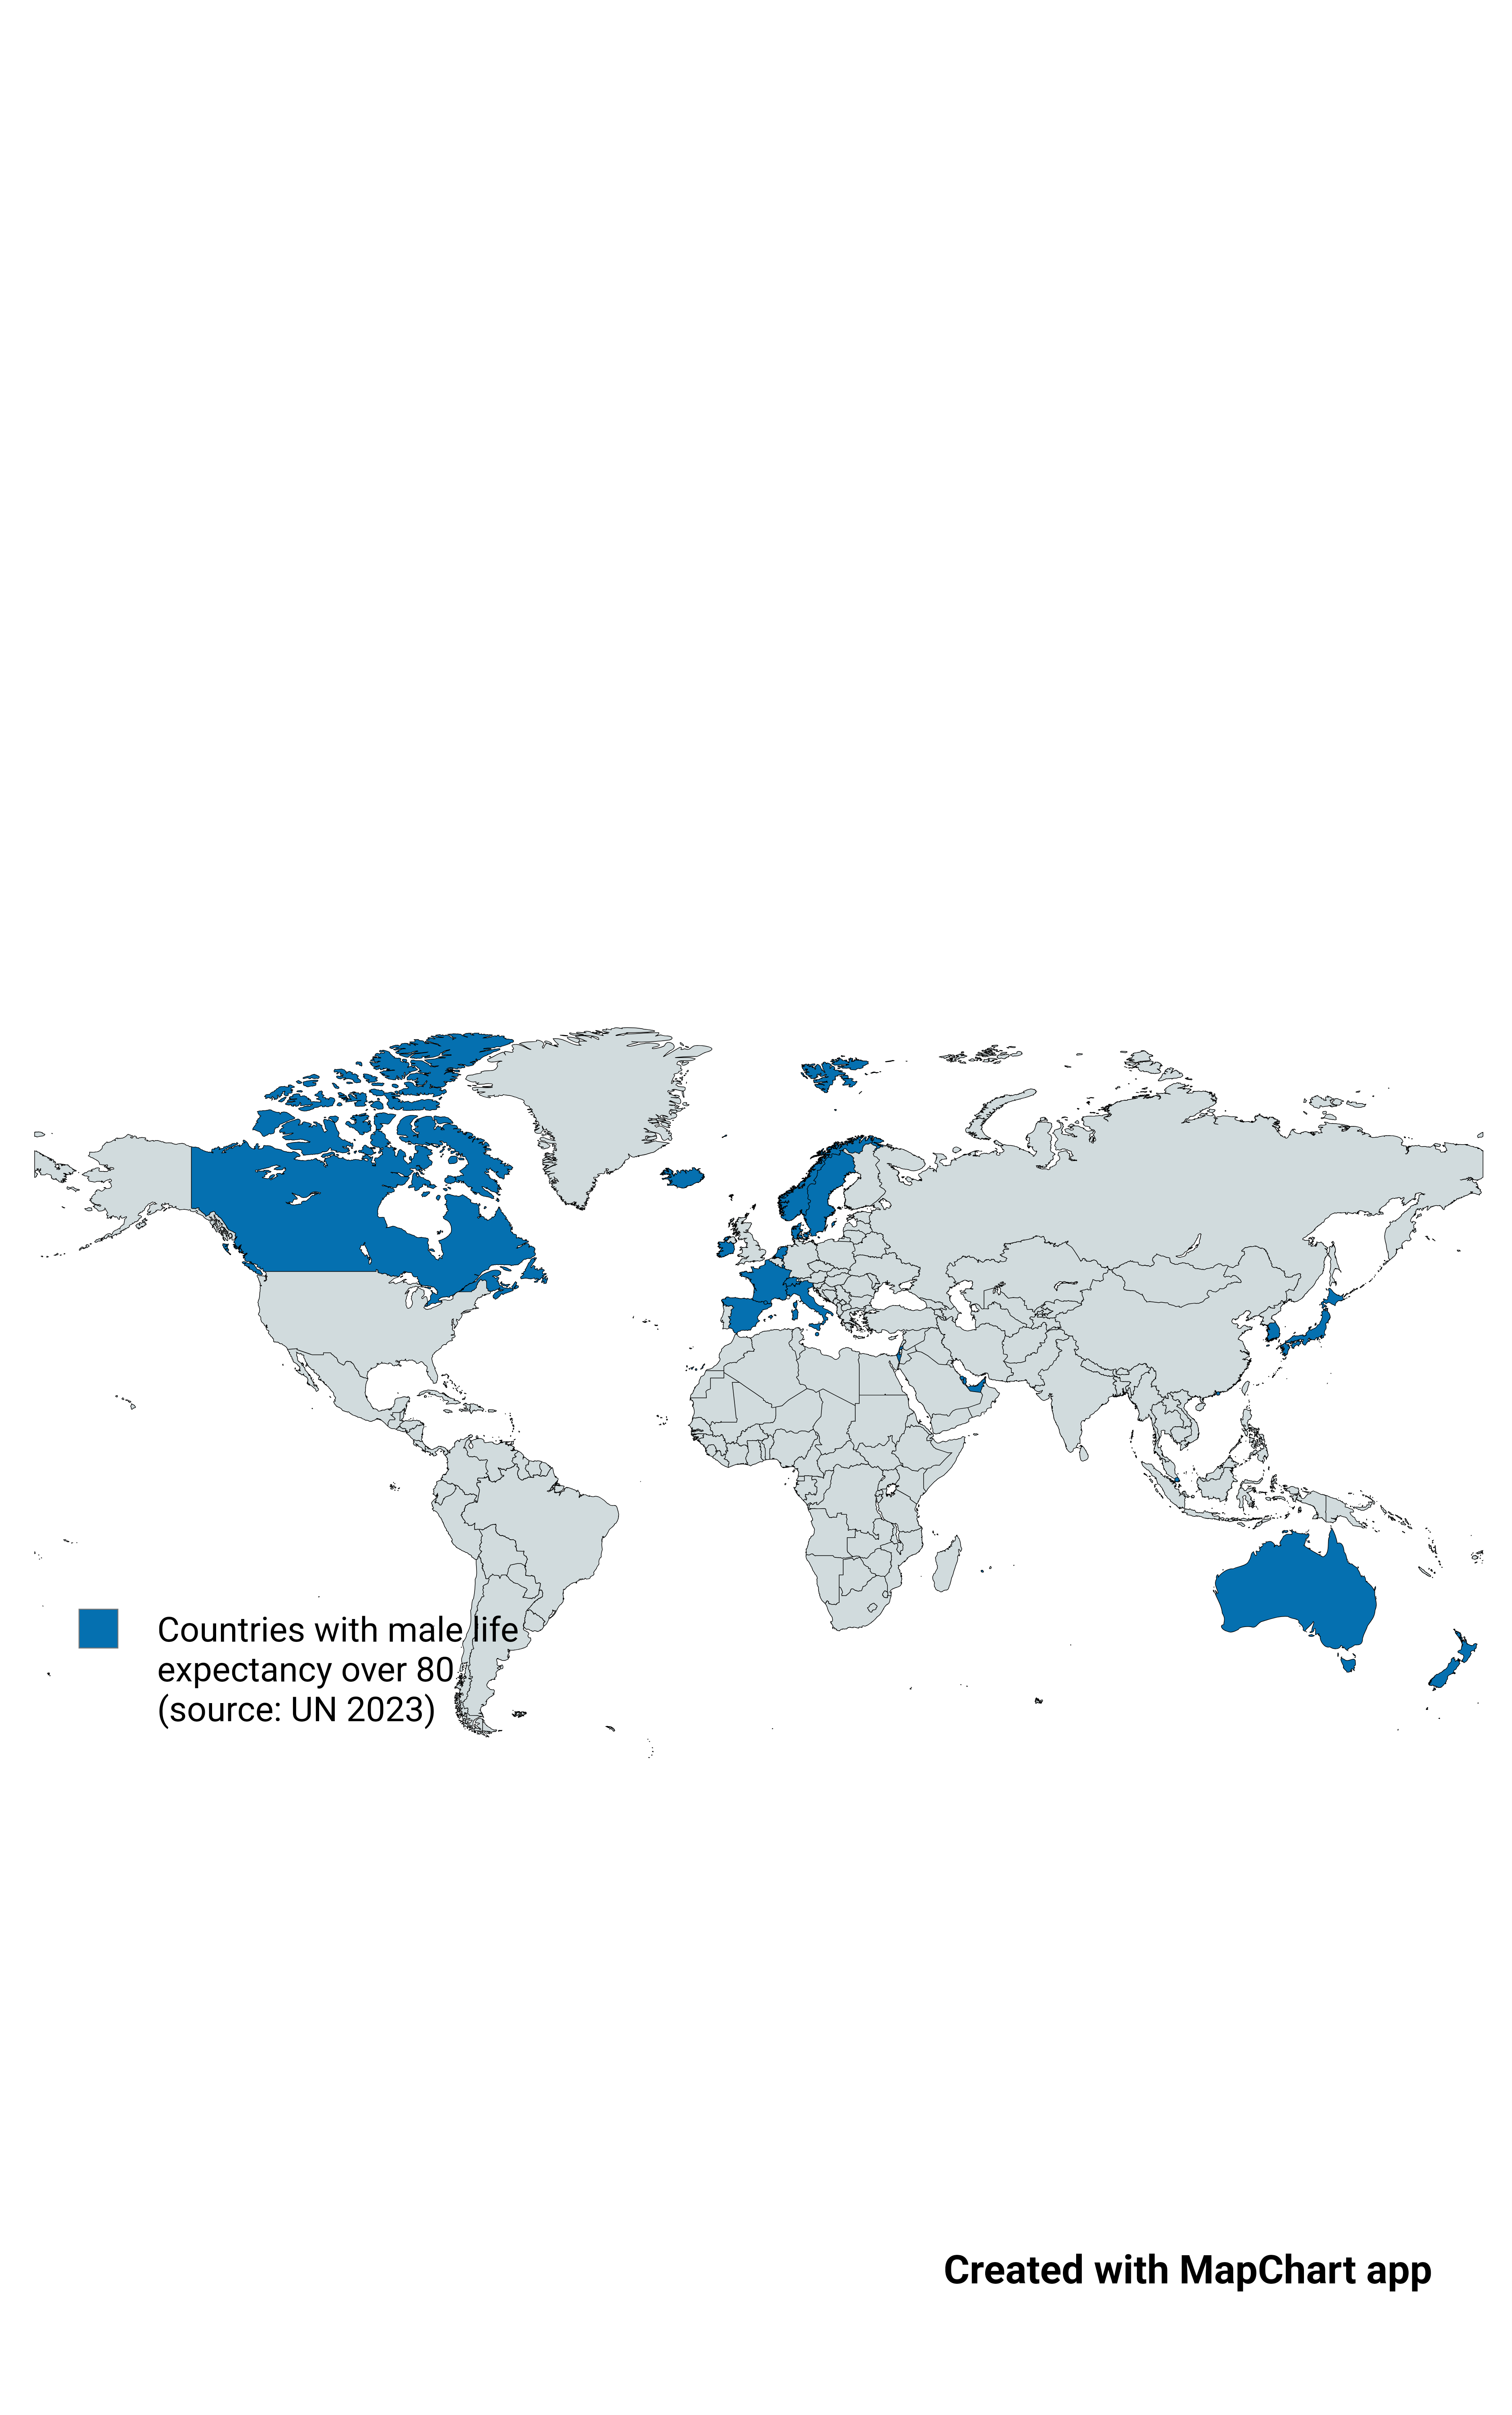
Map of Countries with Male Life Expectancy Over 80
This map highlights countries where male life expectancy exceeds 80 years, a more stringent criterion compared to the ge...
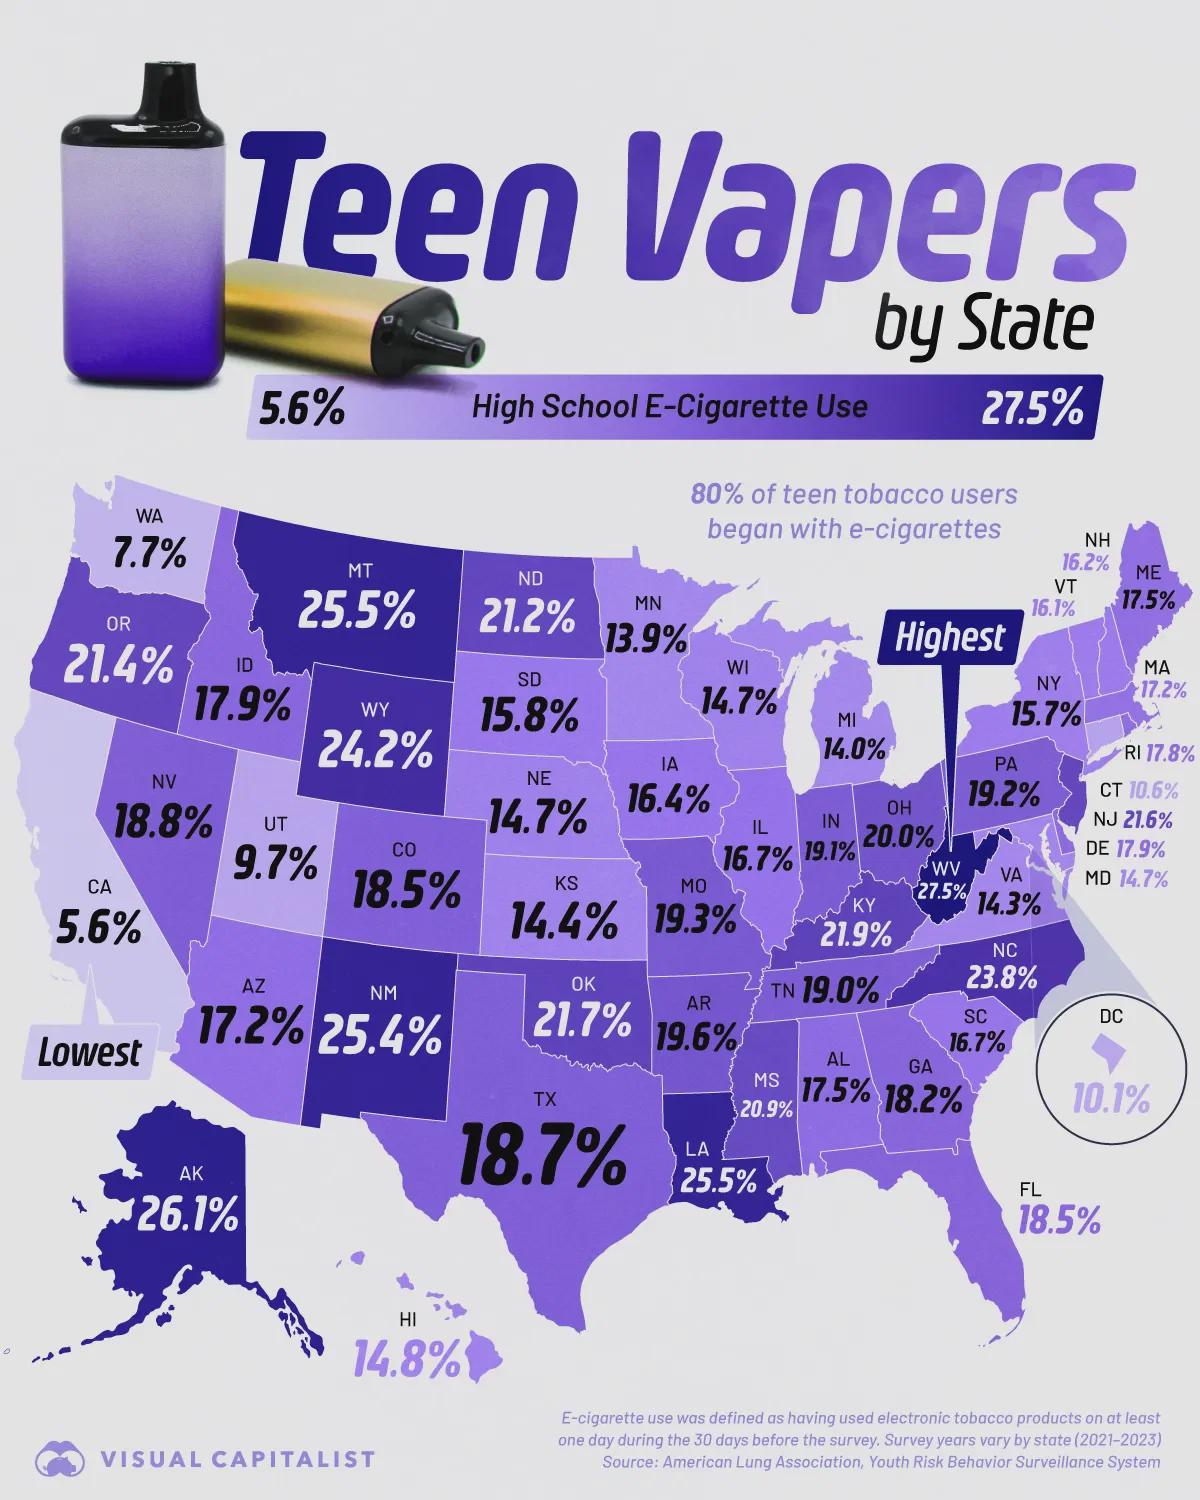
Teen Vaping Rates by U.S. State Map
The "Teen Vaping Rates by U.S. State Map" provides a clear visual representation of where the highest concentrations of ...
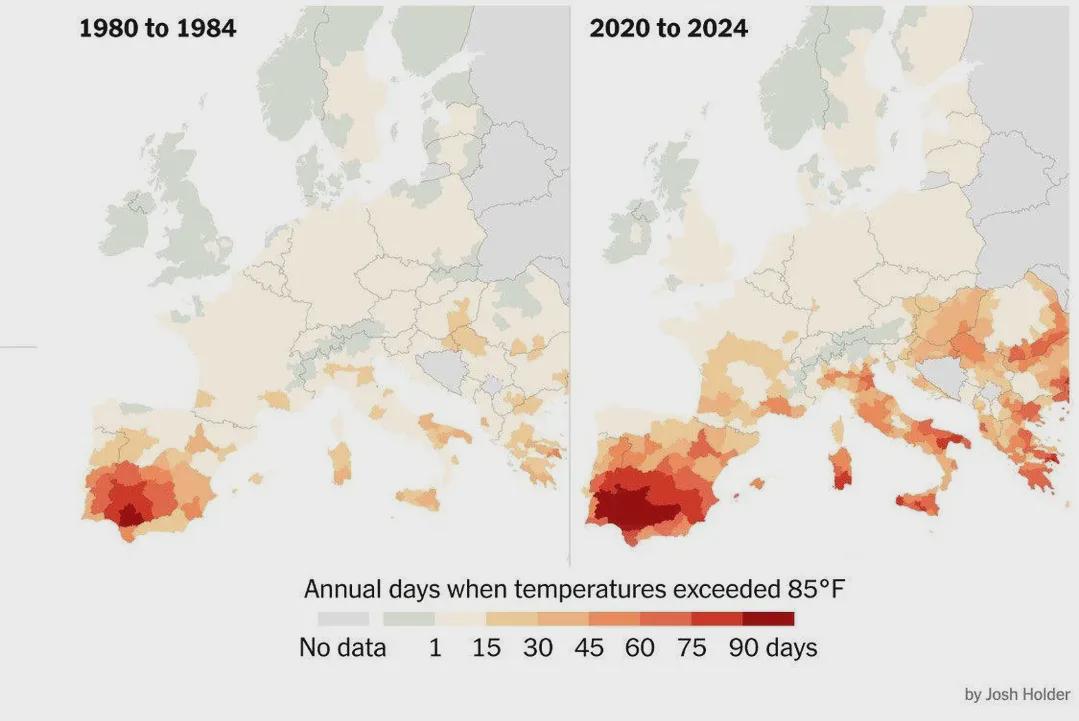
Days Over 30ºC in Europe Map
The visualization titled "Number of Days per Year When Temperatures Exceeded 30ºC (85°F) in Europe" provides a comprehen...
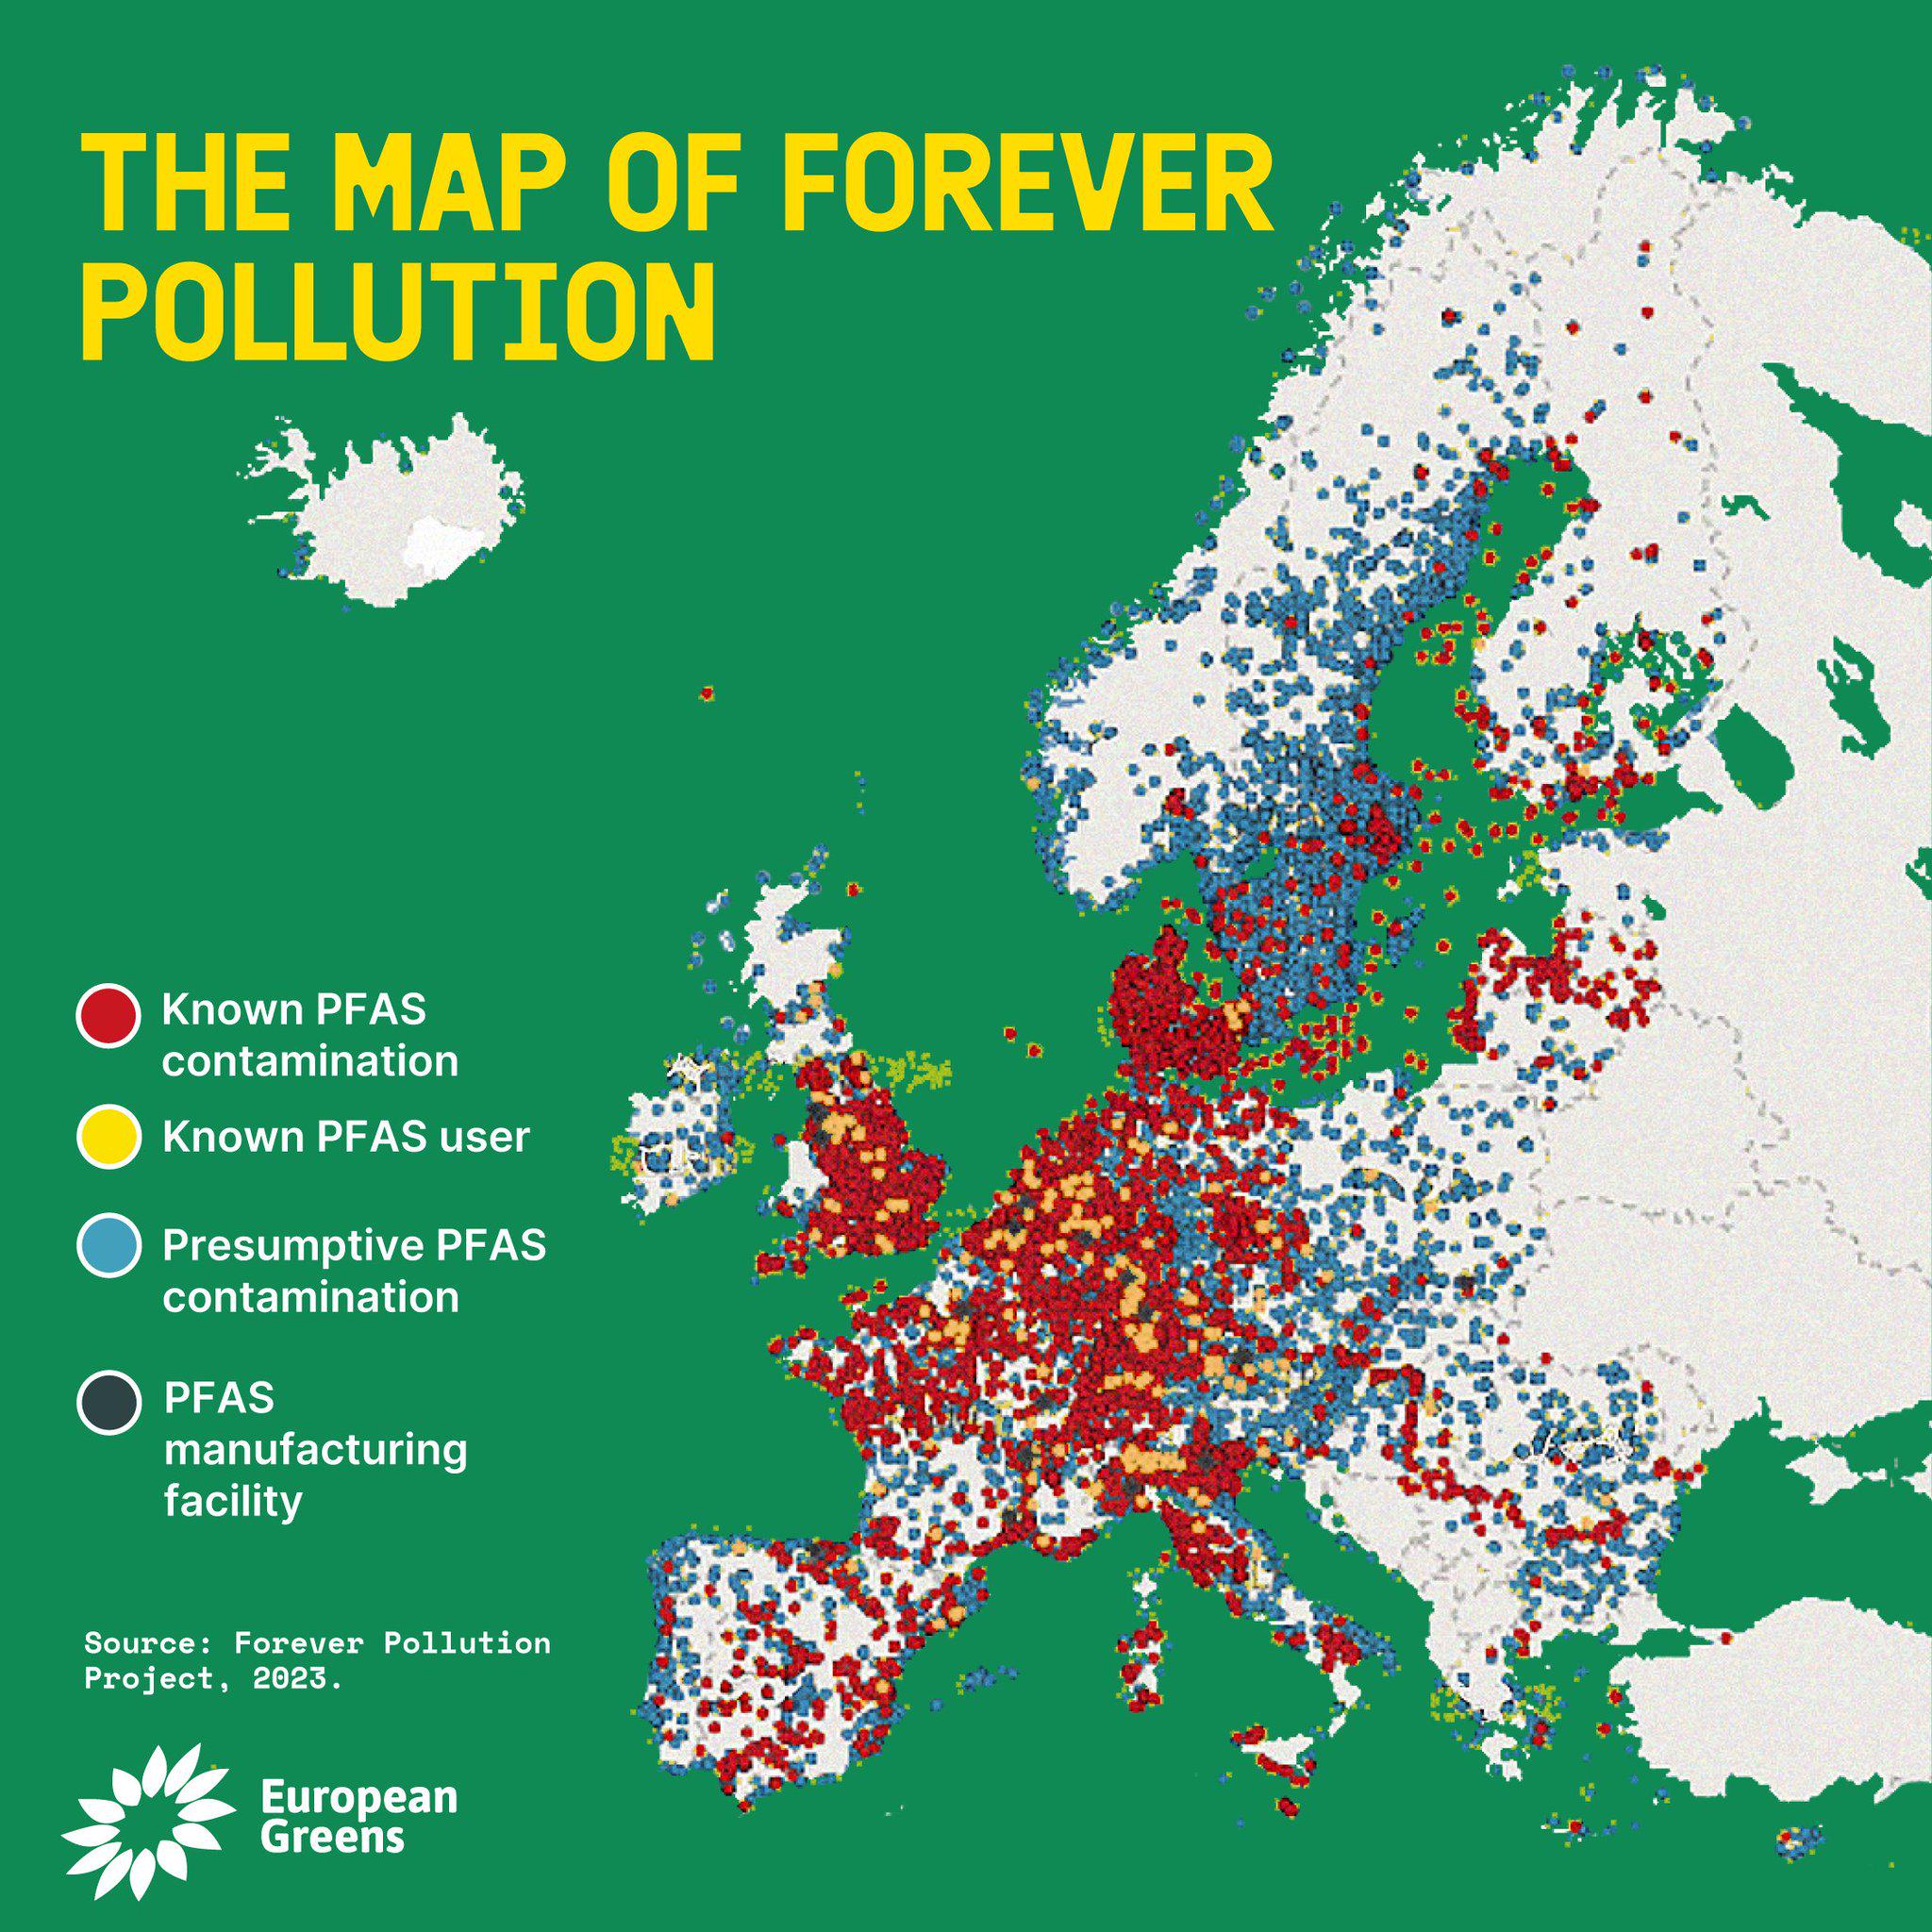
PFAS Contamination Map
The PFAS Contamination Map provides a comprehensive overview of areas affected by per- and polyfluoroalkyl substances (P...
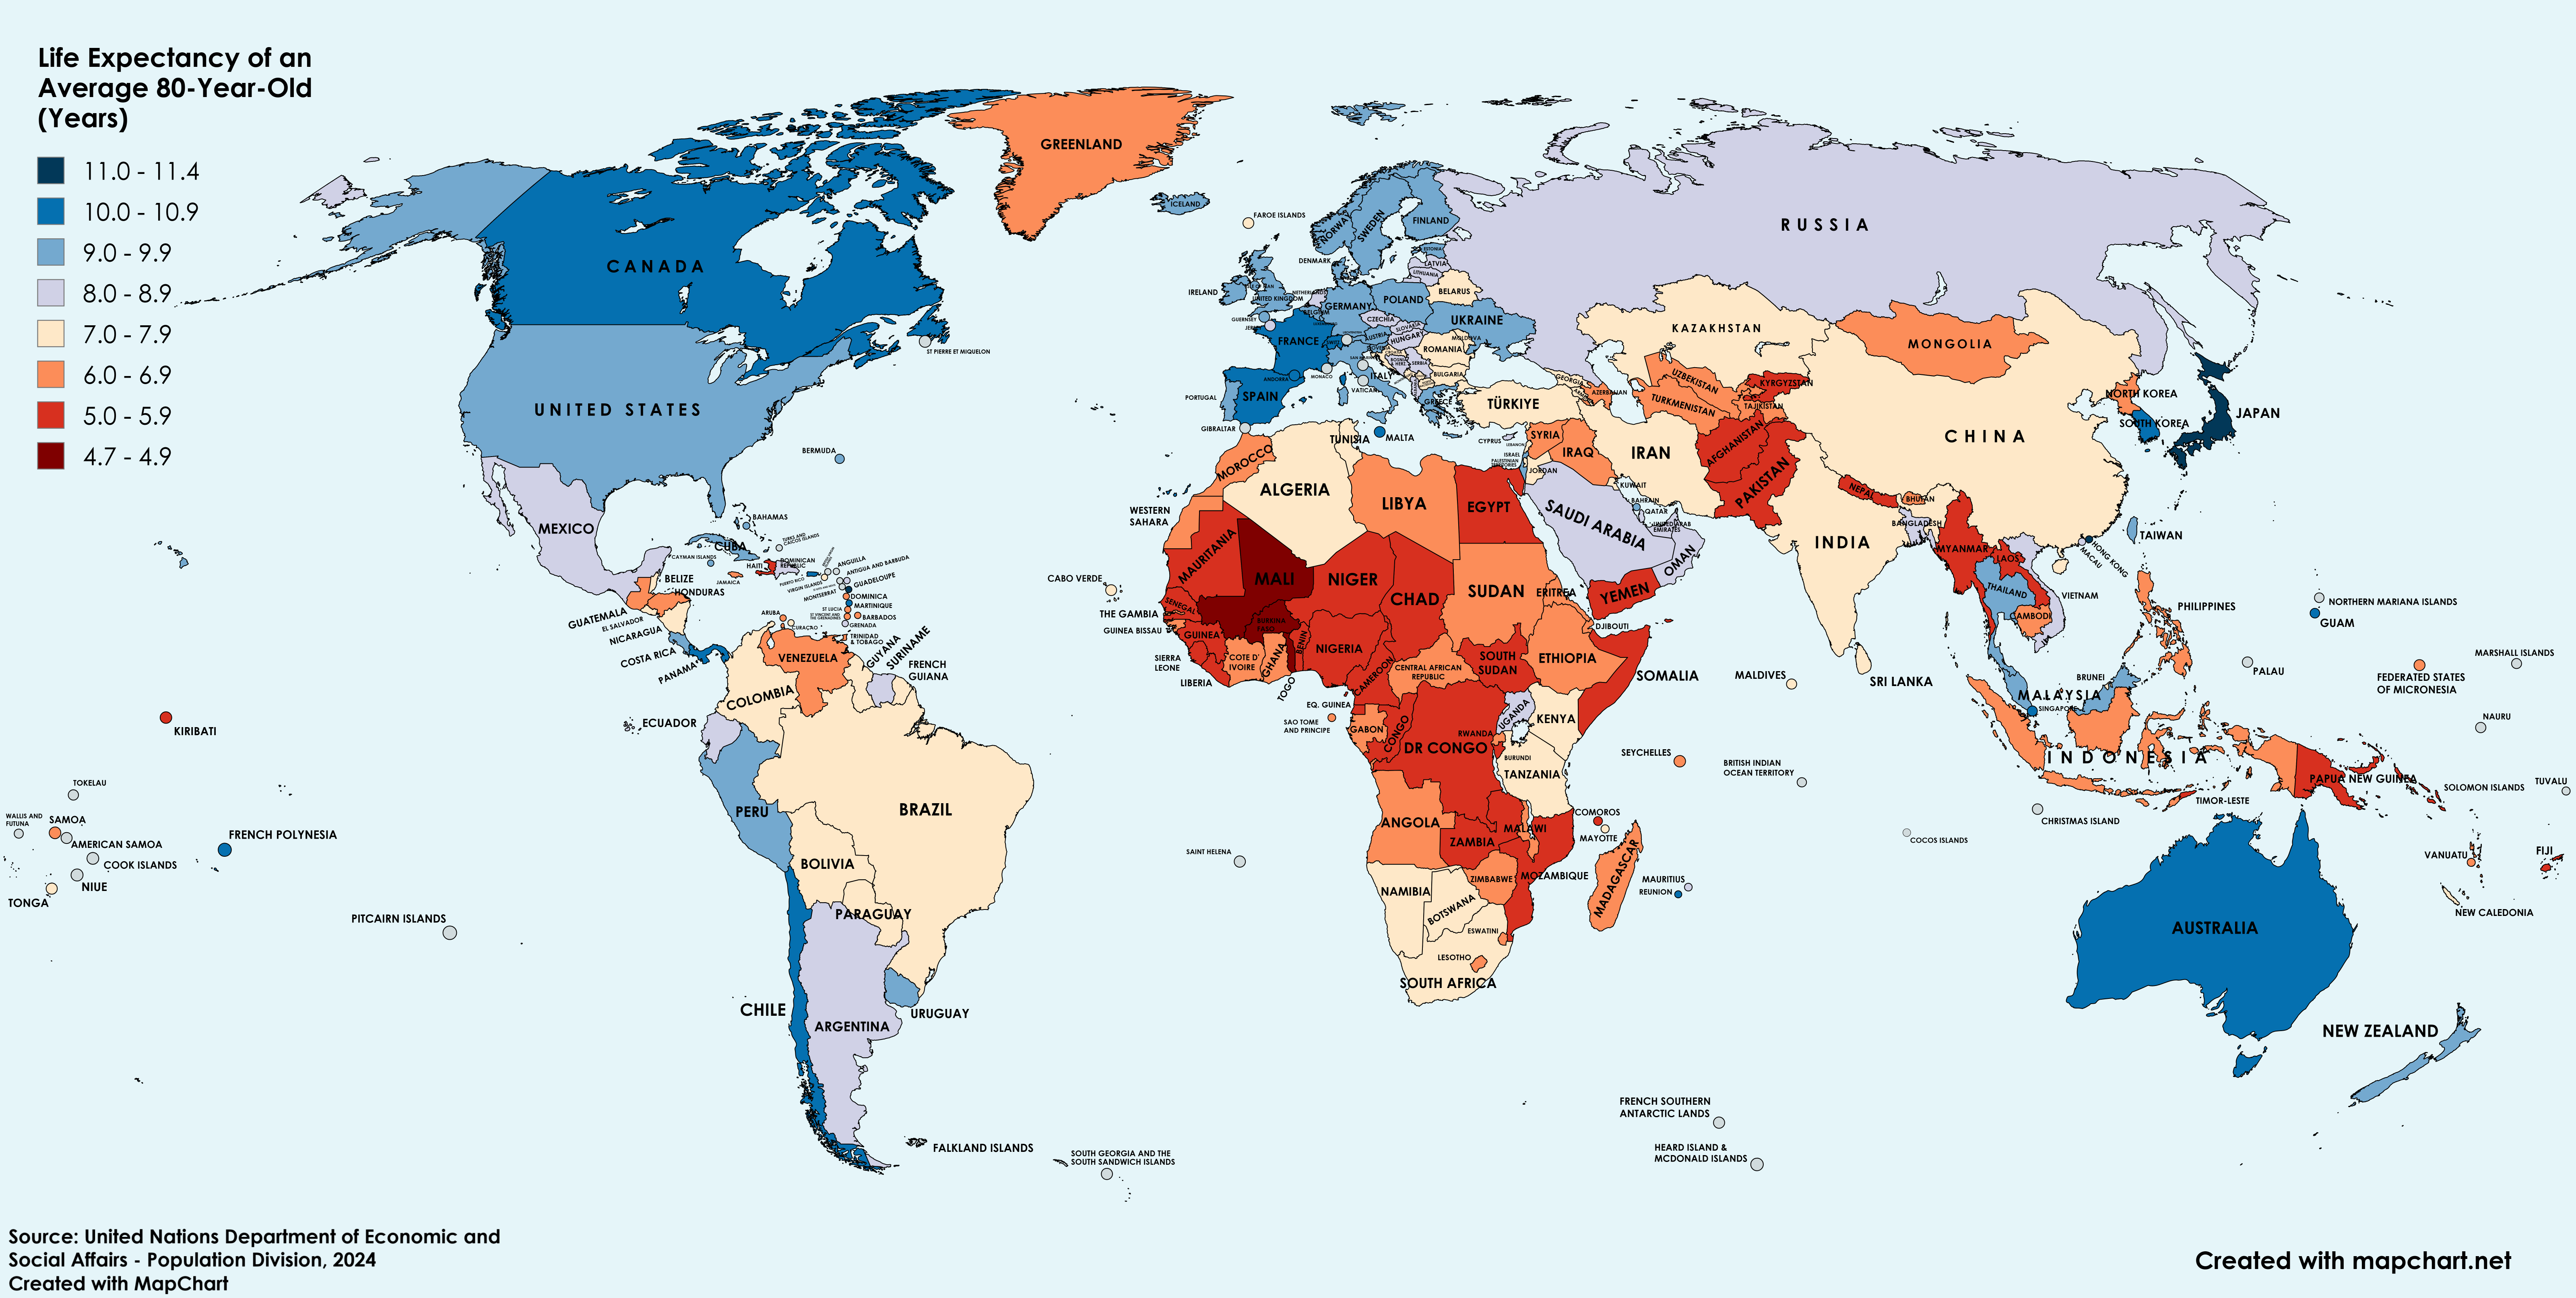
Life Expectancy of an 80-Year-Old Across the World Map
The map titled "Life Expectancy of an 80-Year-Old Across the World" offers an insightful visualization of how long indiv...
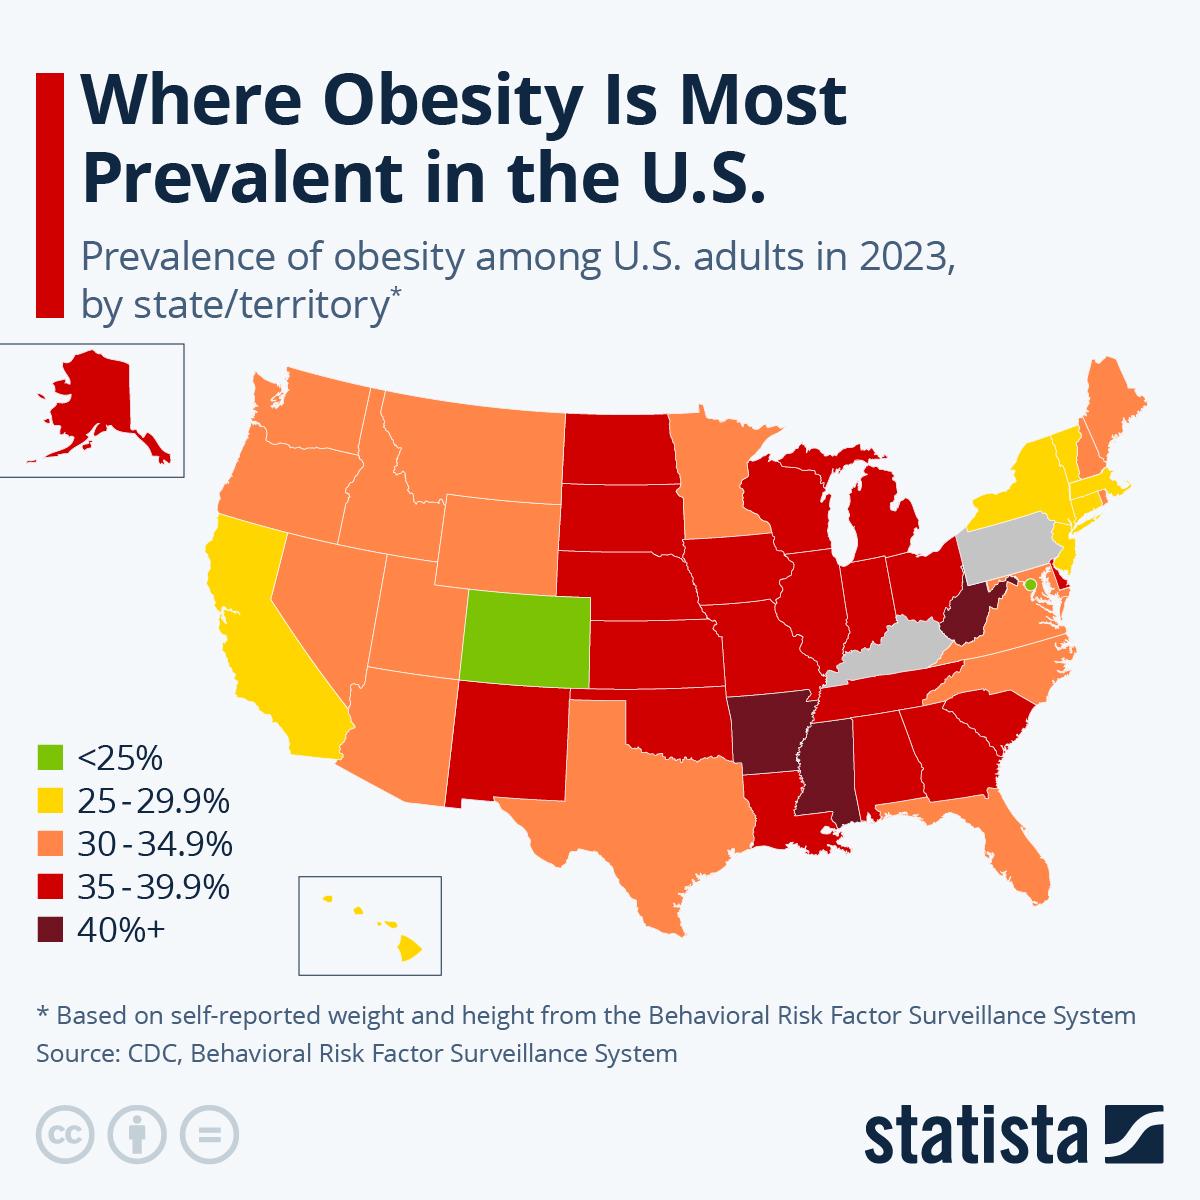
American Obesity Statistics Map
The American Obesity Statistics Map visually represents the prevalence of obesity across the United States. It highlight...
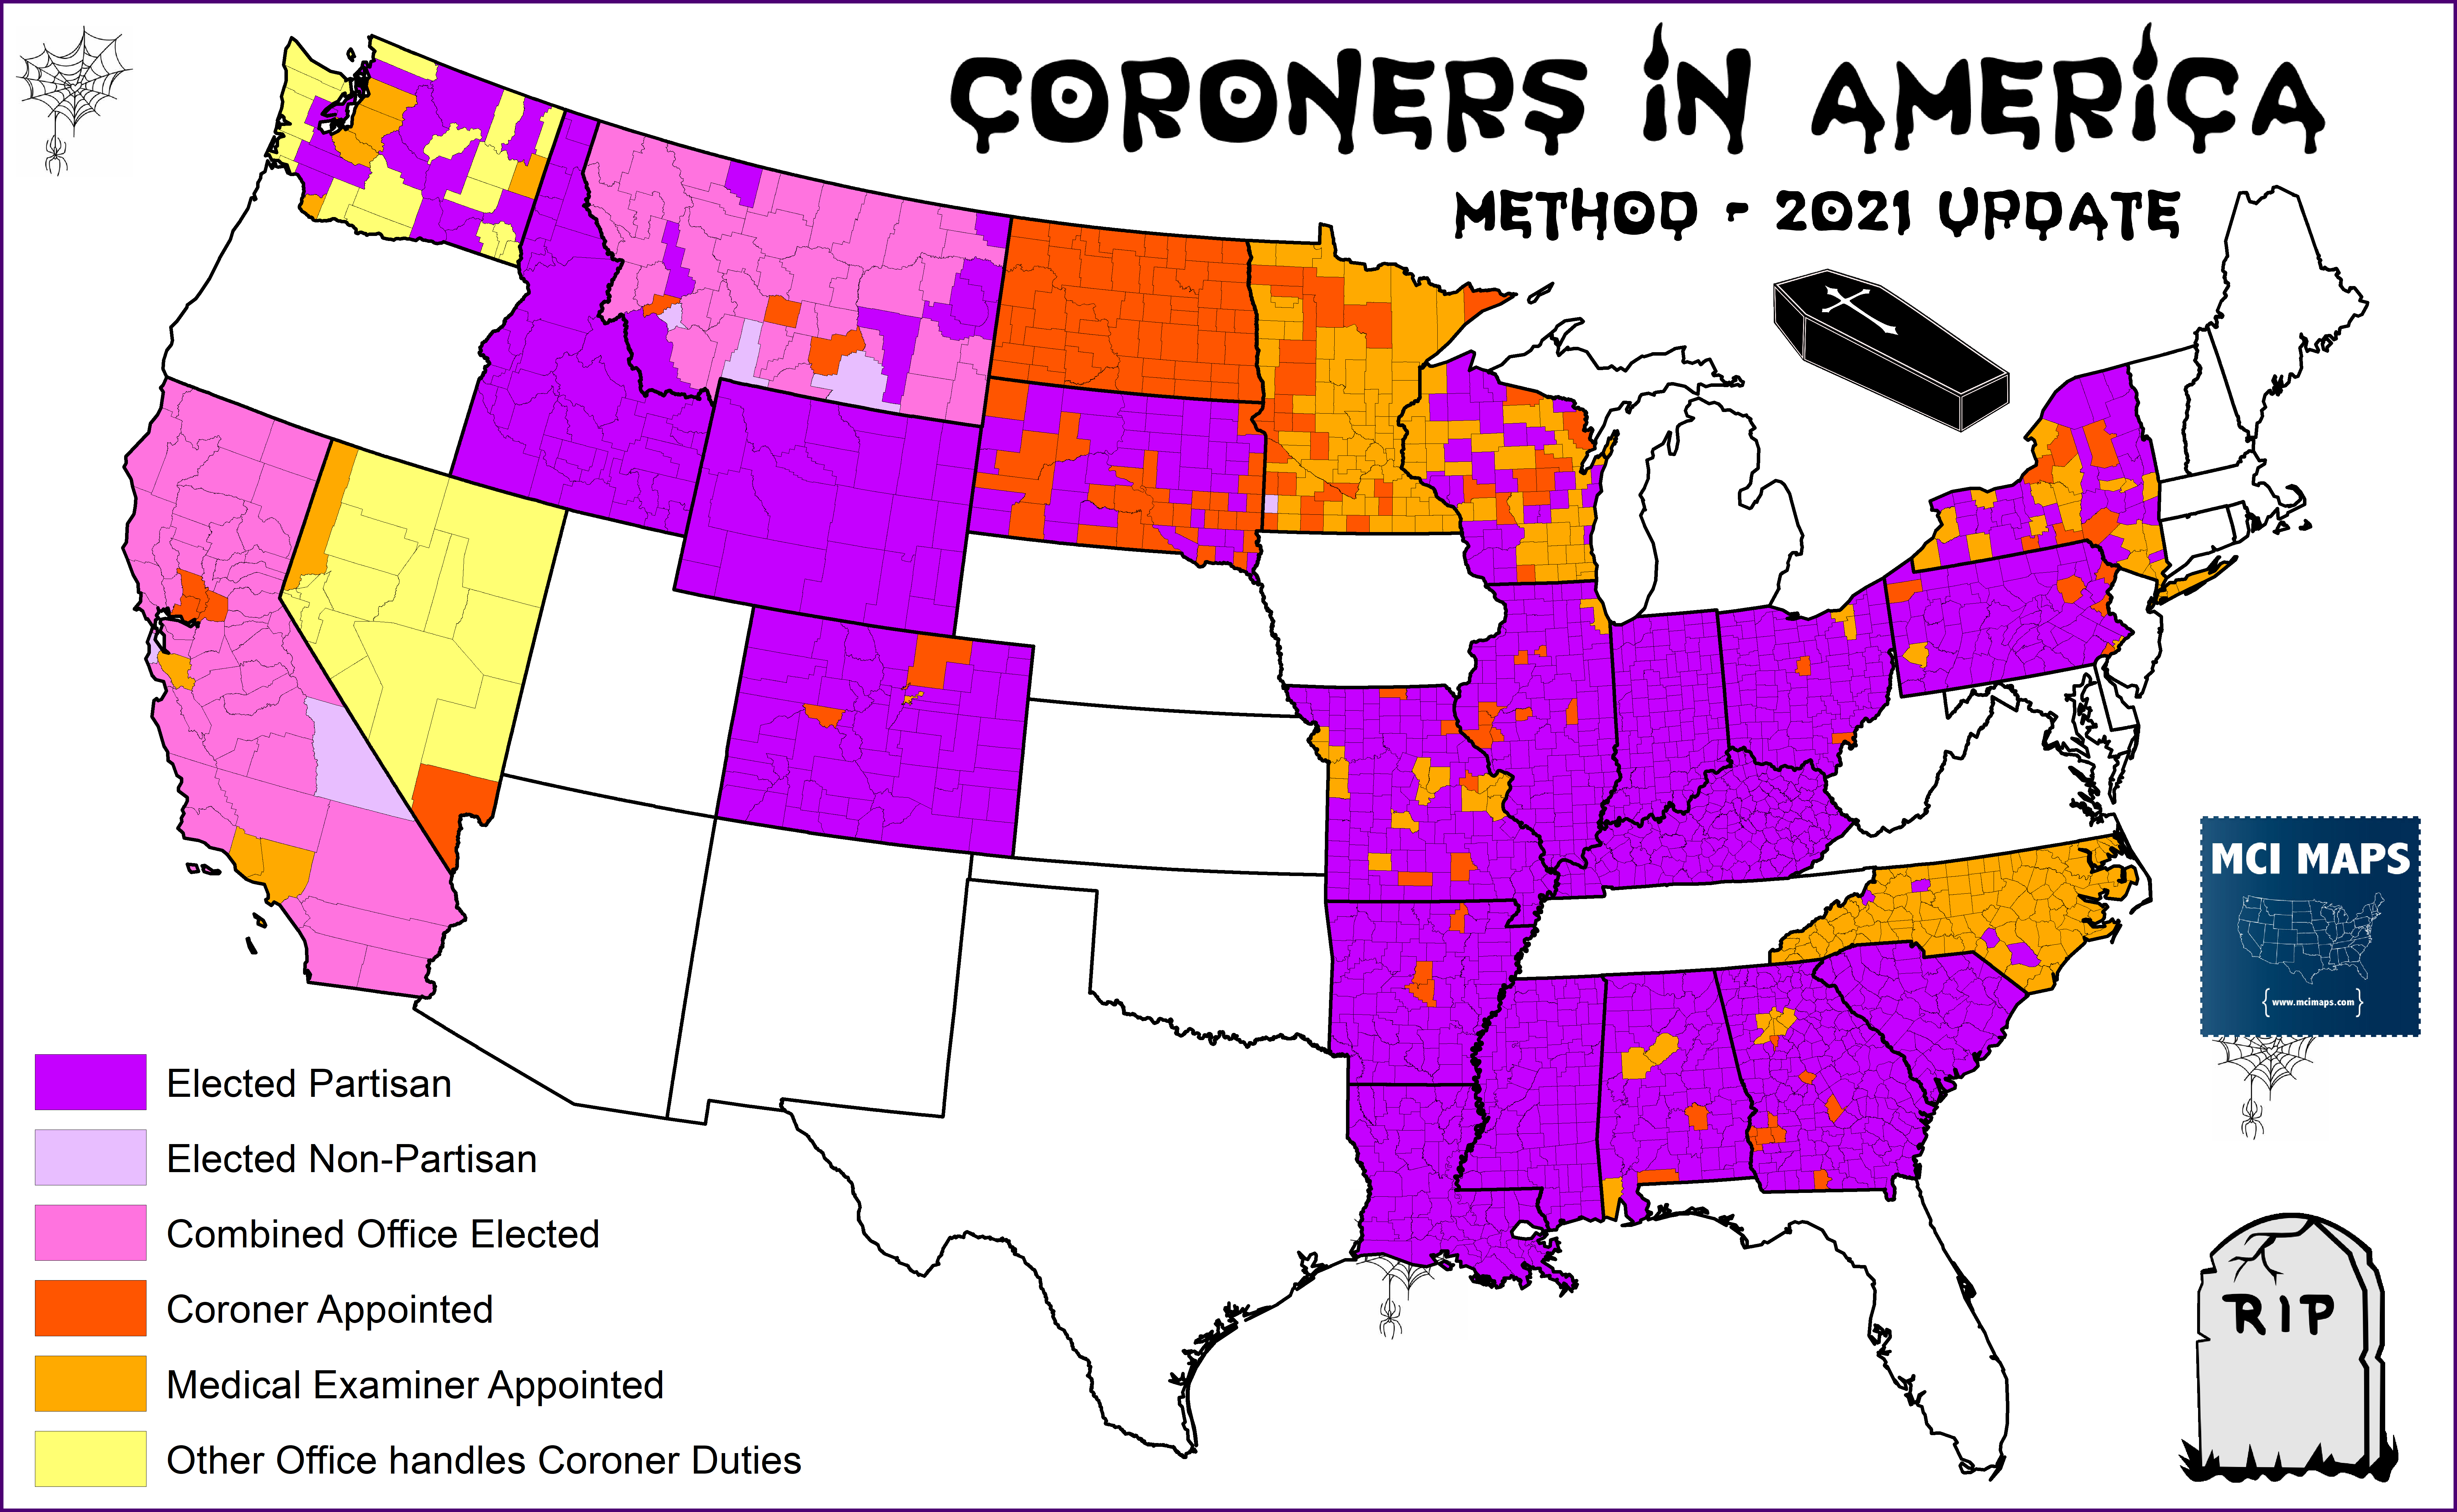
Map of Elected Coroners in America
...
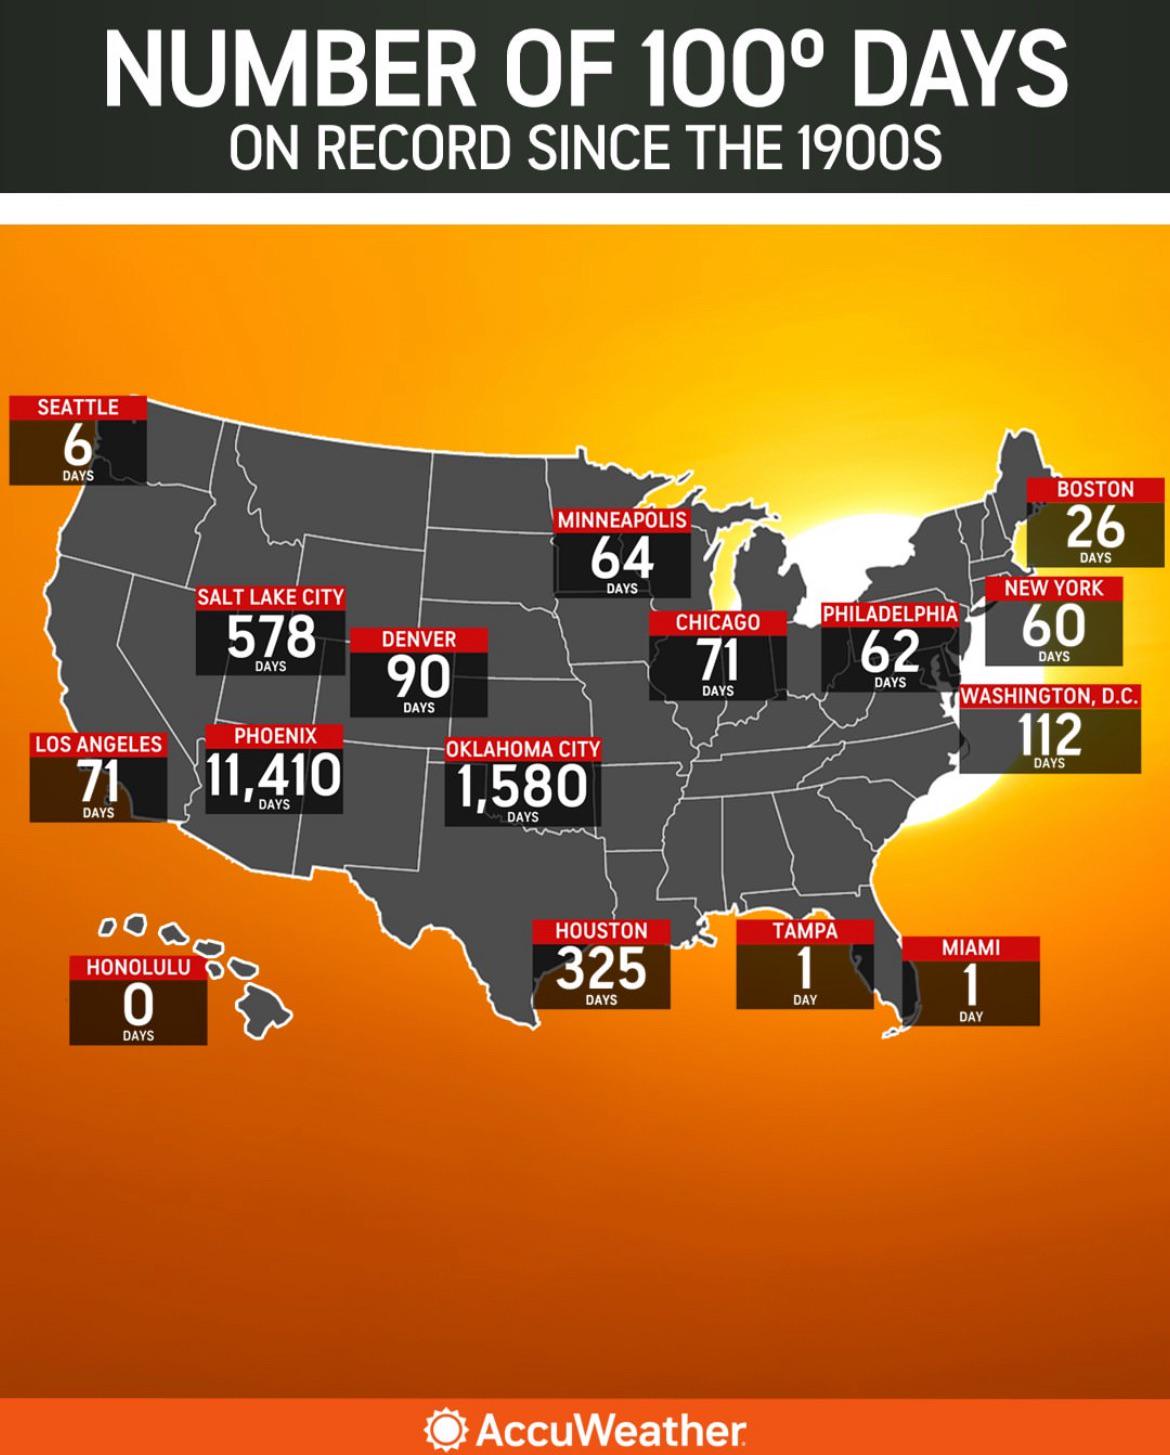
Map of 100° Days Recorded Since 1900
The map titled 'Number of 100° Days on Record Since the 1900s' visually represents the frequency of extreme heat days ac...
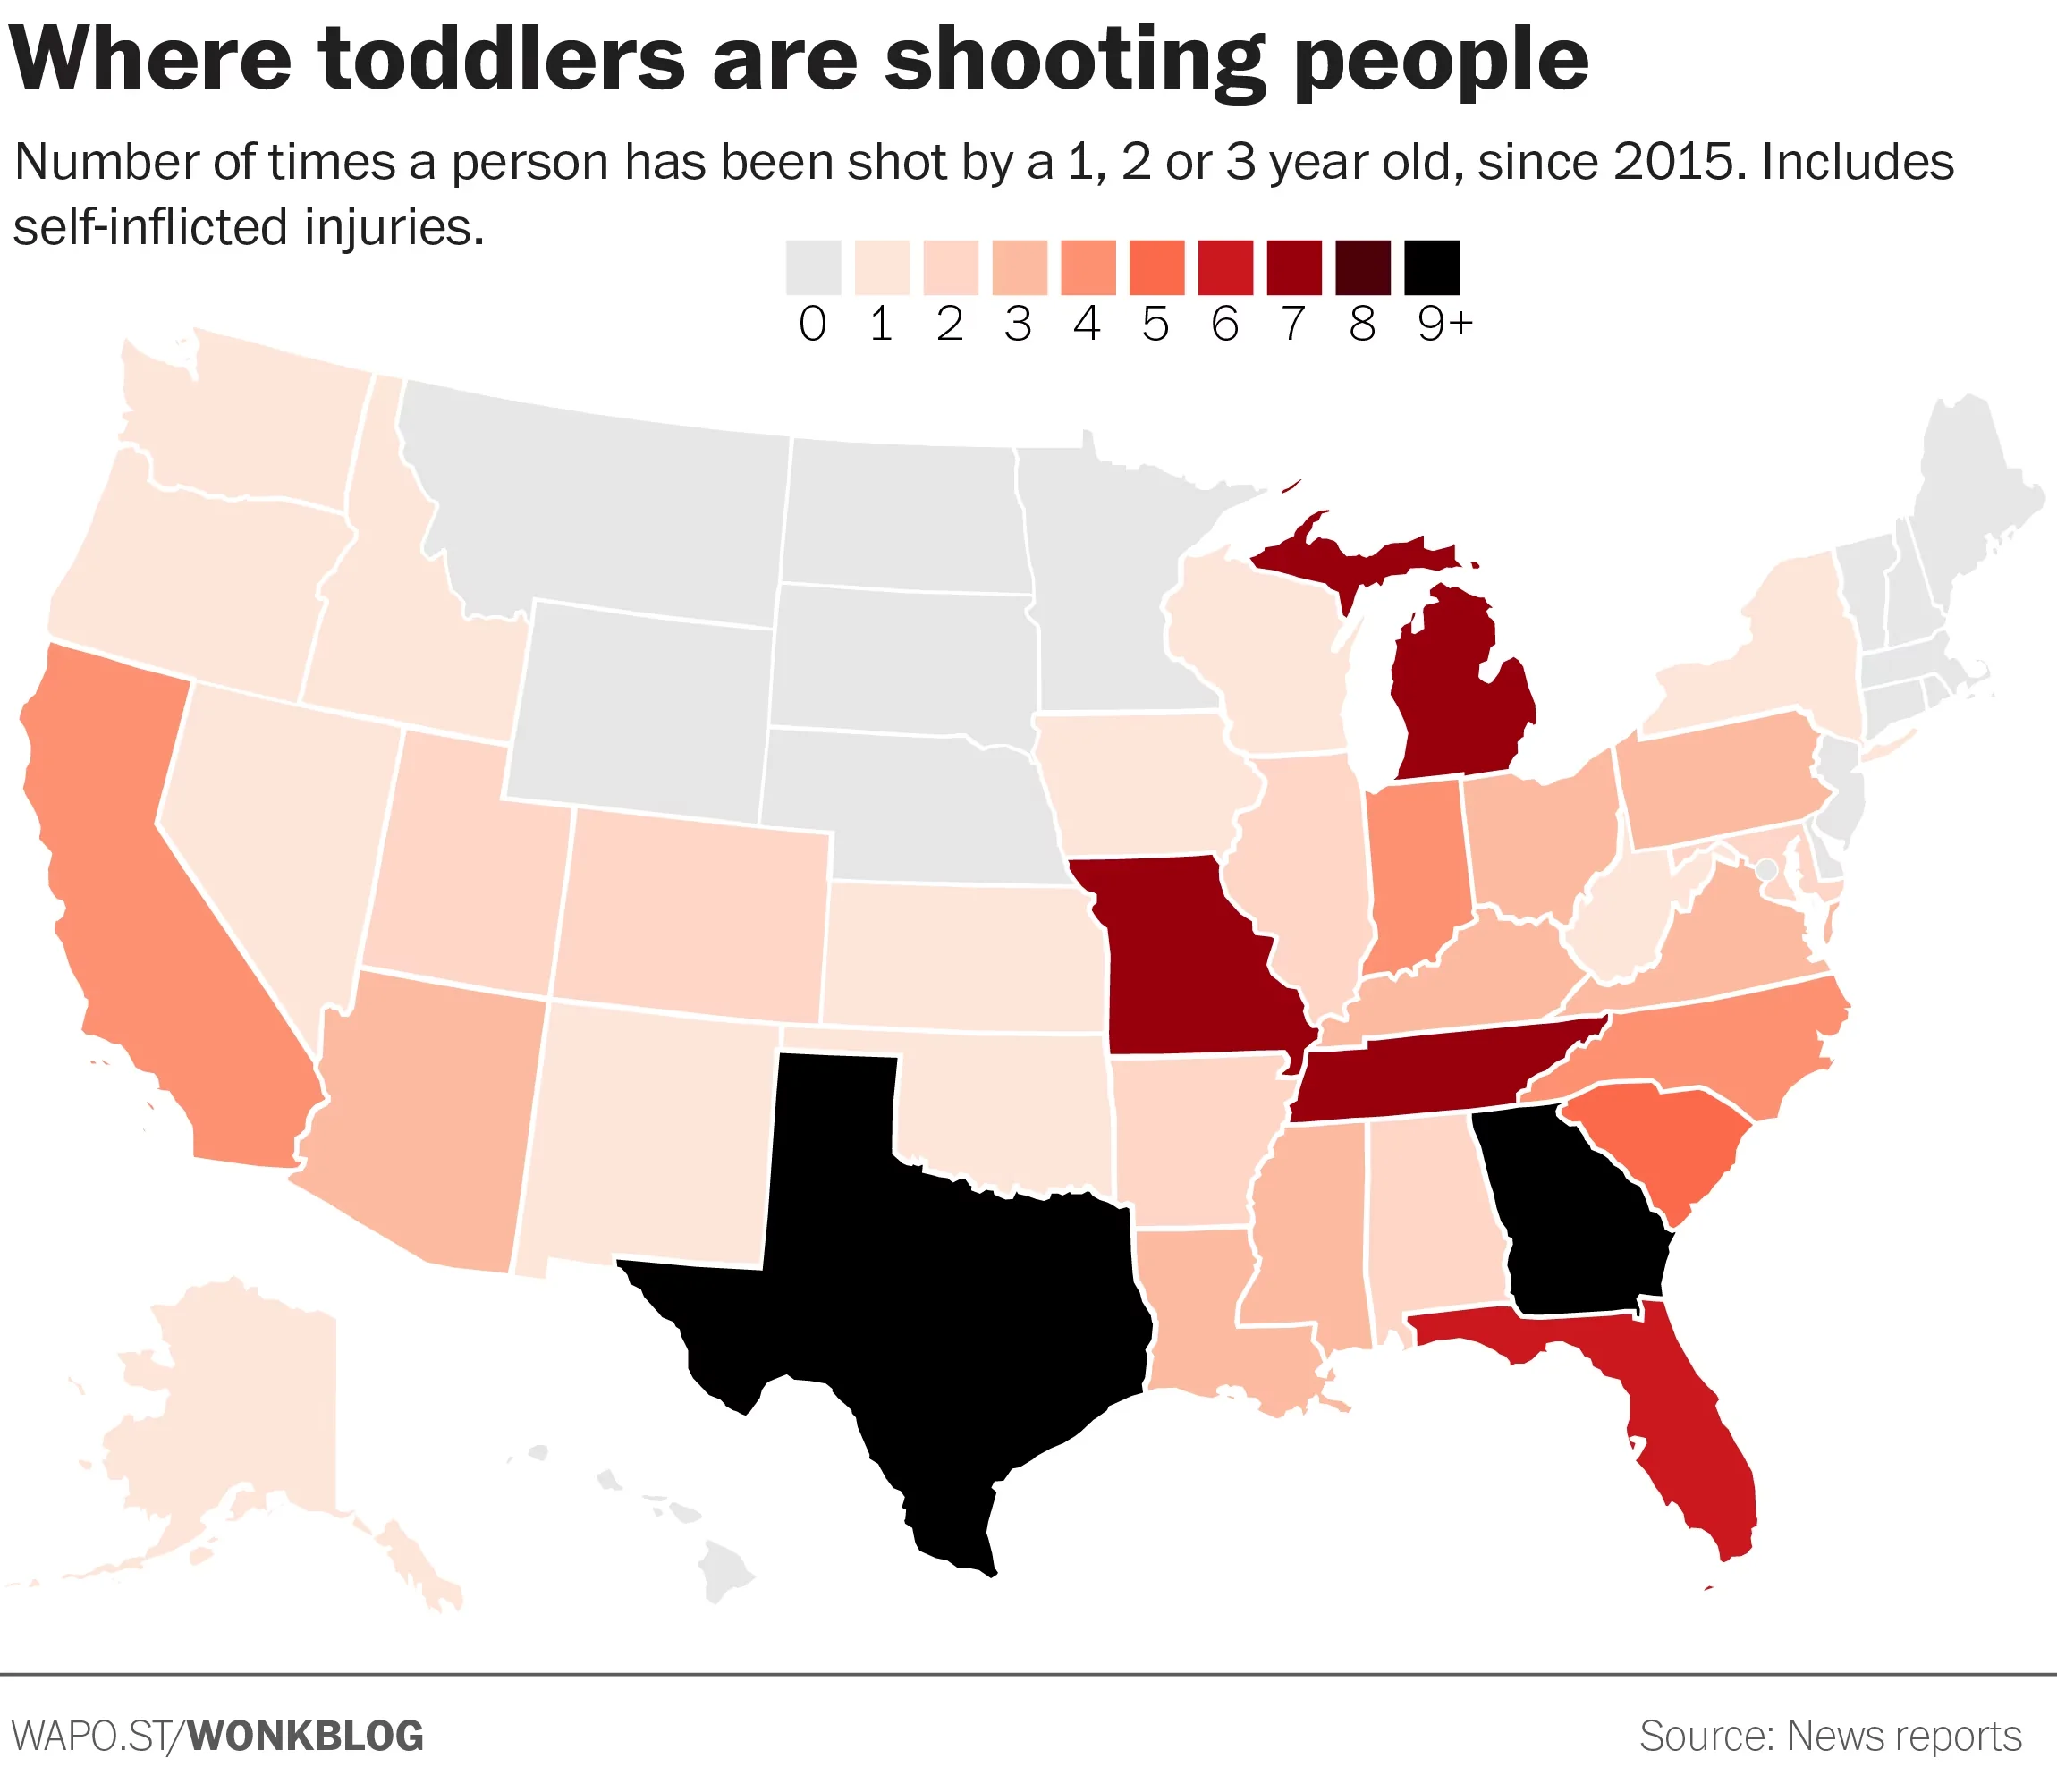
Gun Violence Map of the United States
The \...
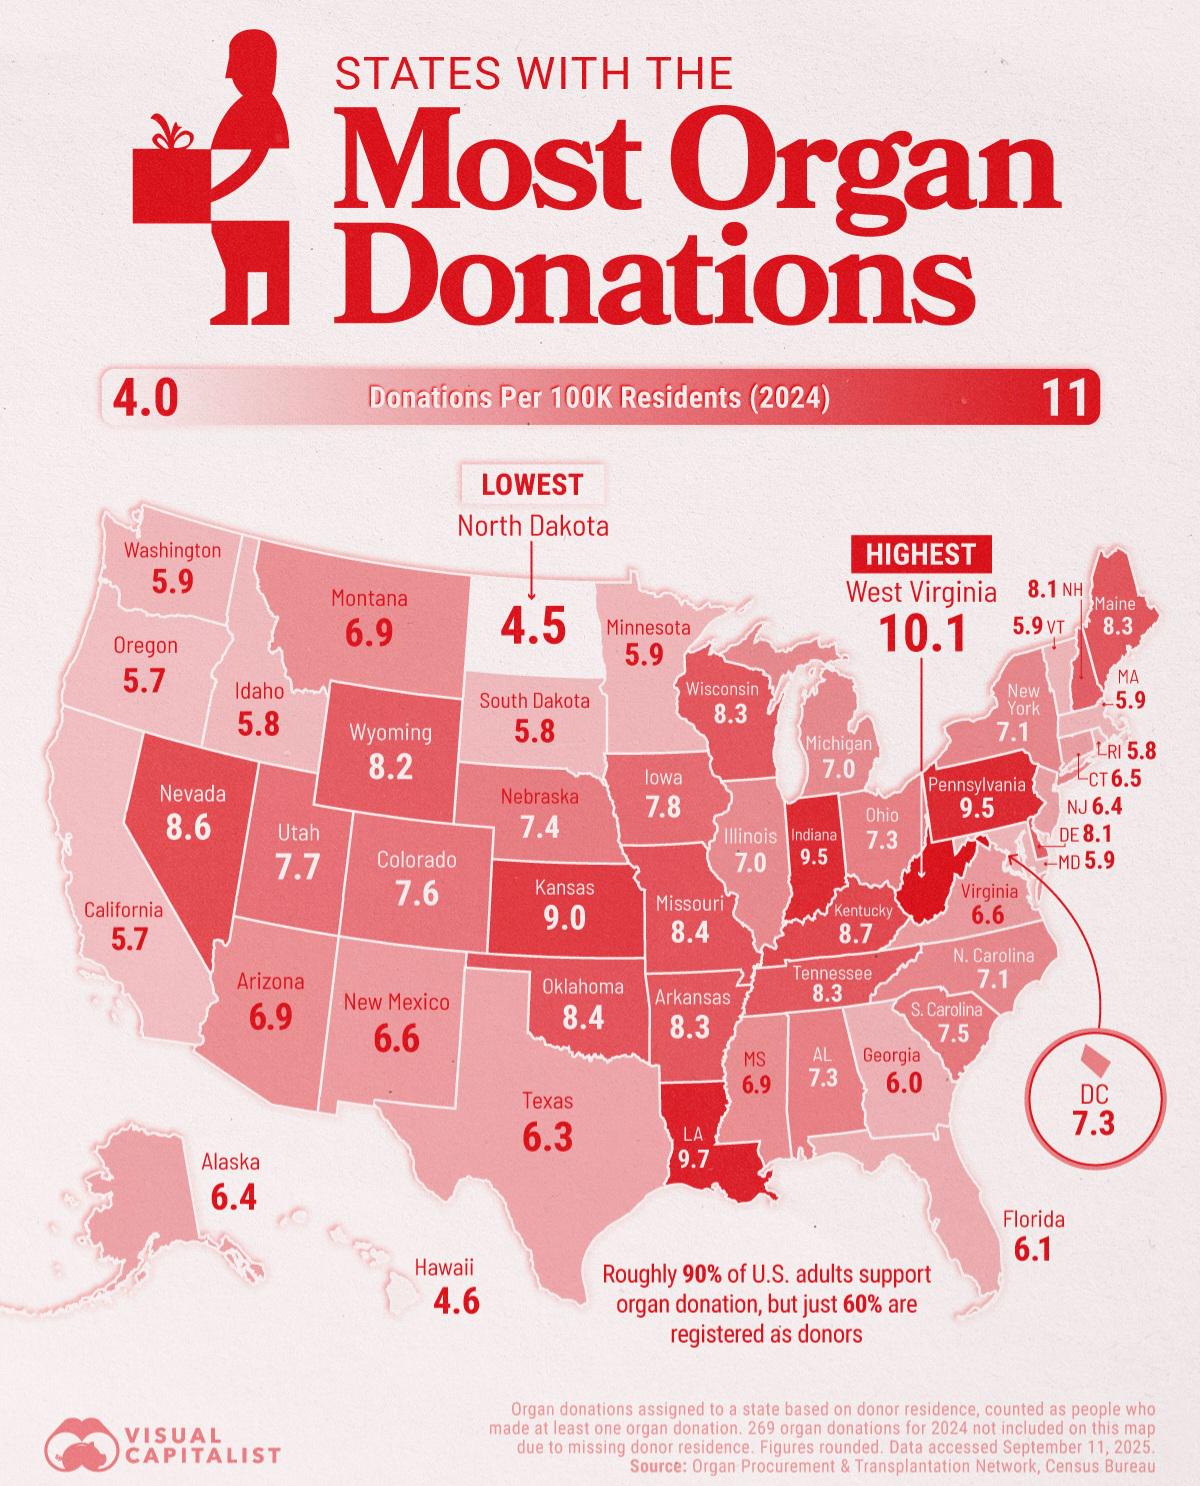
Map of U.S. States Leading in Organ Donations
This map provides a comprehensive overview of organ donation rates across various U.S. states, highlighting which states...
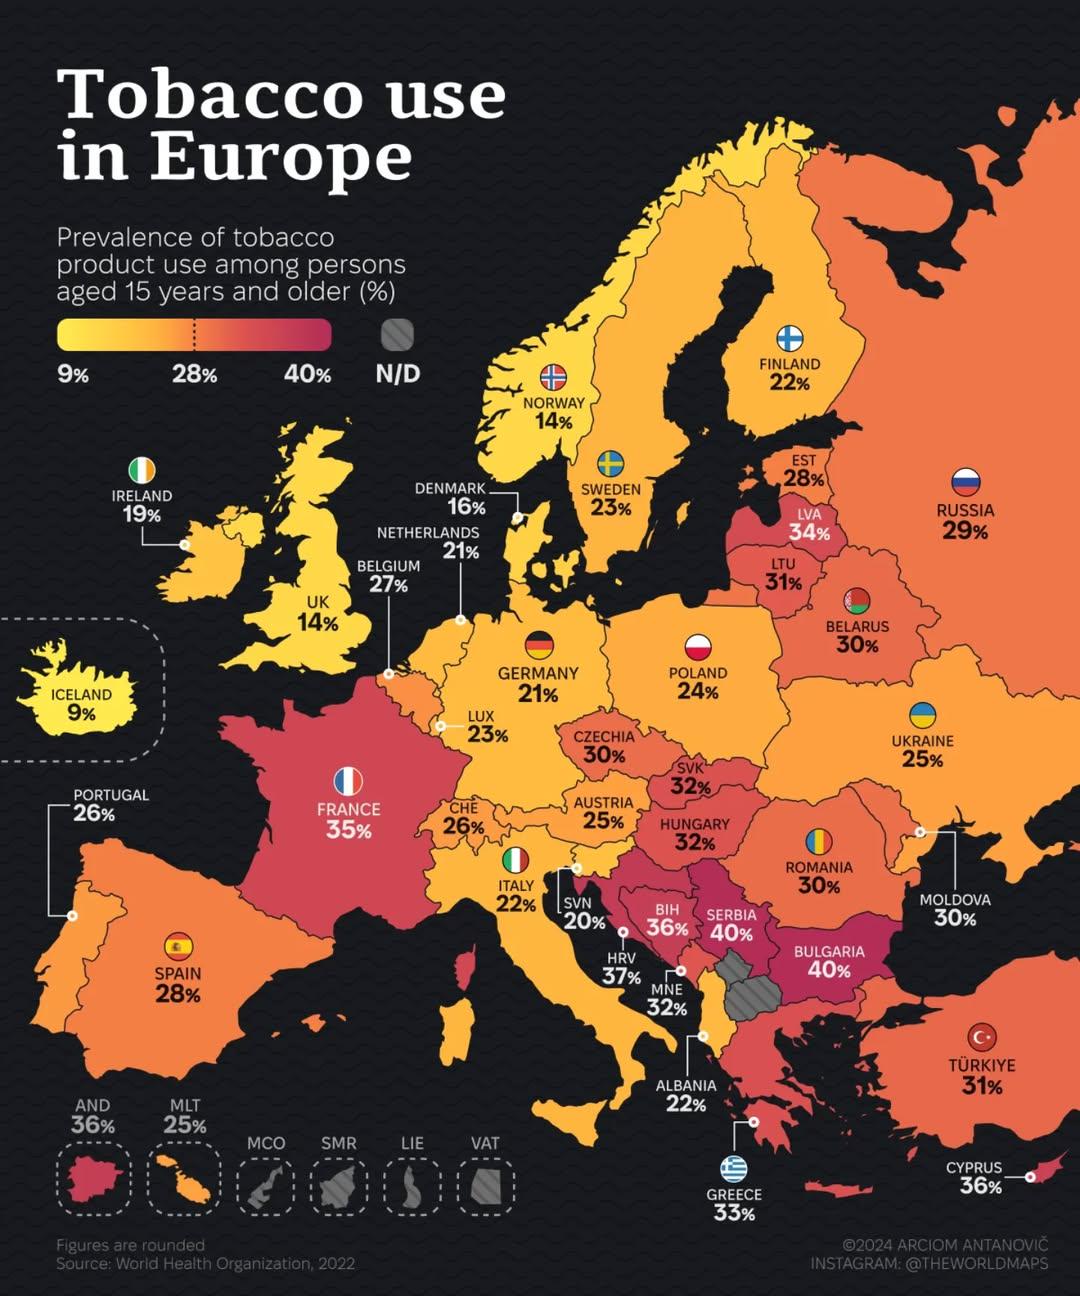
Tobacco Use in Europe Map
For instance, Eastern European countries, such as Bulgaria and Serbia, show some of the highest smoking rates, with esti...
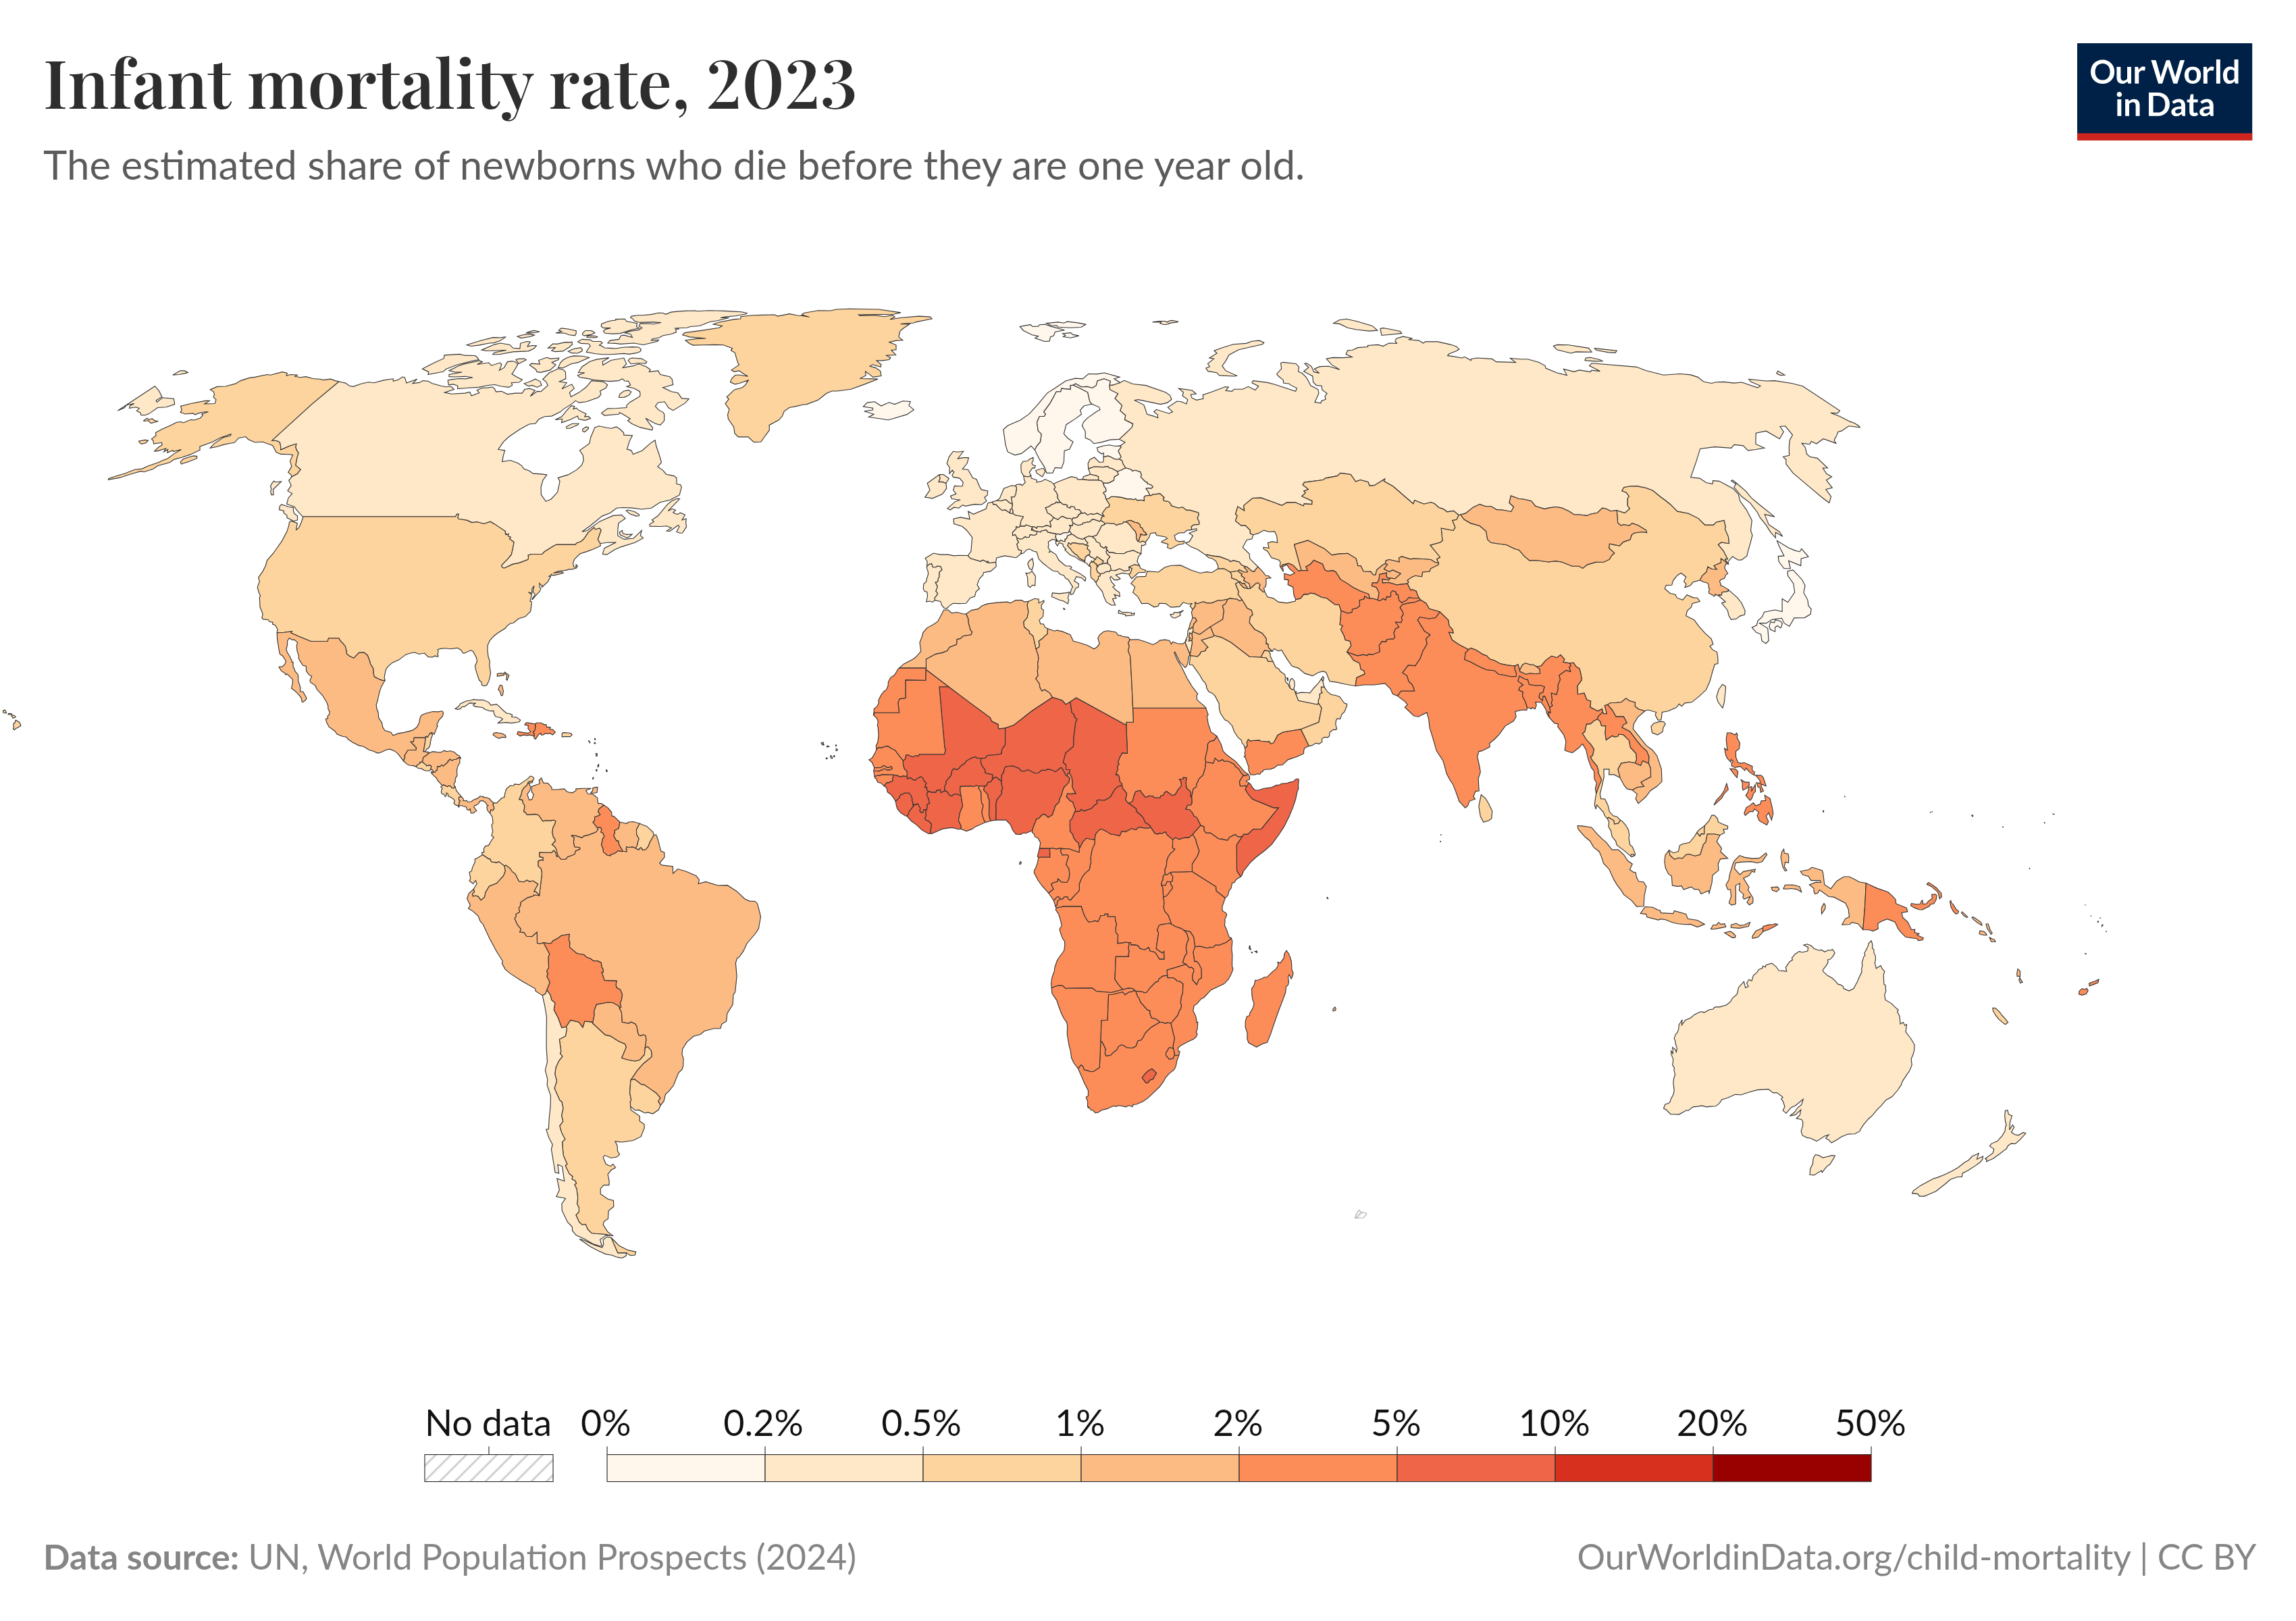
Infant Mortality Rate Map 2023
The "Infant Mortality Rate Map 2023" provides a comprehensive visual representation of the rates of infant deaths per 1,...
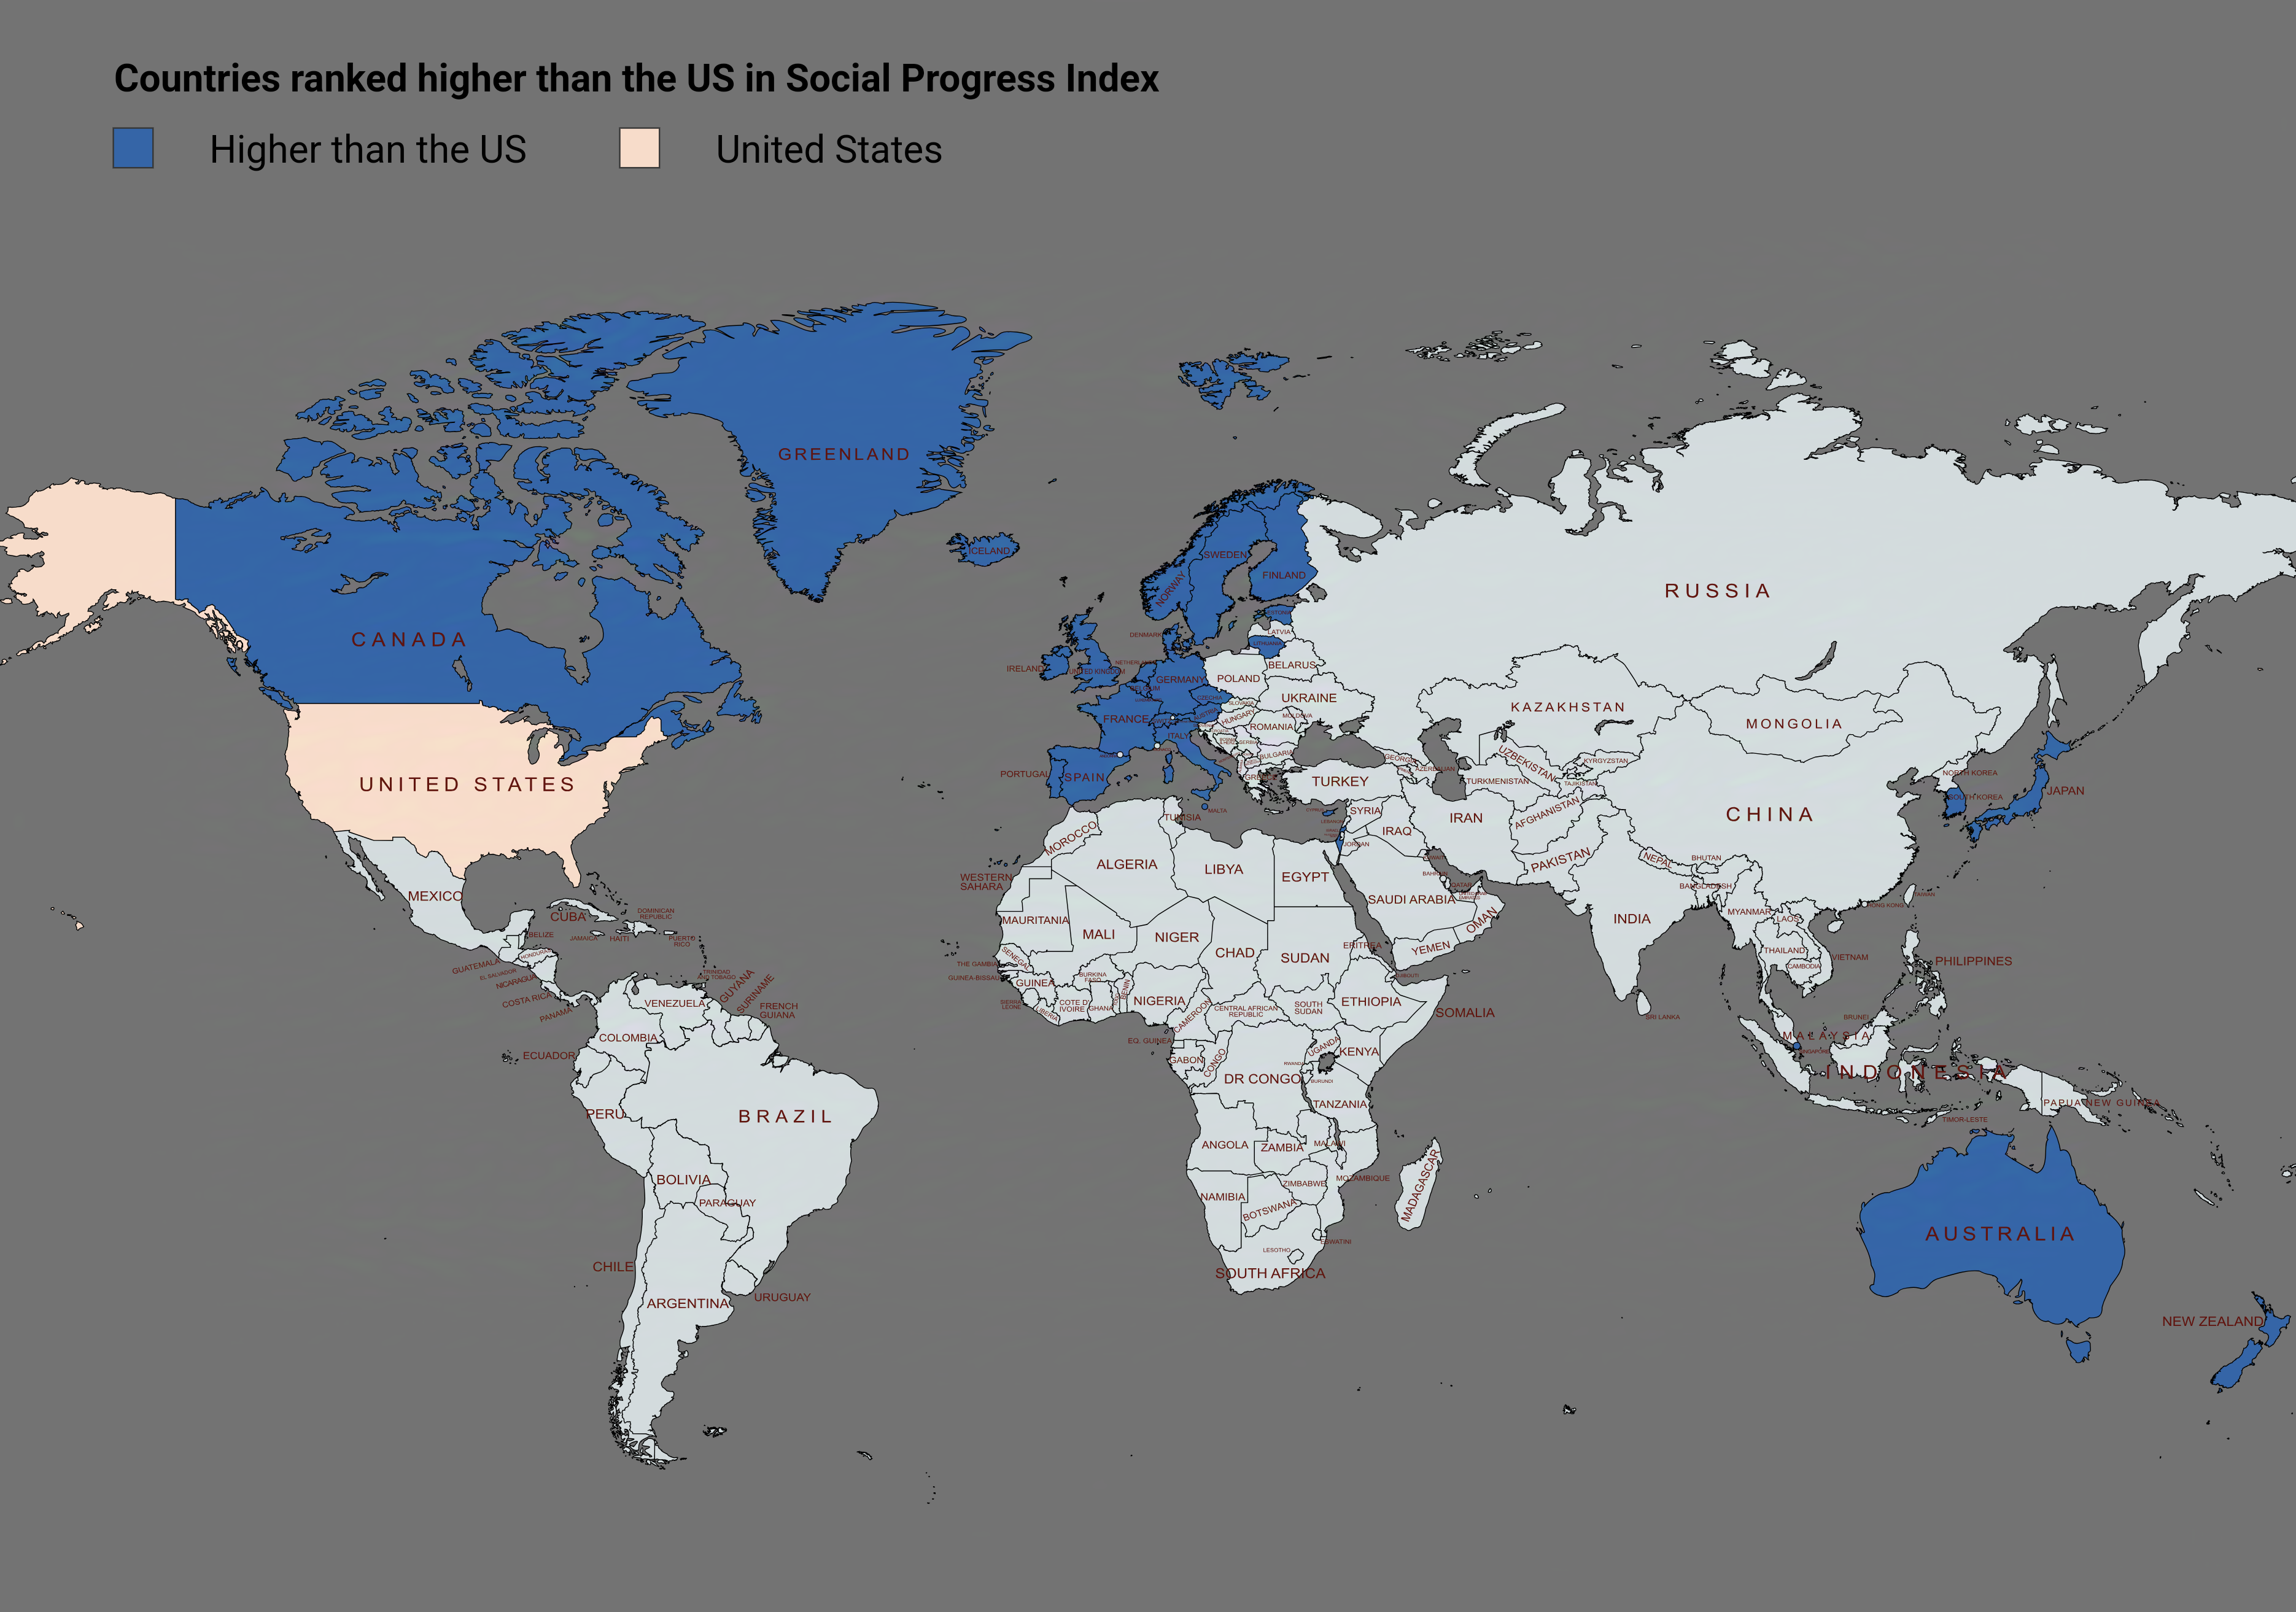
Social Progress Index Rankings Map by Country
The visualization titled "Countries Ranked Higher Than the US in Social Progress Index" provides a compelling overview o...
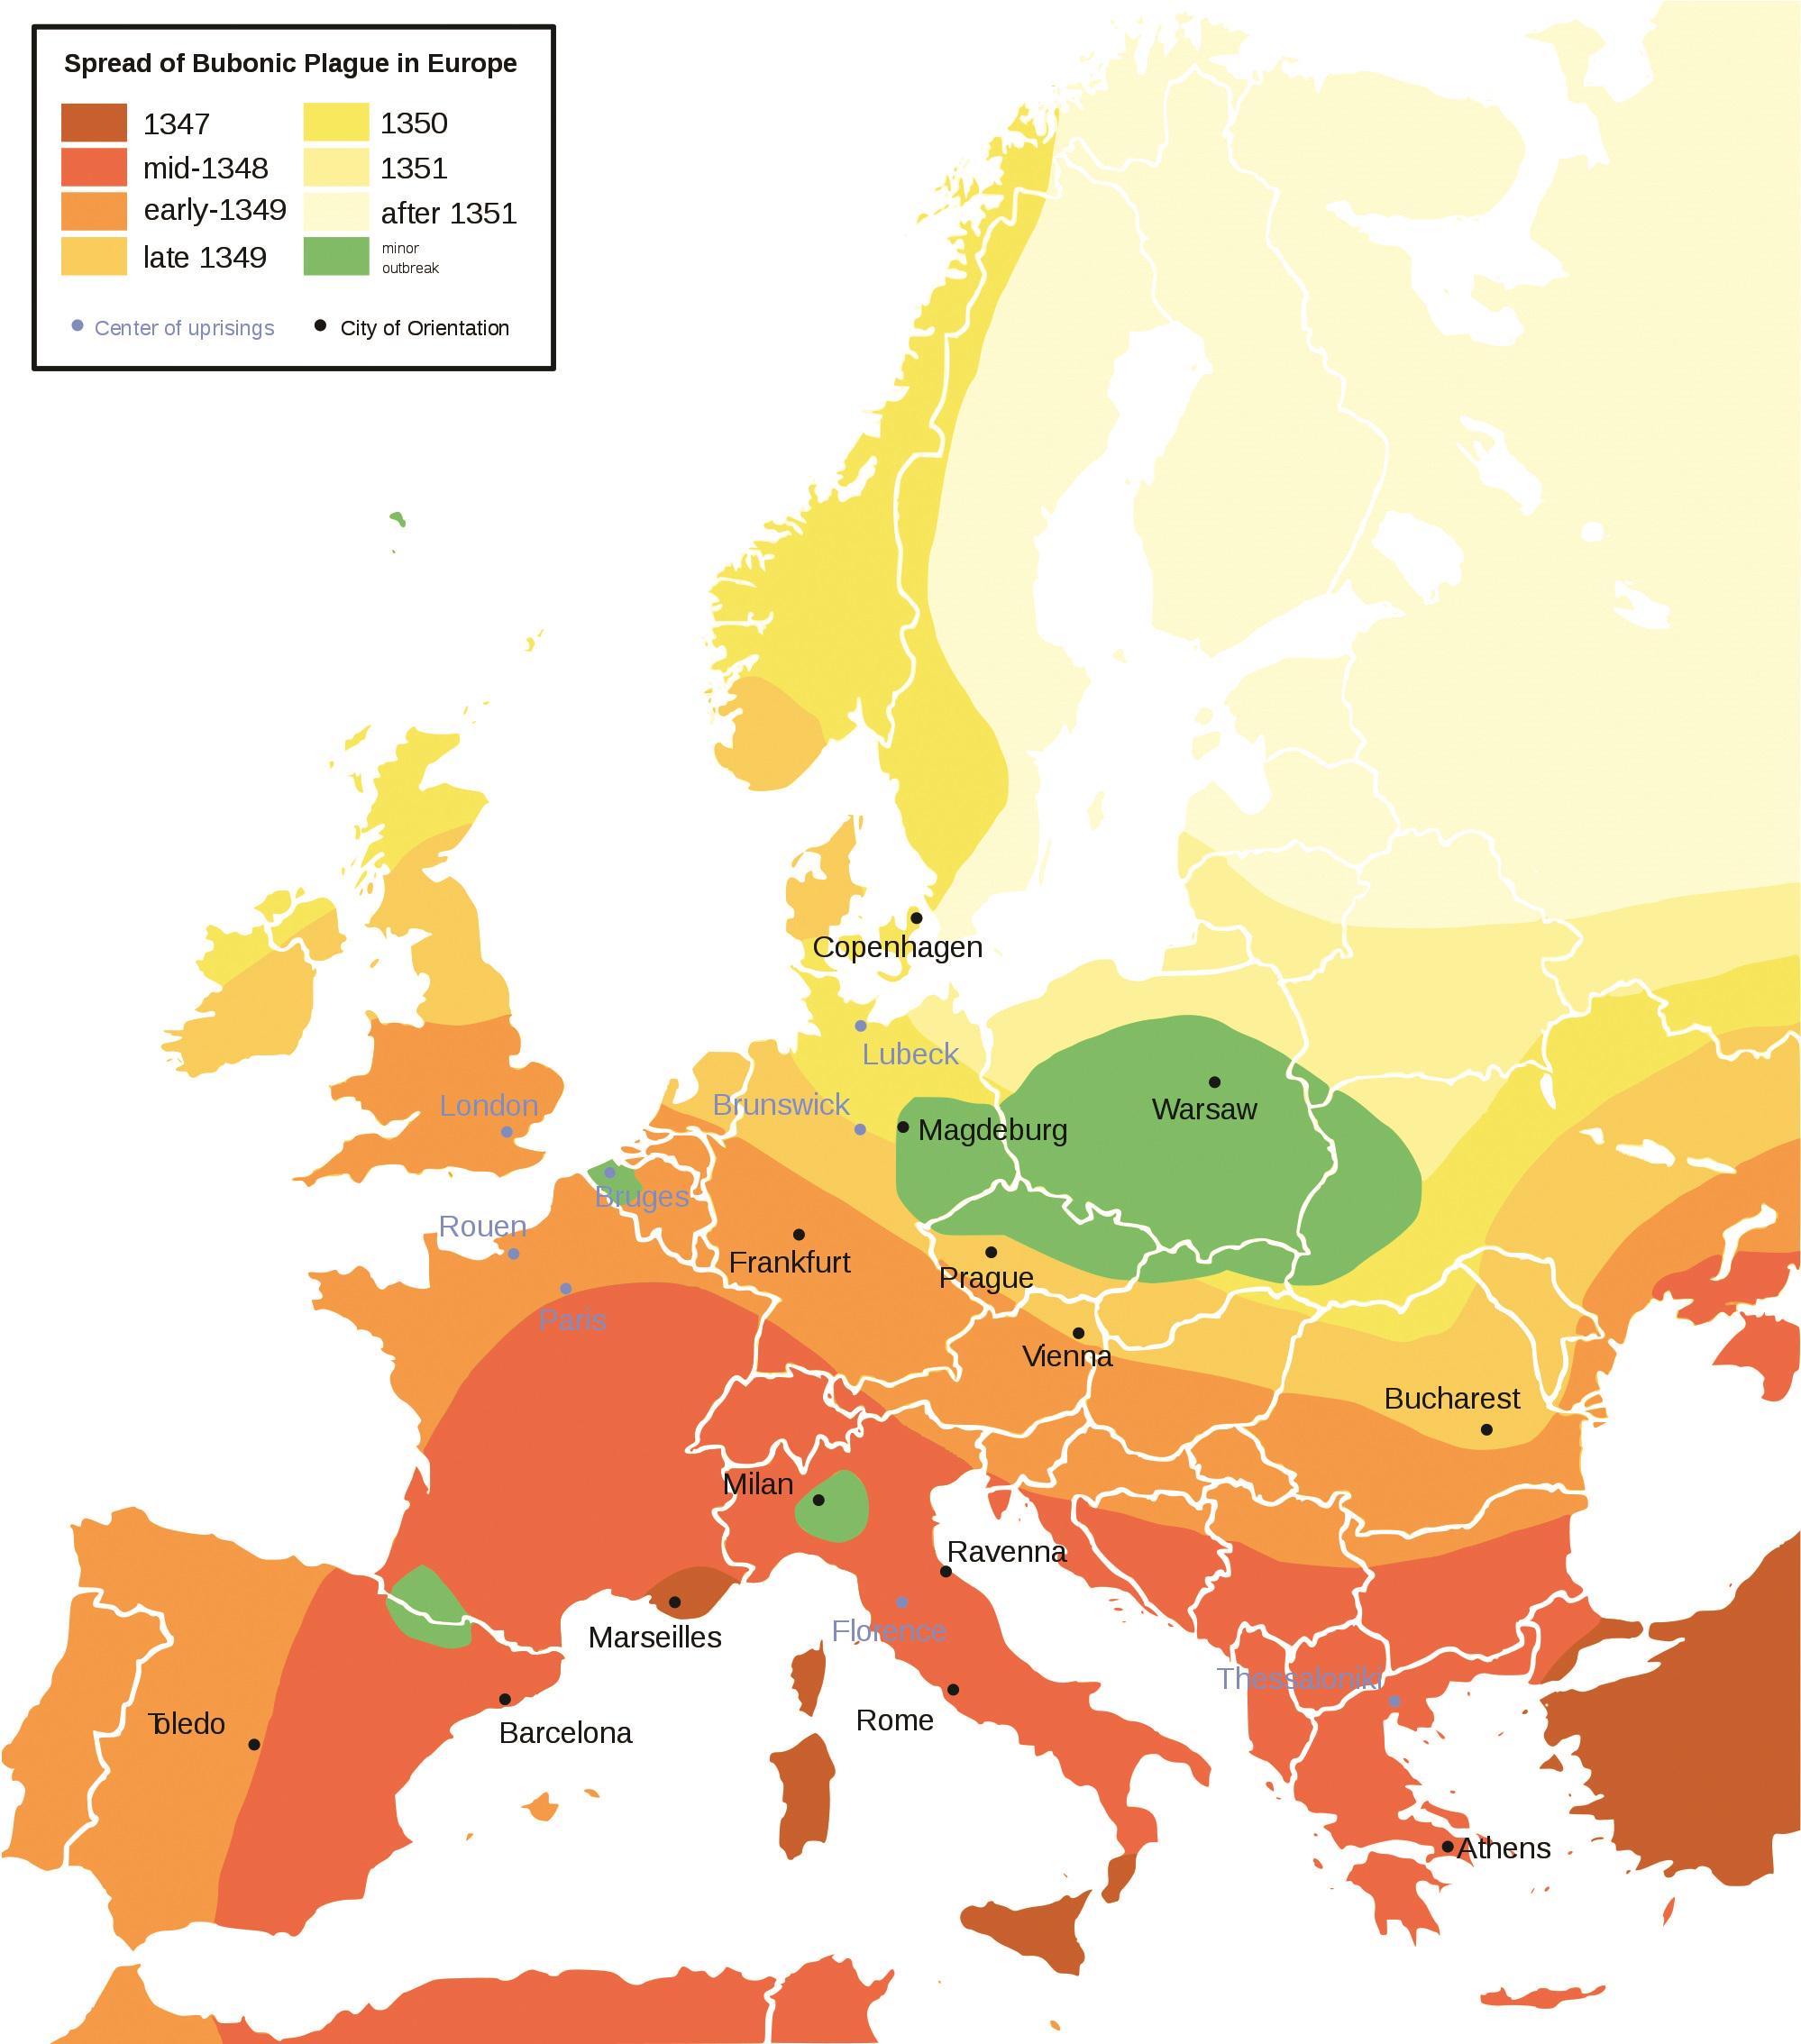
Spread of the Bubonic Plague in Europe Map
This map visually represents the spread of the Bubonic Plague across Europe during the 14th century, specifically highli...
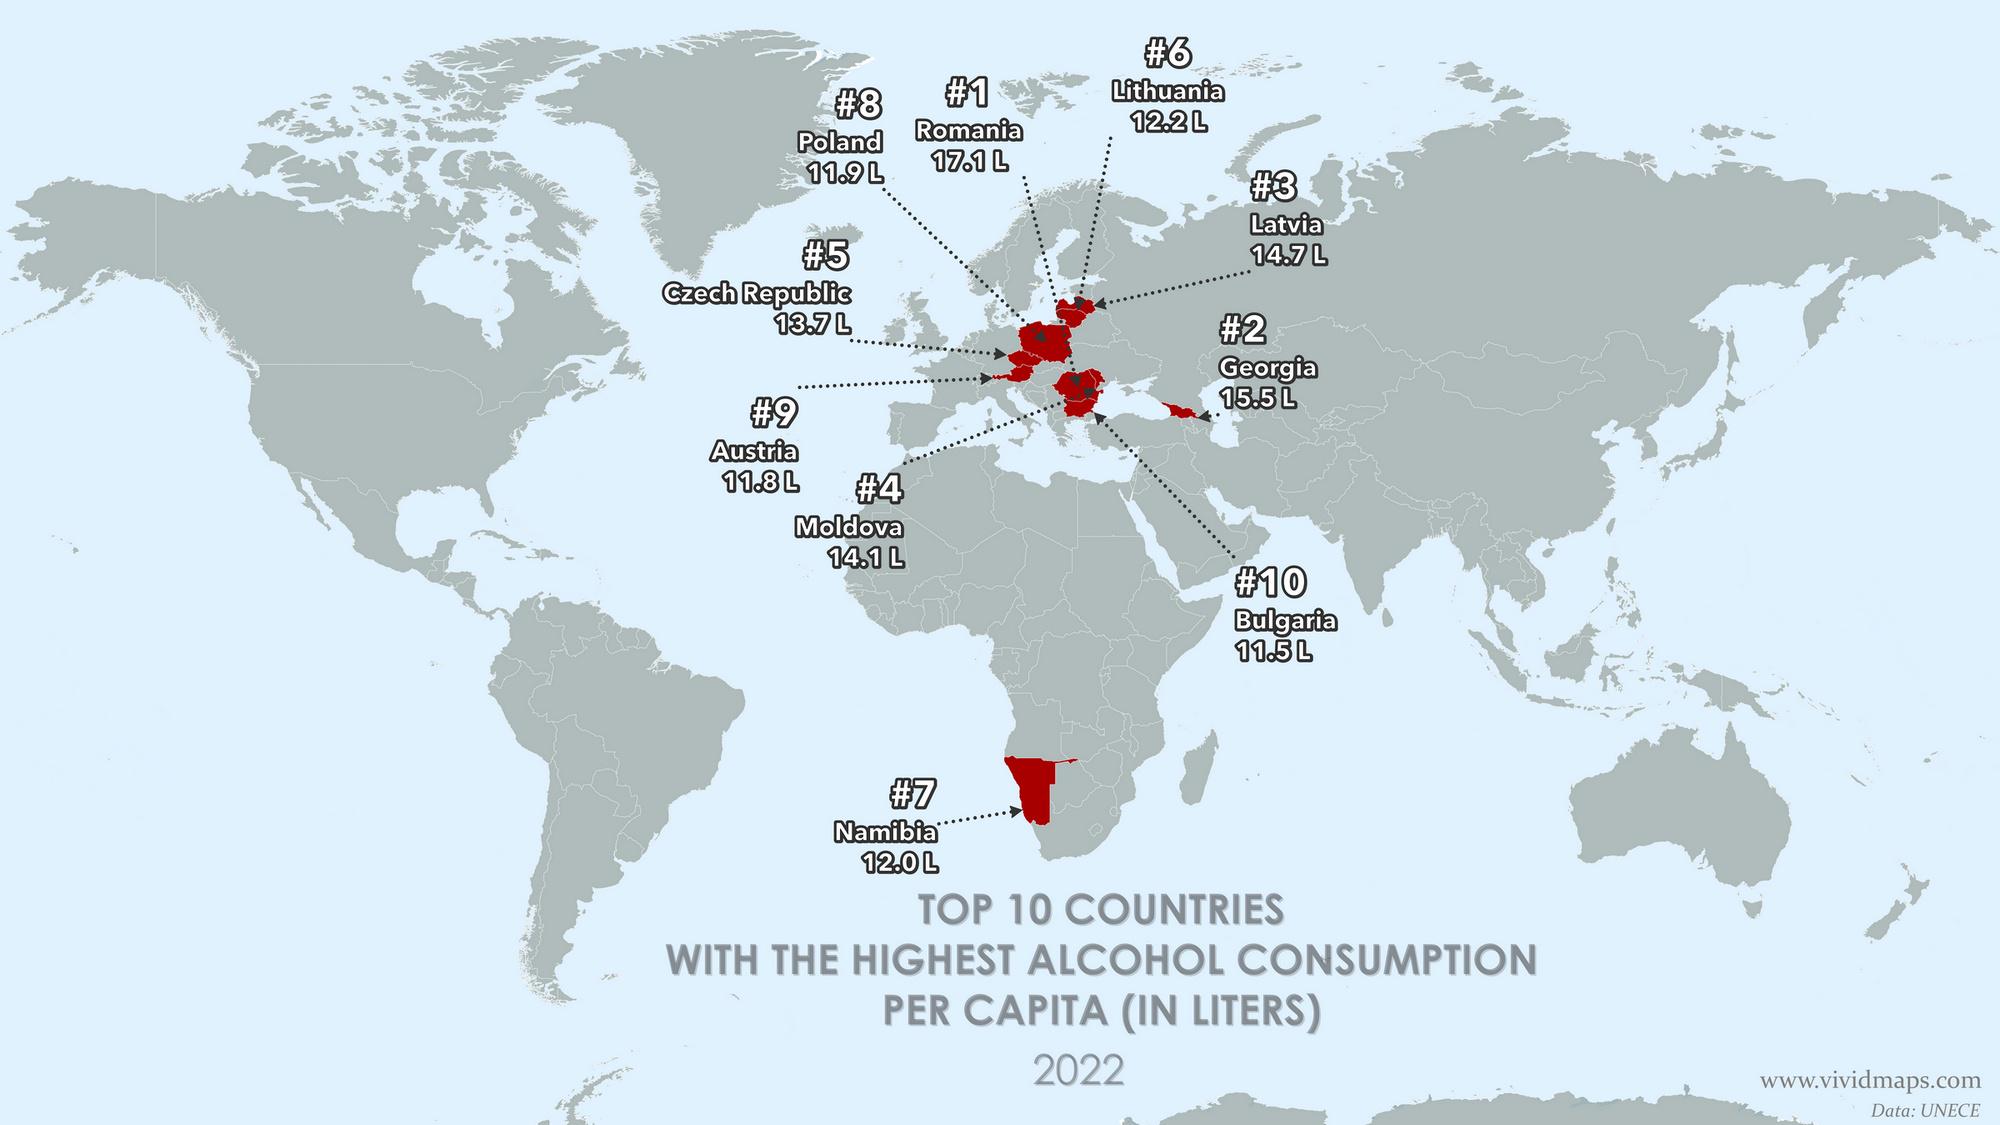
Top Countries by Alcohol Consumption Per Capita Map
The "Top 10 Countries by Alcohol Consumption Per Capita (2022)" map provides a clear visualization of the highest levels...
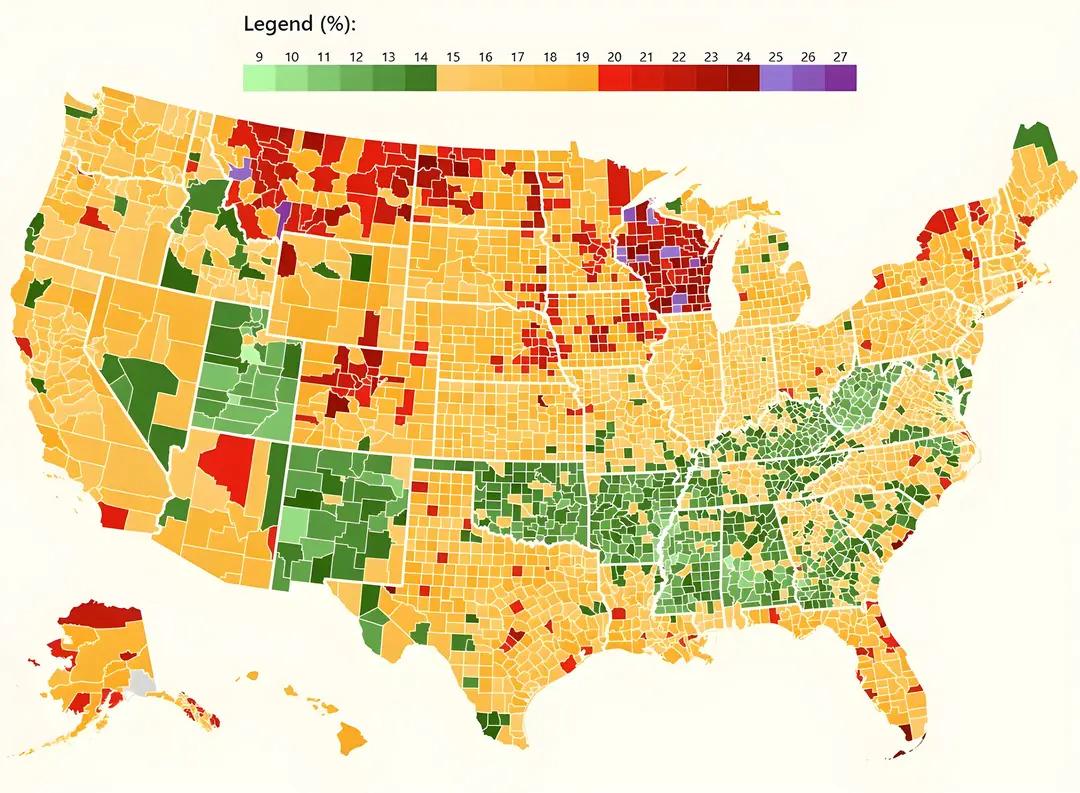
Map of Alcohol Consumption by U.S. County
The map titled "Map showing how much alcohol people drink in every U.S. county" provides a comprehensive overview of alc...
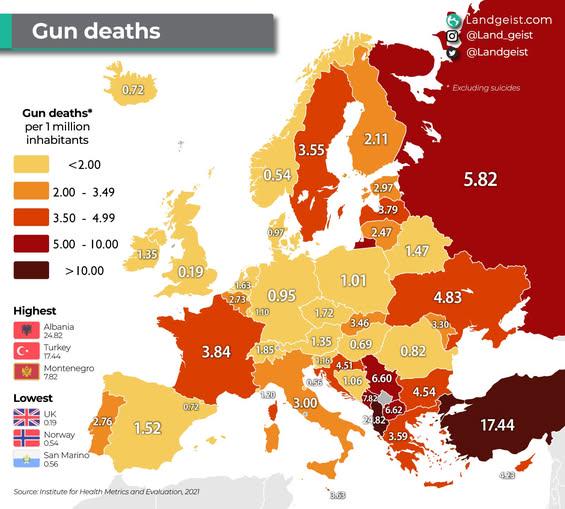
Gun Deaths by Country in Europe Map
The visualization titled "Gun Deaths by Country in Europe Map" presents a stark representation of firearm-related fatali...
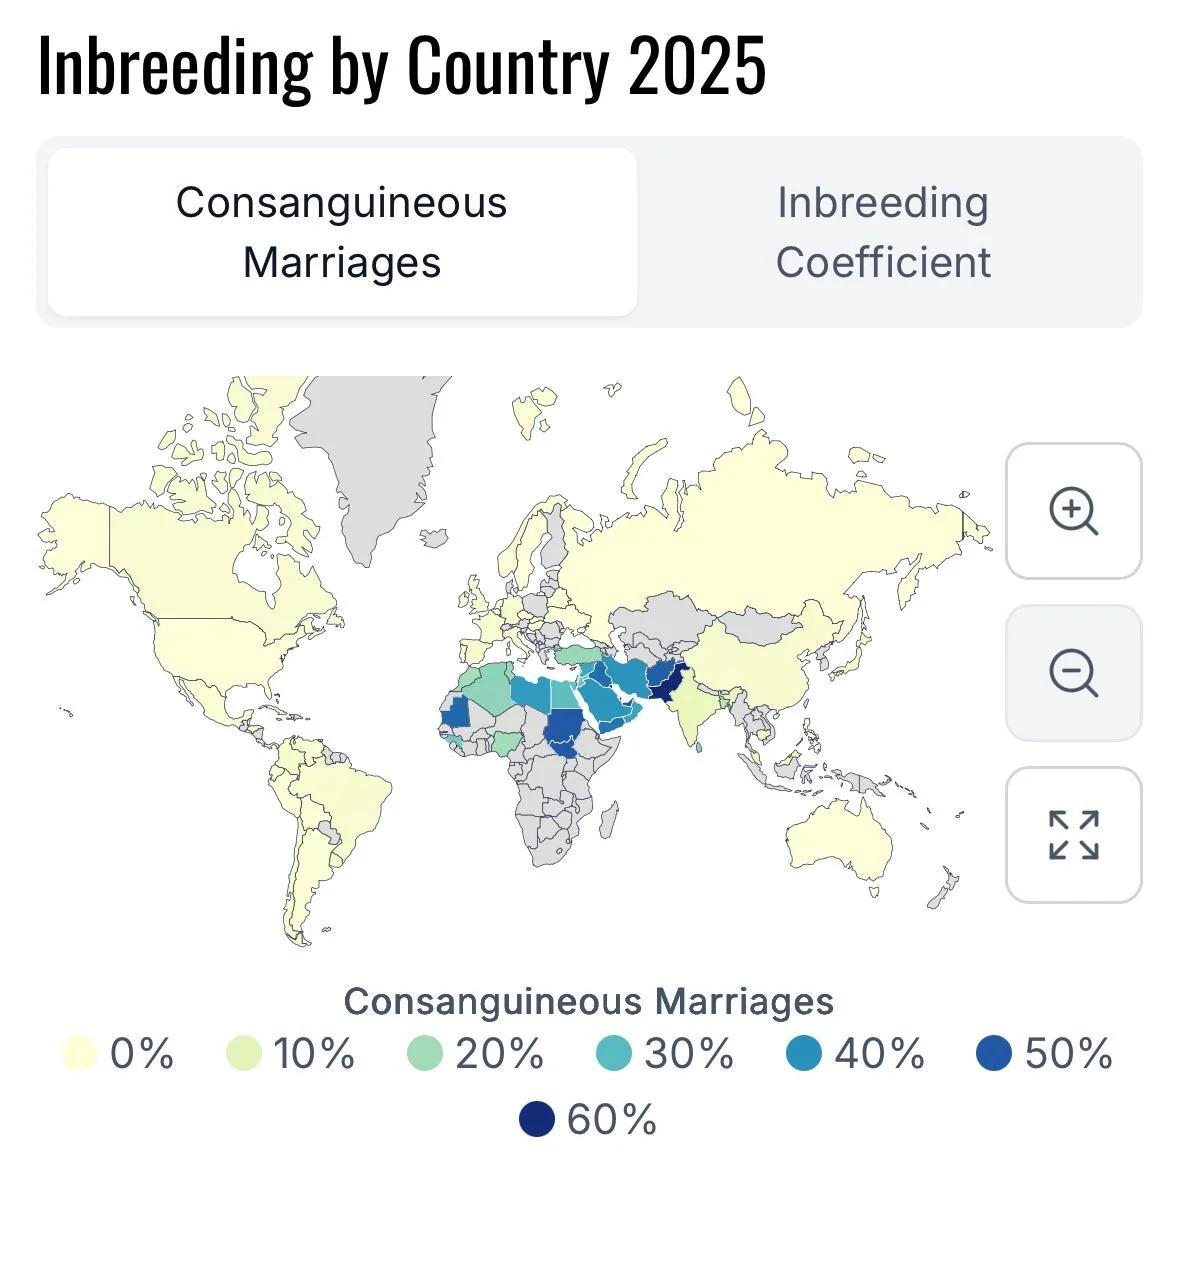
Consanguineous Marriage by Country Map
This map illustrates the prevalence of consanguineous marriages—unions between relatives—across different countries. Con...
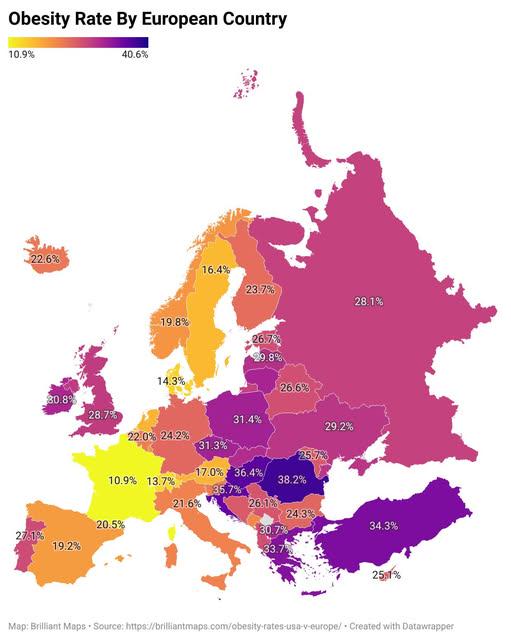
European Obesity Rate by Country Map
The "European Obesity Rate by Country Map" for 2024 offers a vivid depiction of the prevalence of obesity across various...
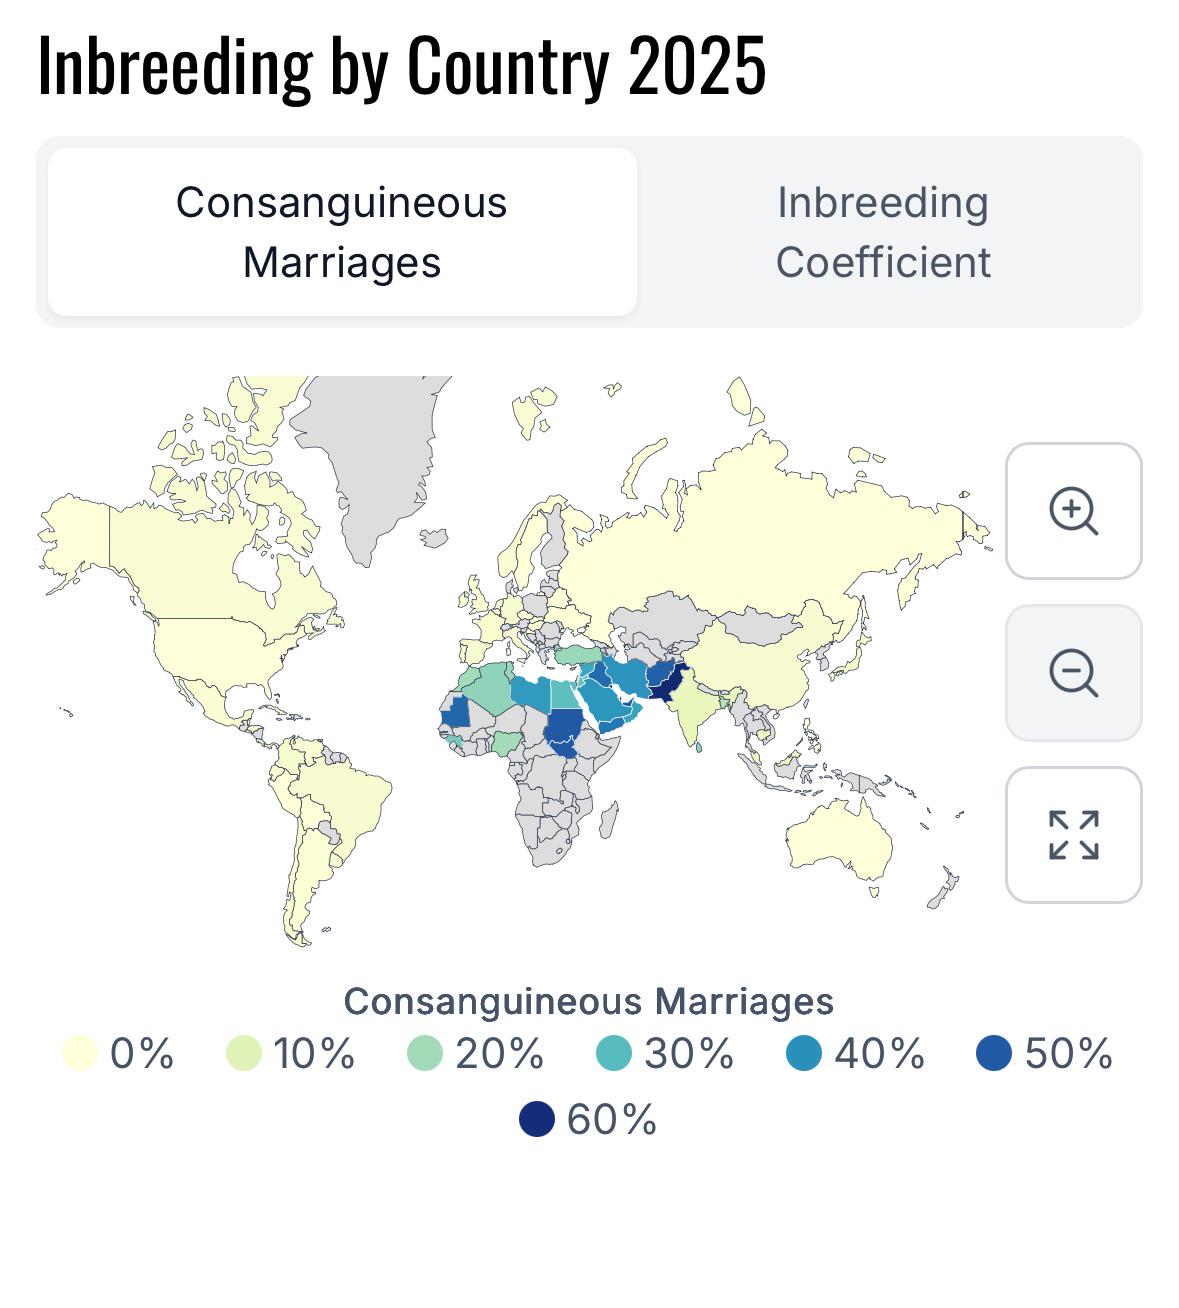
Inbreeding by Country 2025 Map
The "Inbreeding by Country 2025 Map" provides a visual representation of inbreeding rates across various nations. This m...
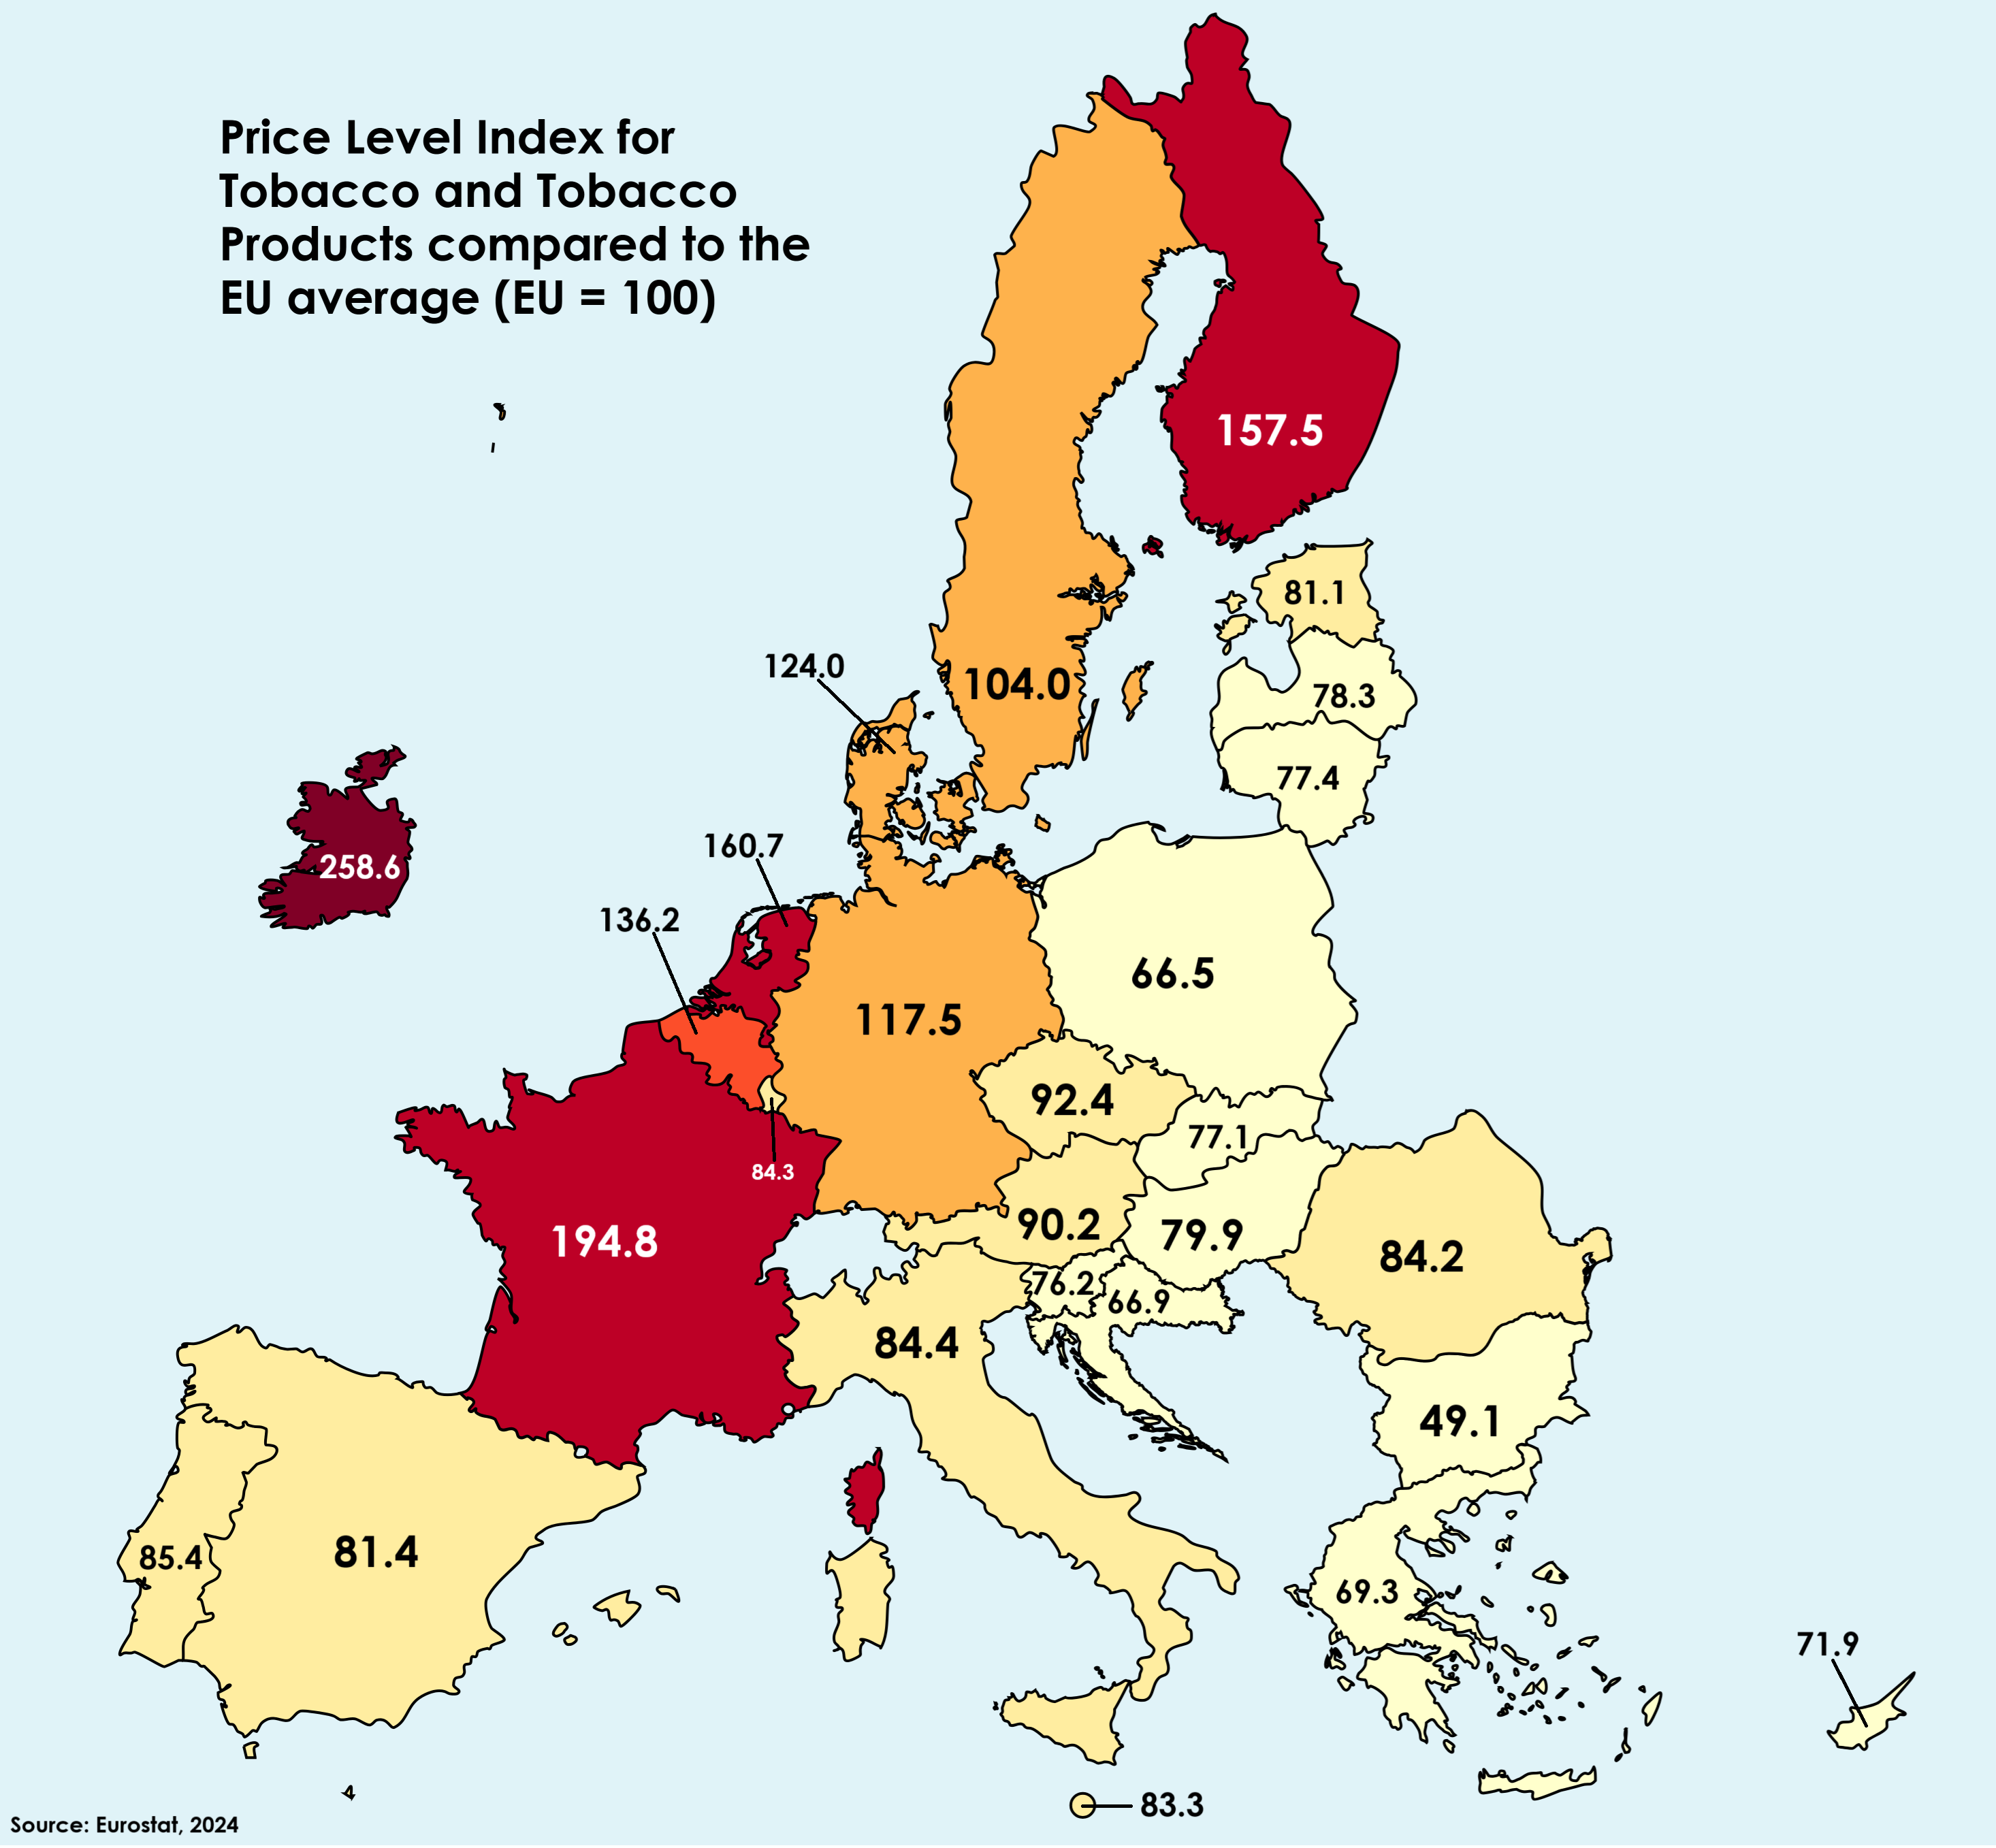
Tobacco Prices in EU Compared to Average Map
This map provides a comprehensive comparison of tobacco and tobacco product prices across various countries in the Europ...
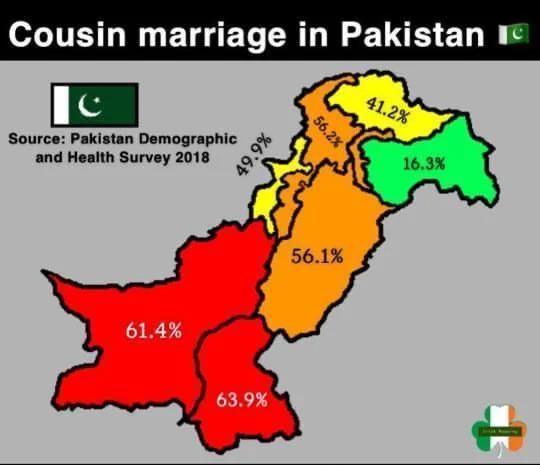
Rates of Consanguinity in Pakistan Map
The "Rates of Consanguinity in Pakistan Map" provides a compelling visual representation of the prevalence of consanguin...
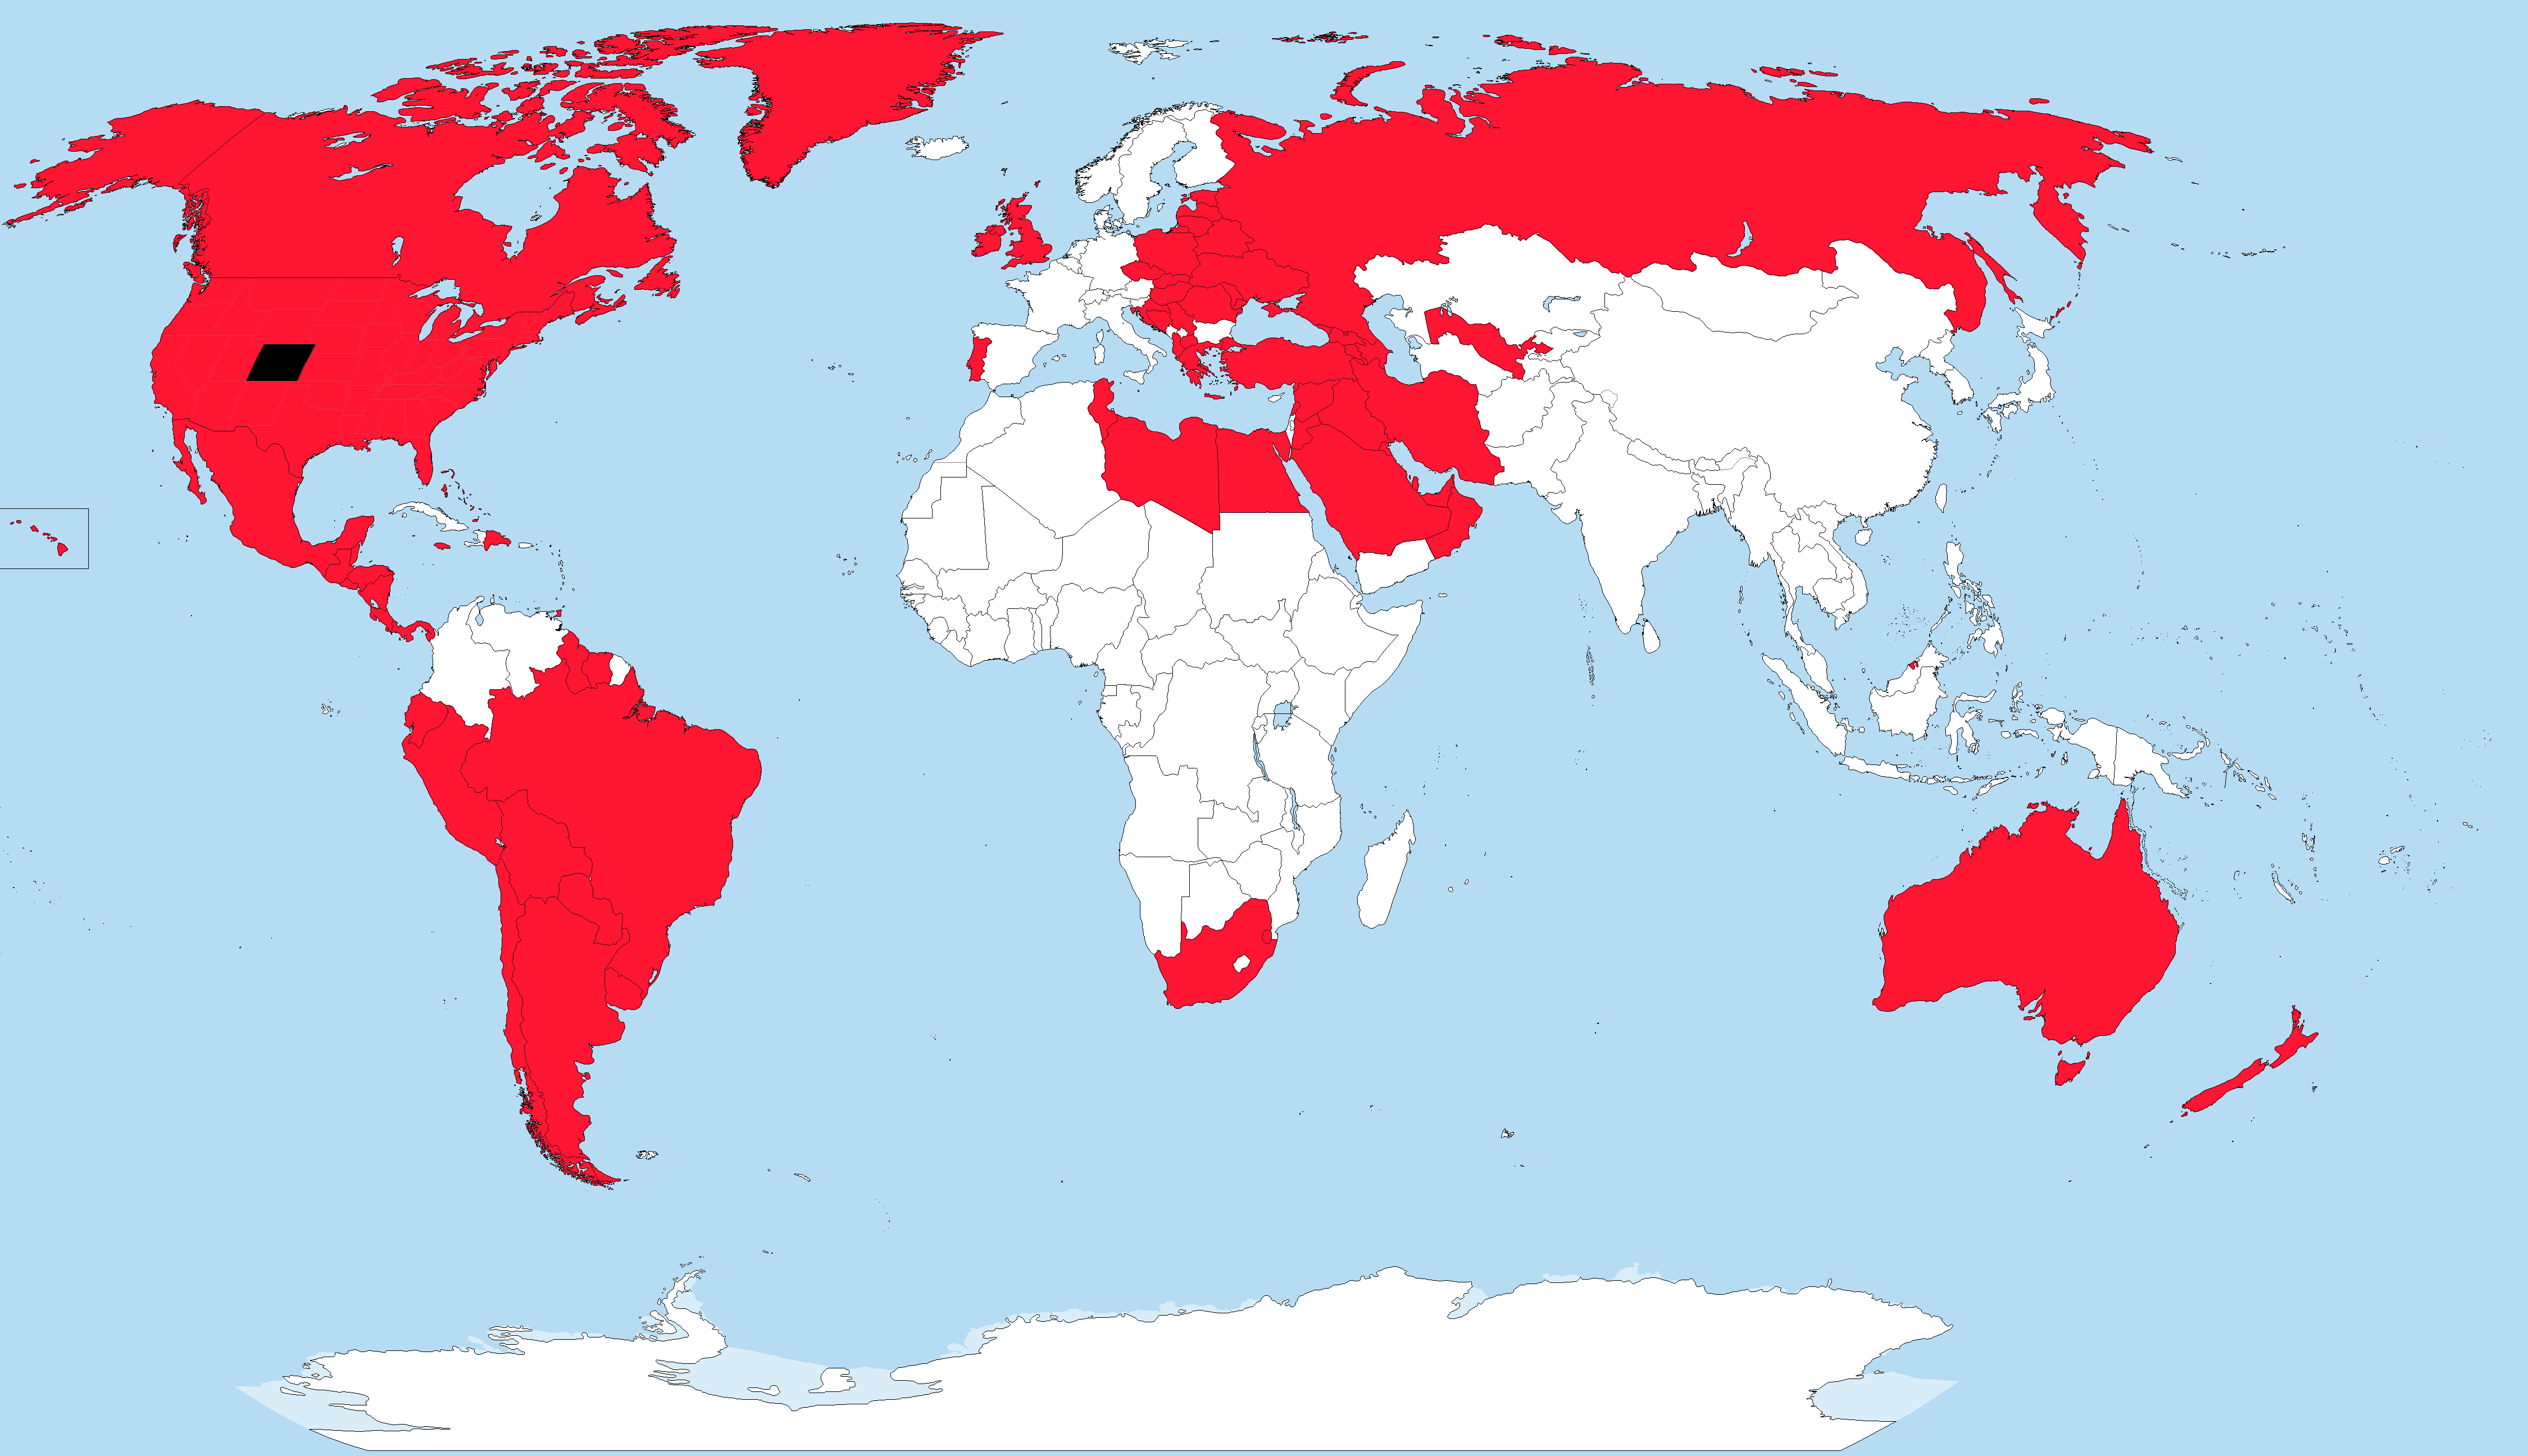
Obesity Rates Compared to Colorado Map
The visualization illustrates the obesity rates across various countries and states, highlighting those with a higher pr...
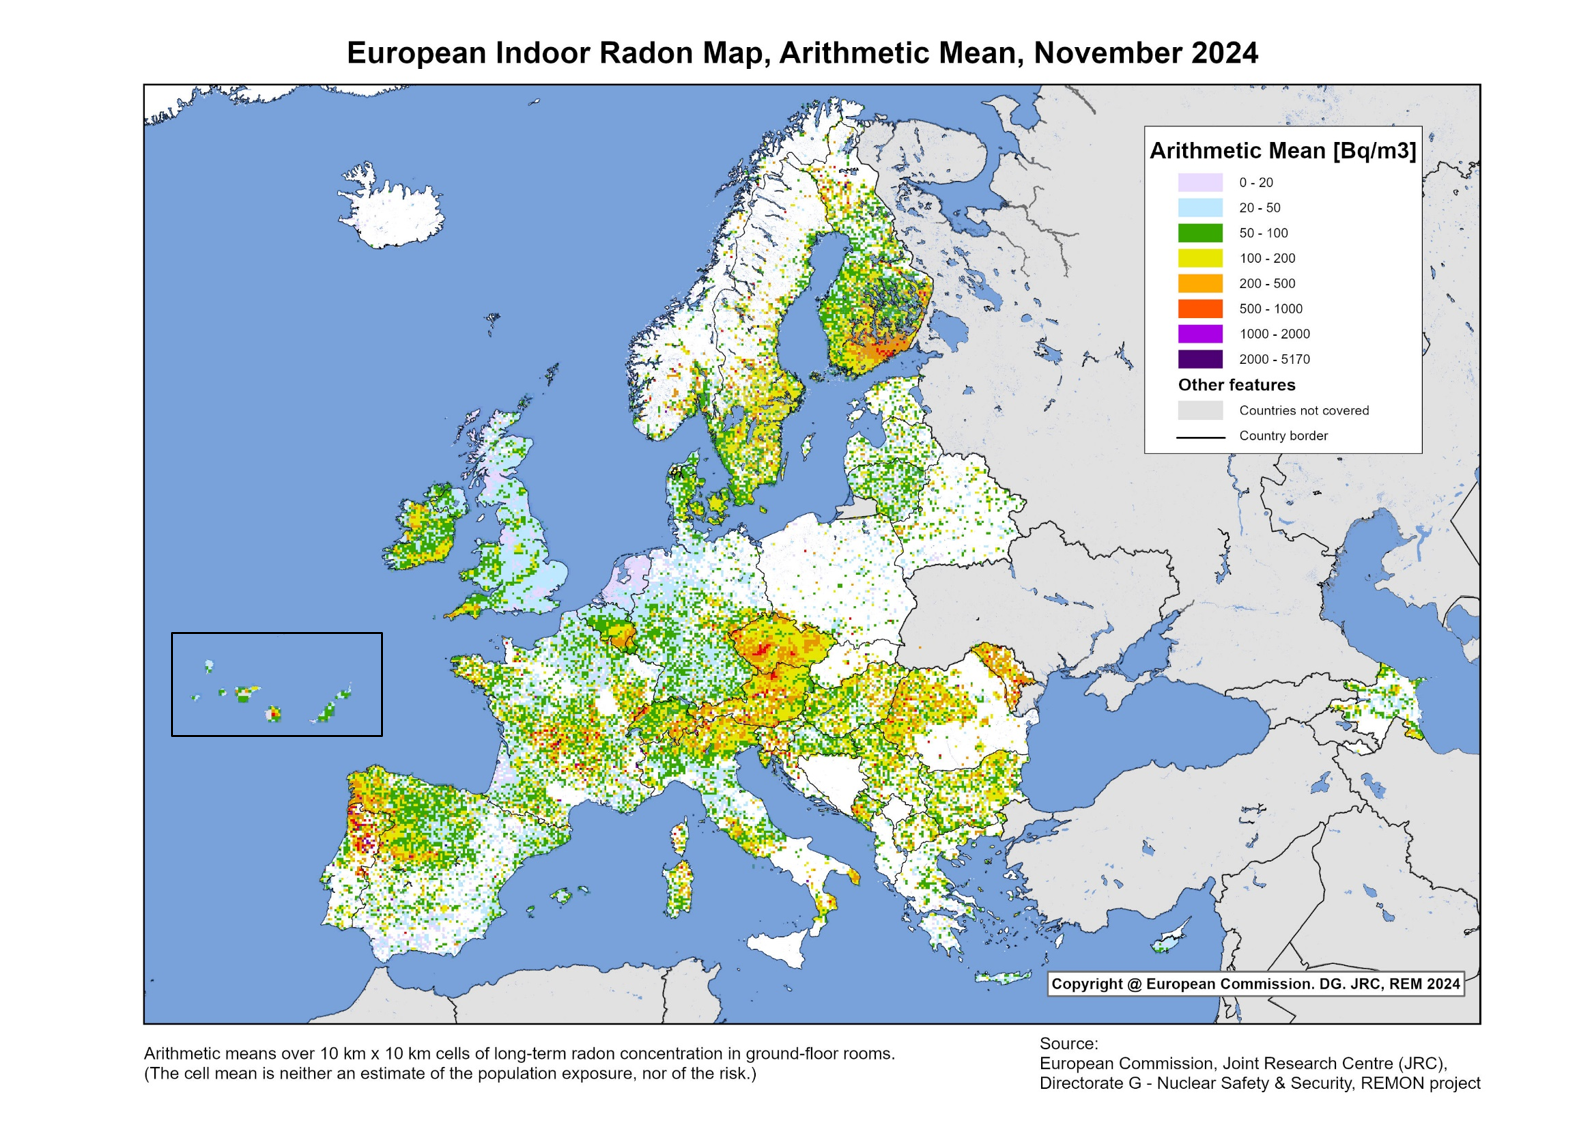
European Indoor Radon Levels Map
The European Indoor Radon Map is a comprehensive visualization that highlights the levels of radon gas found indoors acr...
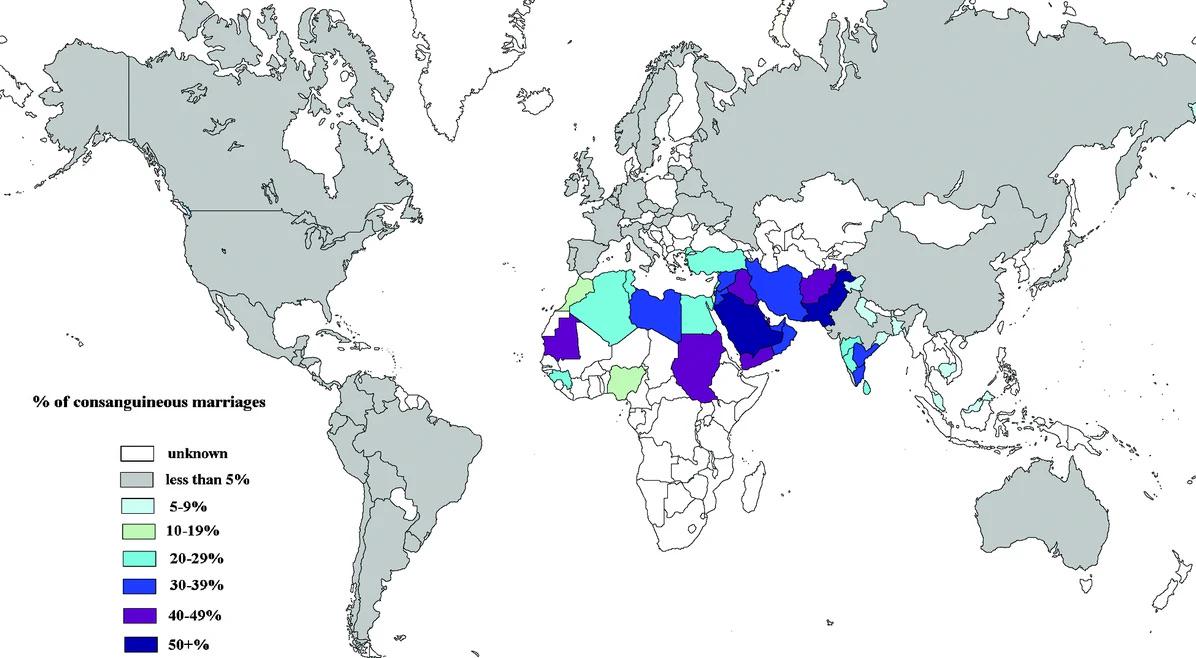
Consanguineous Marriage Rates by Country Map
The "Global Consanguineous Marriage Rates by Country" map provides a compelling visual representation of the prevalence ...
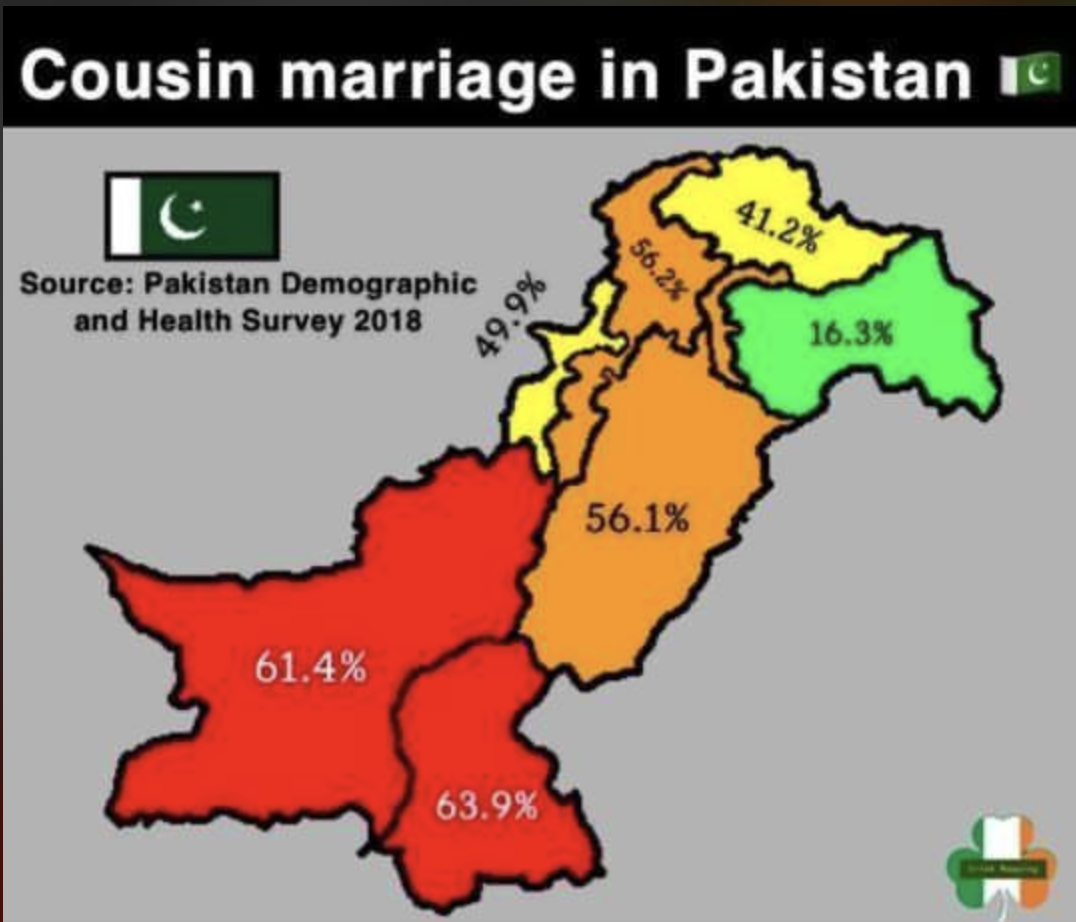
Cousin Marriage Rate in Pakistan Map
The "Cousin Marriage Rate in Pakistan (2018)" map visualizes the prevalence of cousin marriages across various regions o...
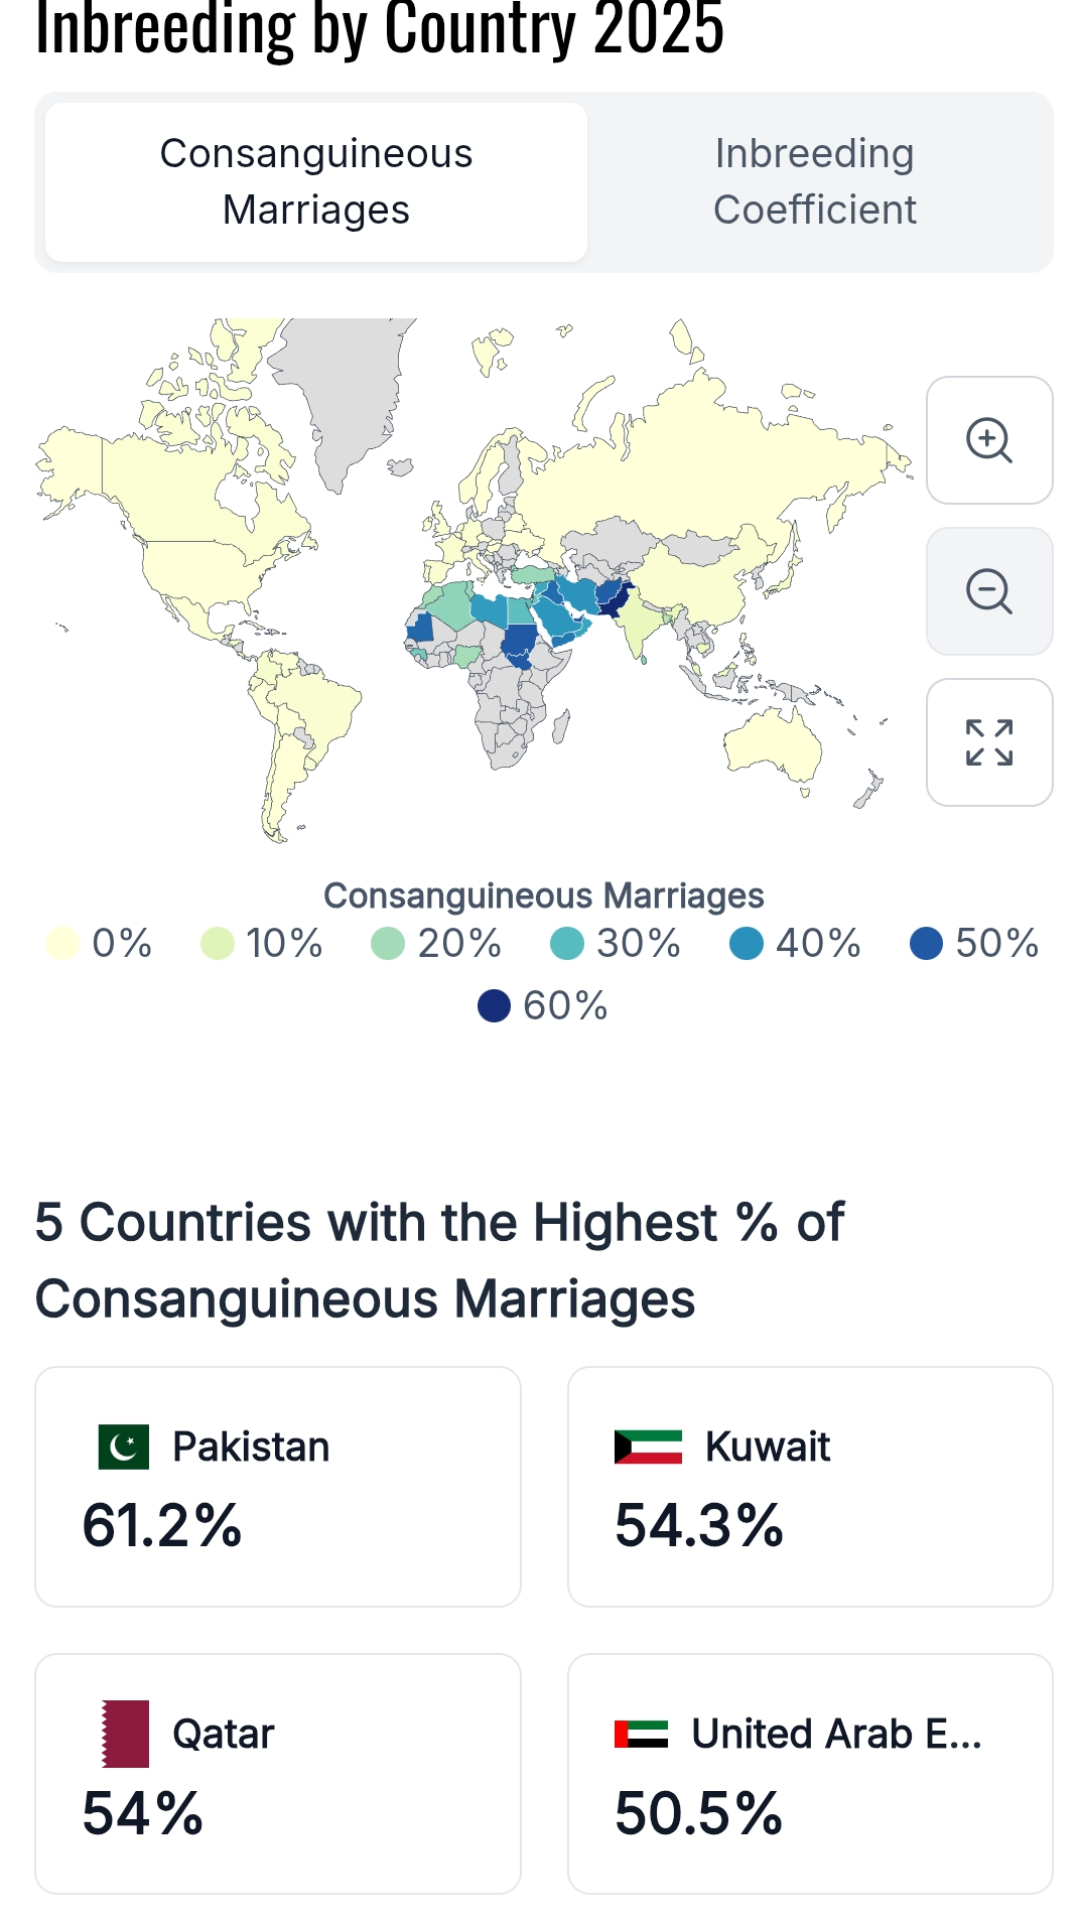
Consanguinity Rates by Country Map
This map presents an estimated percentage of children globally who are born to consanguineous parents, defined as parent...
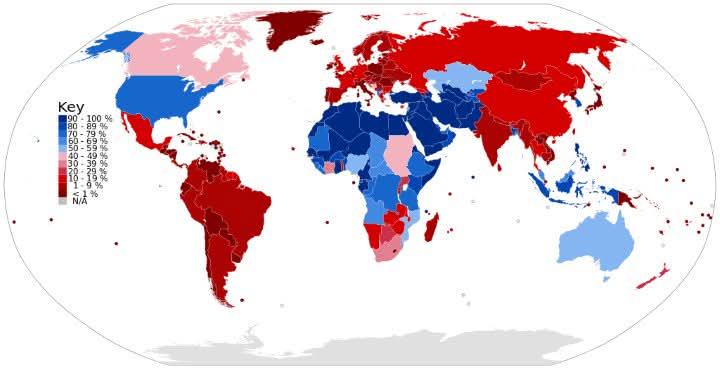
Male Circumcision Rates by Country Map
The "Male Circumcision Rates by Country Map" provides a comprehensive overview of the prevalence of male circumcision ac...
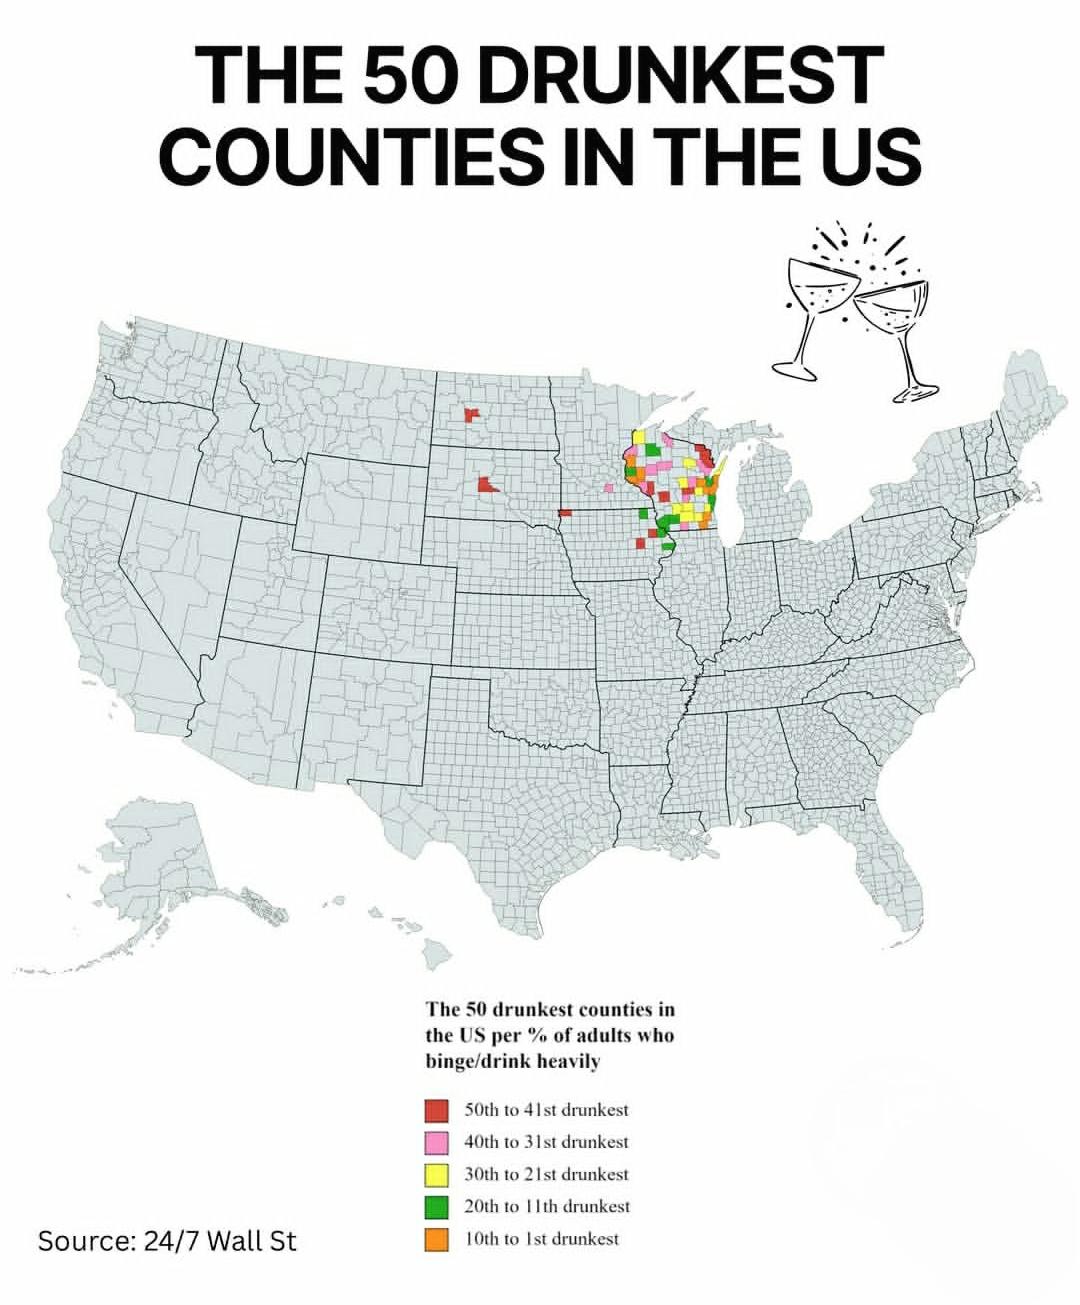
Drunkest Counties in the US Map
The "Drunkest Counties in the US" map provides a stark visual representation of alcohol consumption patterns across vari...
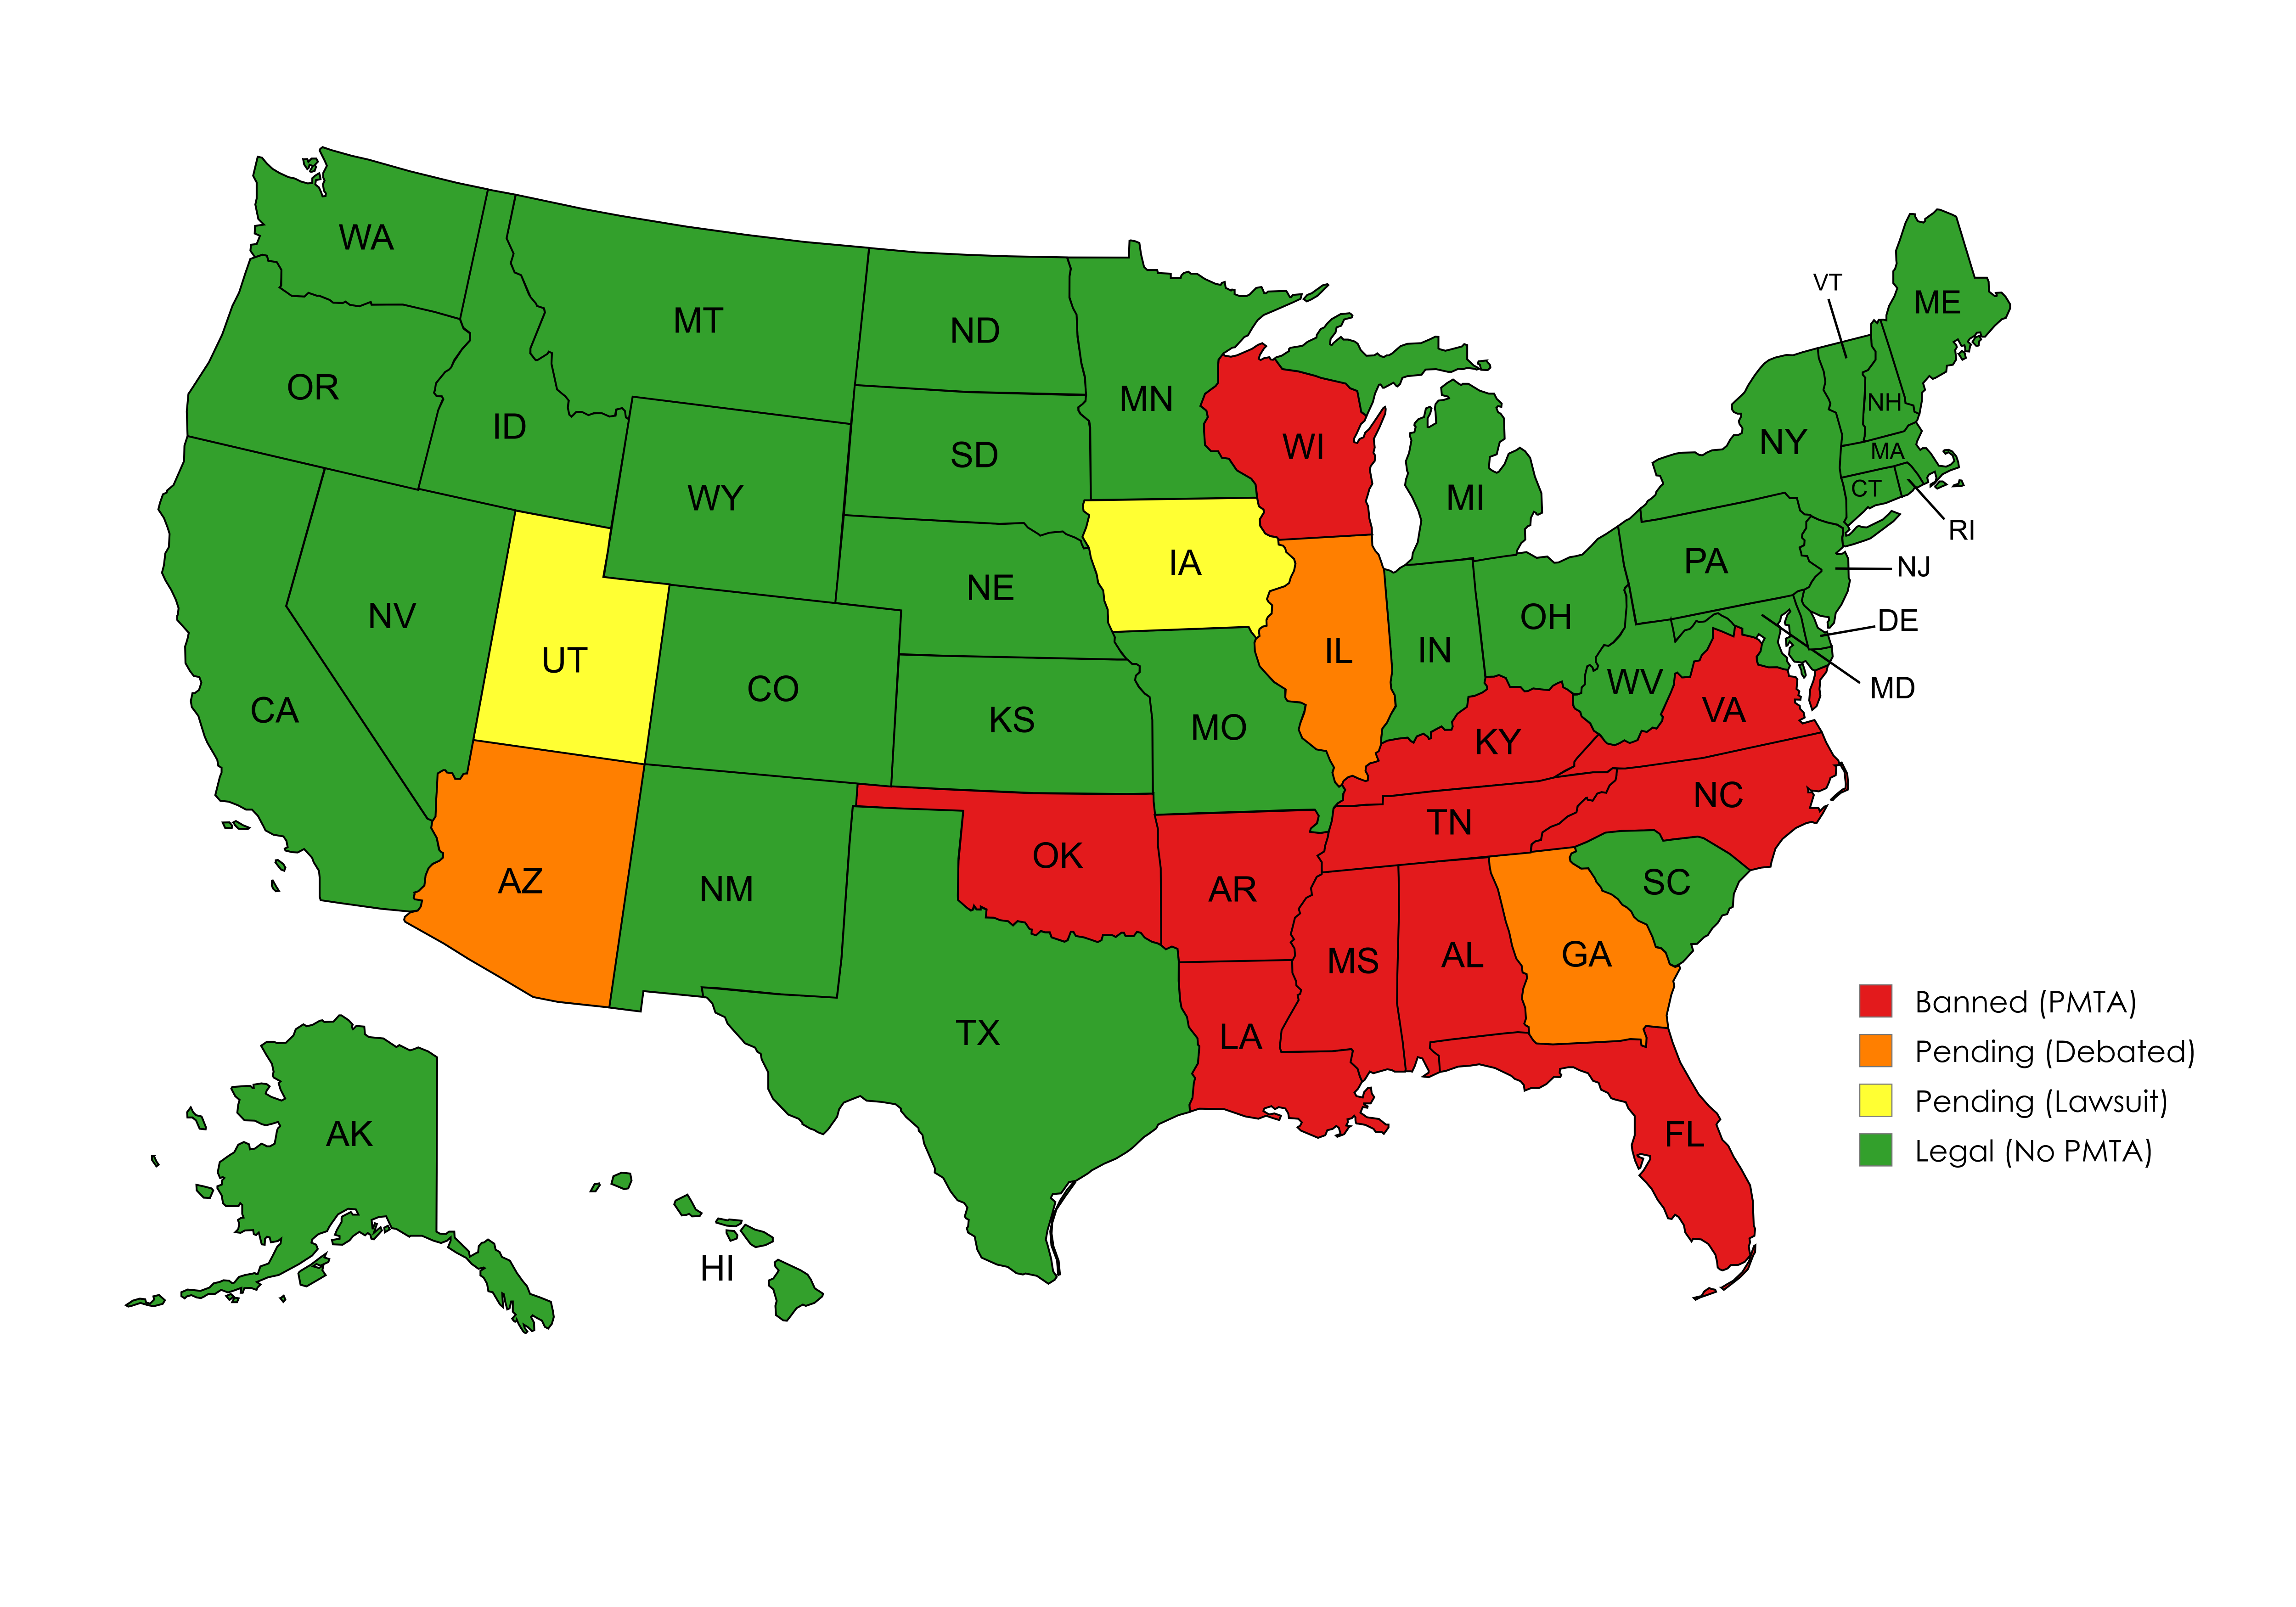
2025 Vape Ban States Map
The map titled "2025 Vape Ban (PMTA Registry) | As of 9/9/25" illustrates the states that have enacted bans on non-FDA a...
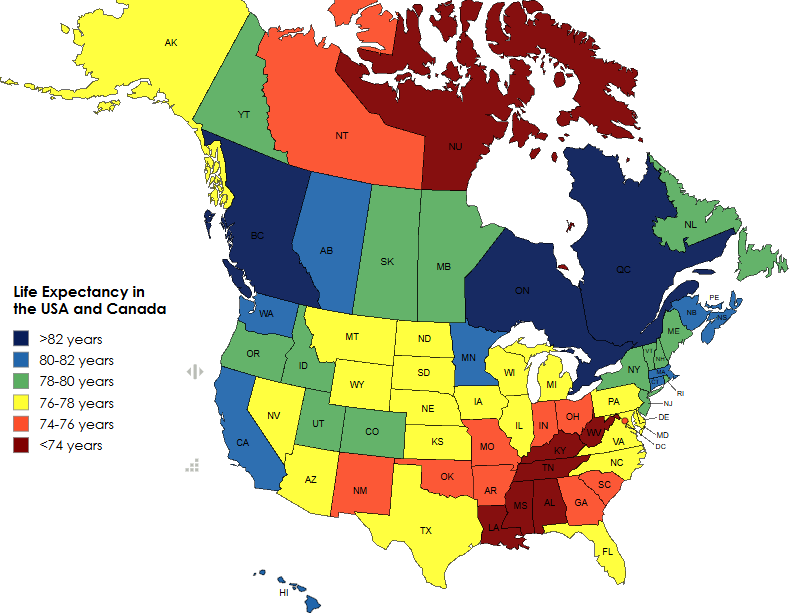
Life Expectancy in the USA and Canada Map
The 'Life Expectancy in the USA and Canada Map' provides a visual representation of the average life expectancy across v...
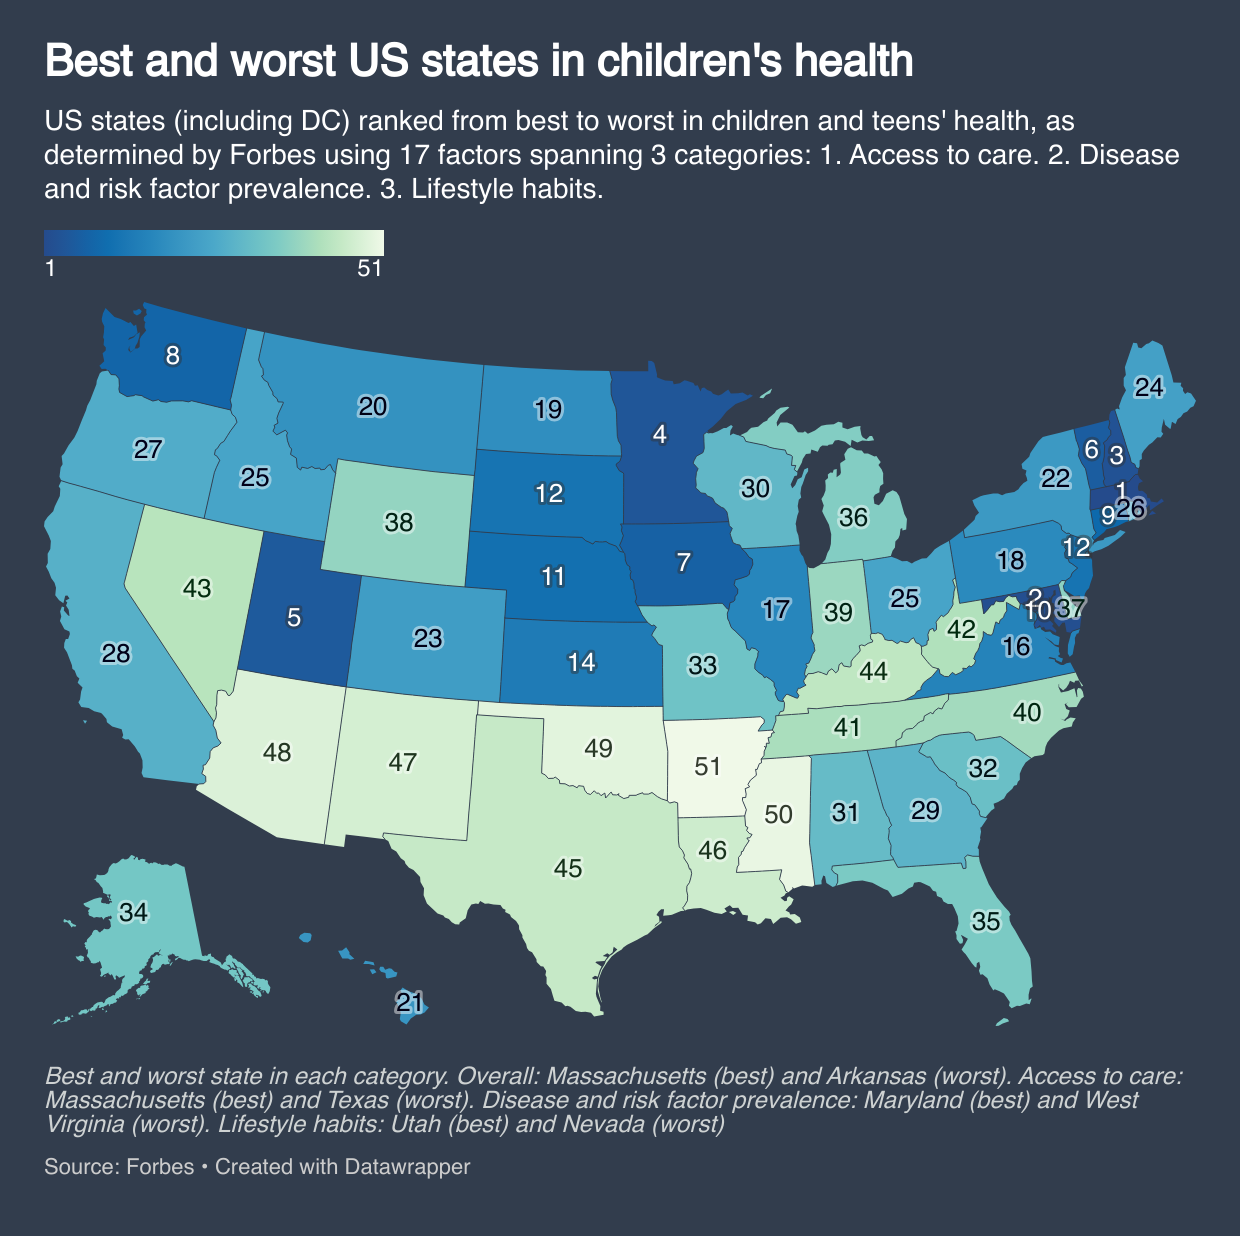
Children's Health Rankings by State Map
The "Best and Worst US States in Children's Health" map provides a comprehensive overview of the varying health outcomes...

Public Bathroom Locations Map in Finland
...
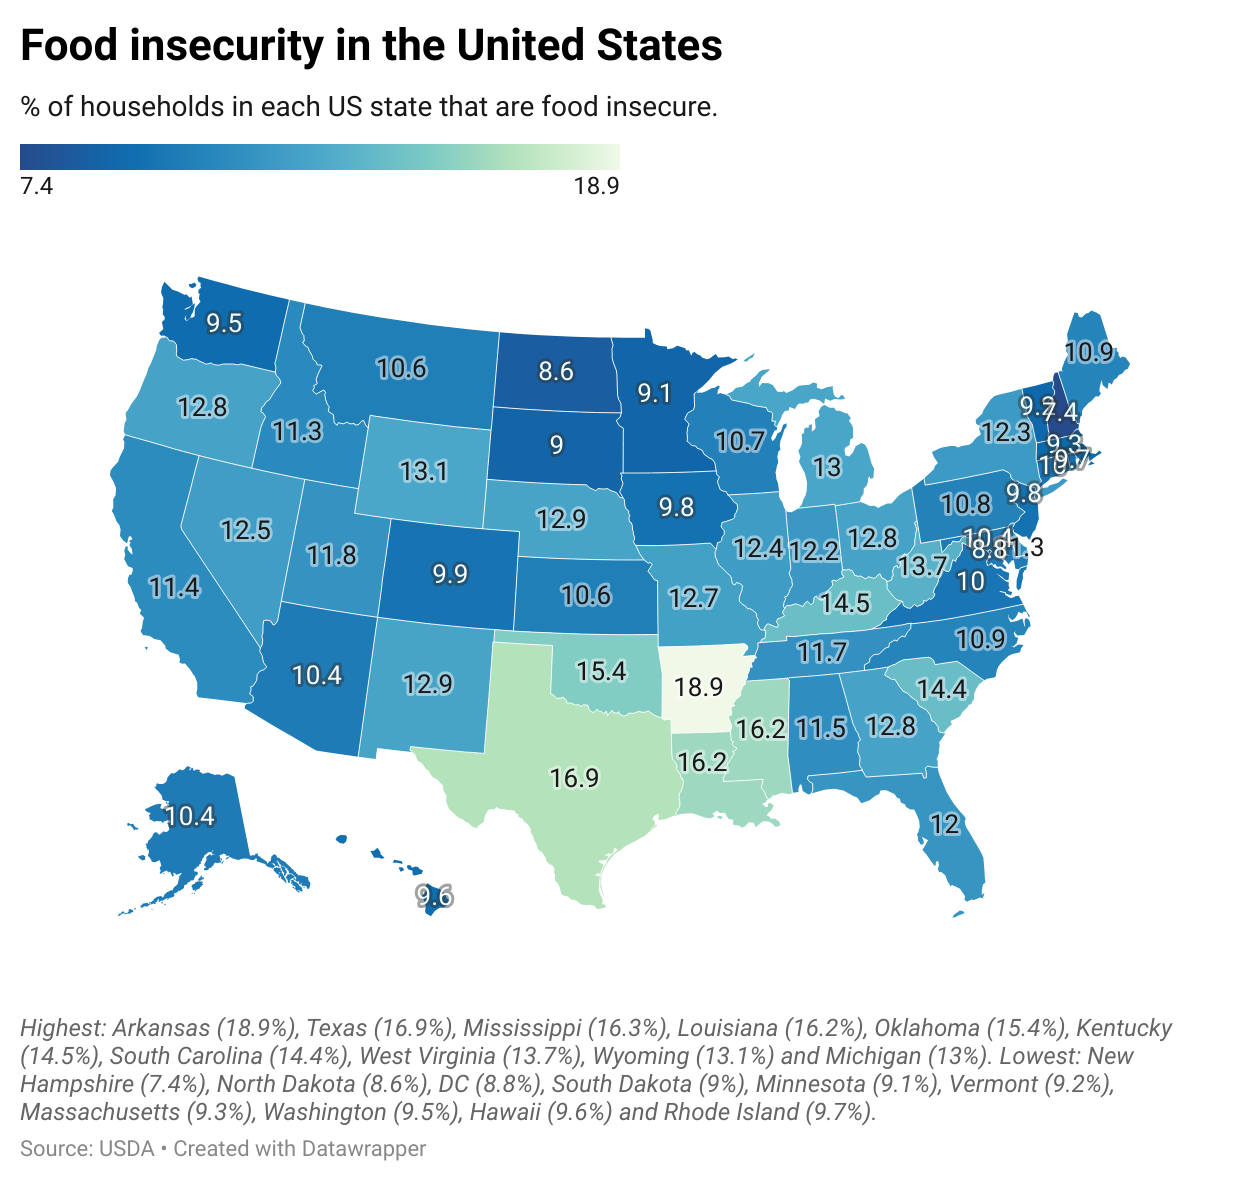
Food Insecurity in the United States Map
The "Food Insecurity in the United States Map" provides an intricate view of the varying levels of food insecurity acros...
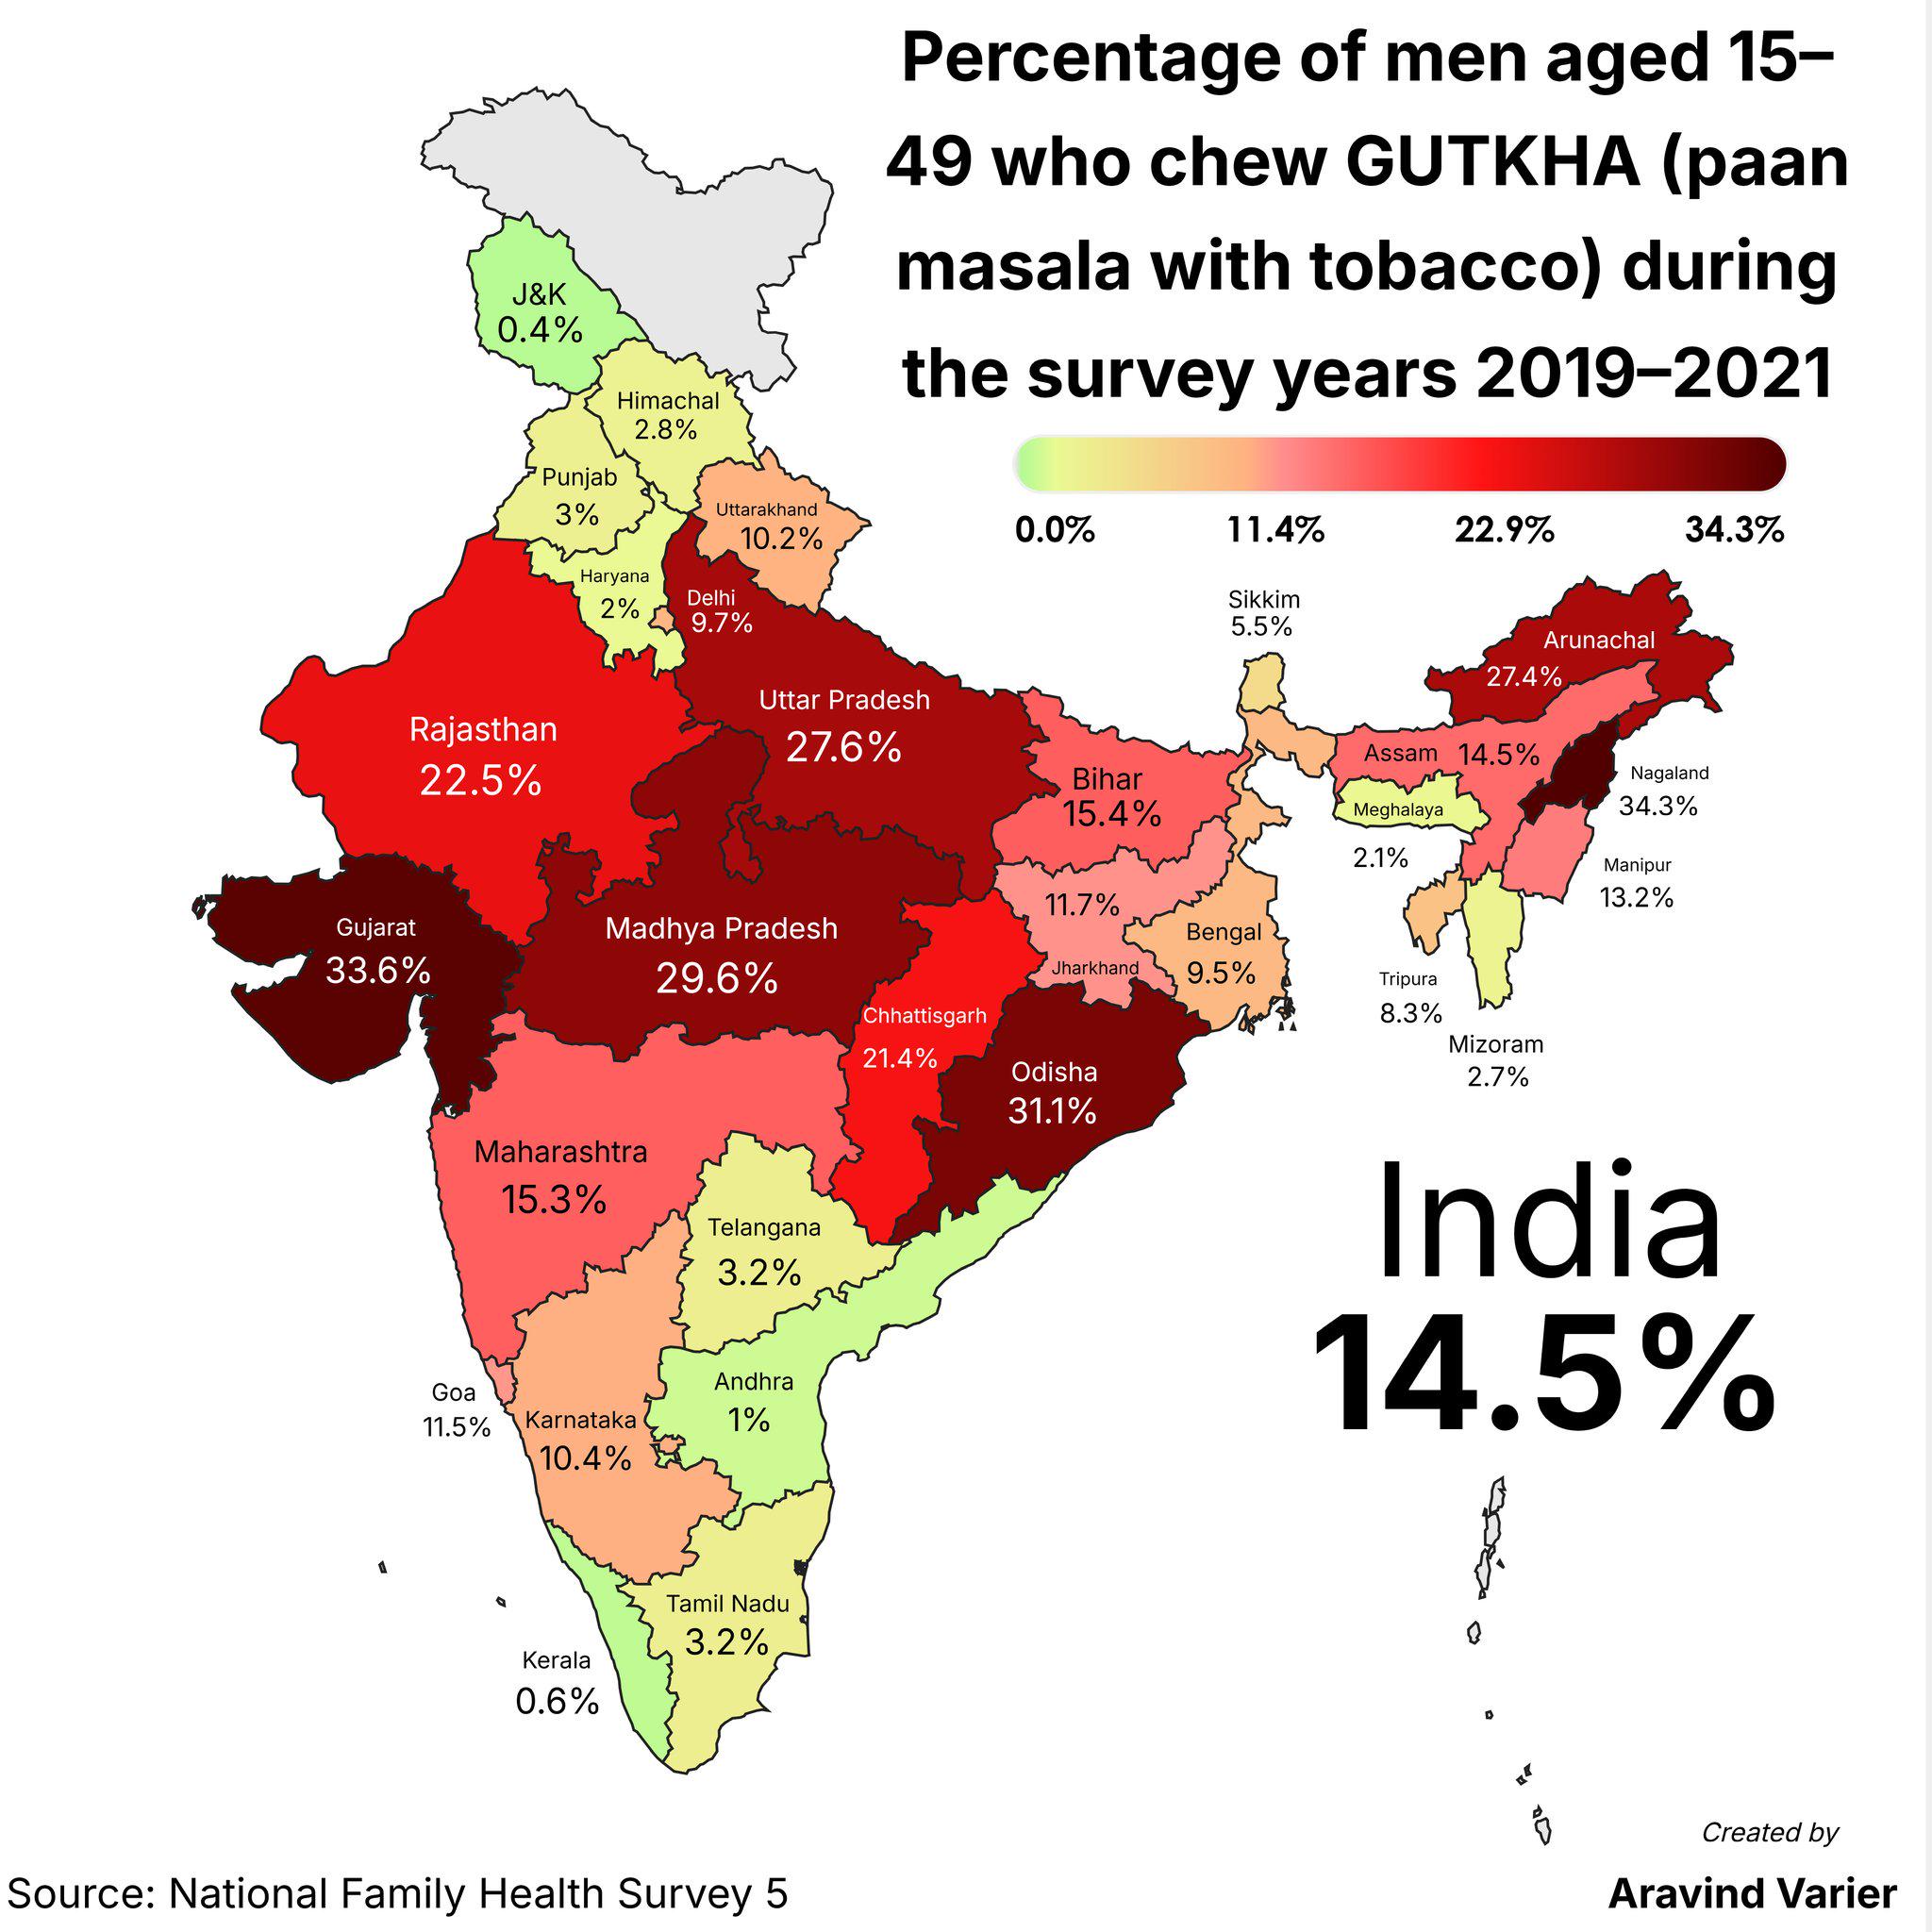
Map of Indian States by % of People Who Chew GUTKHA
The visualization titled \...
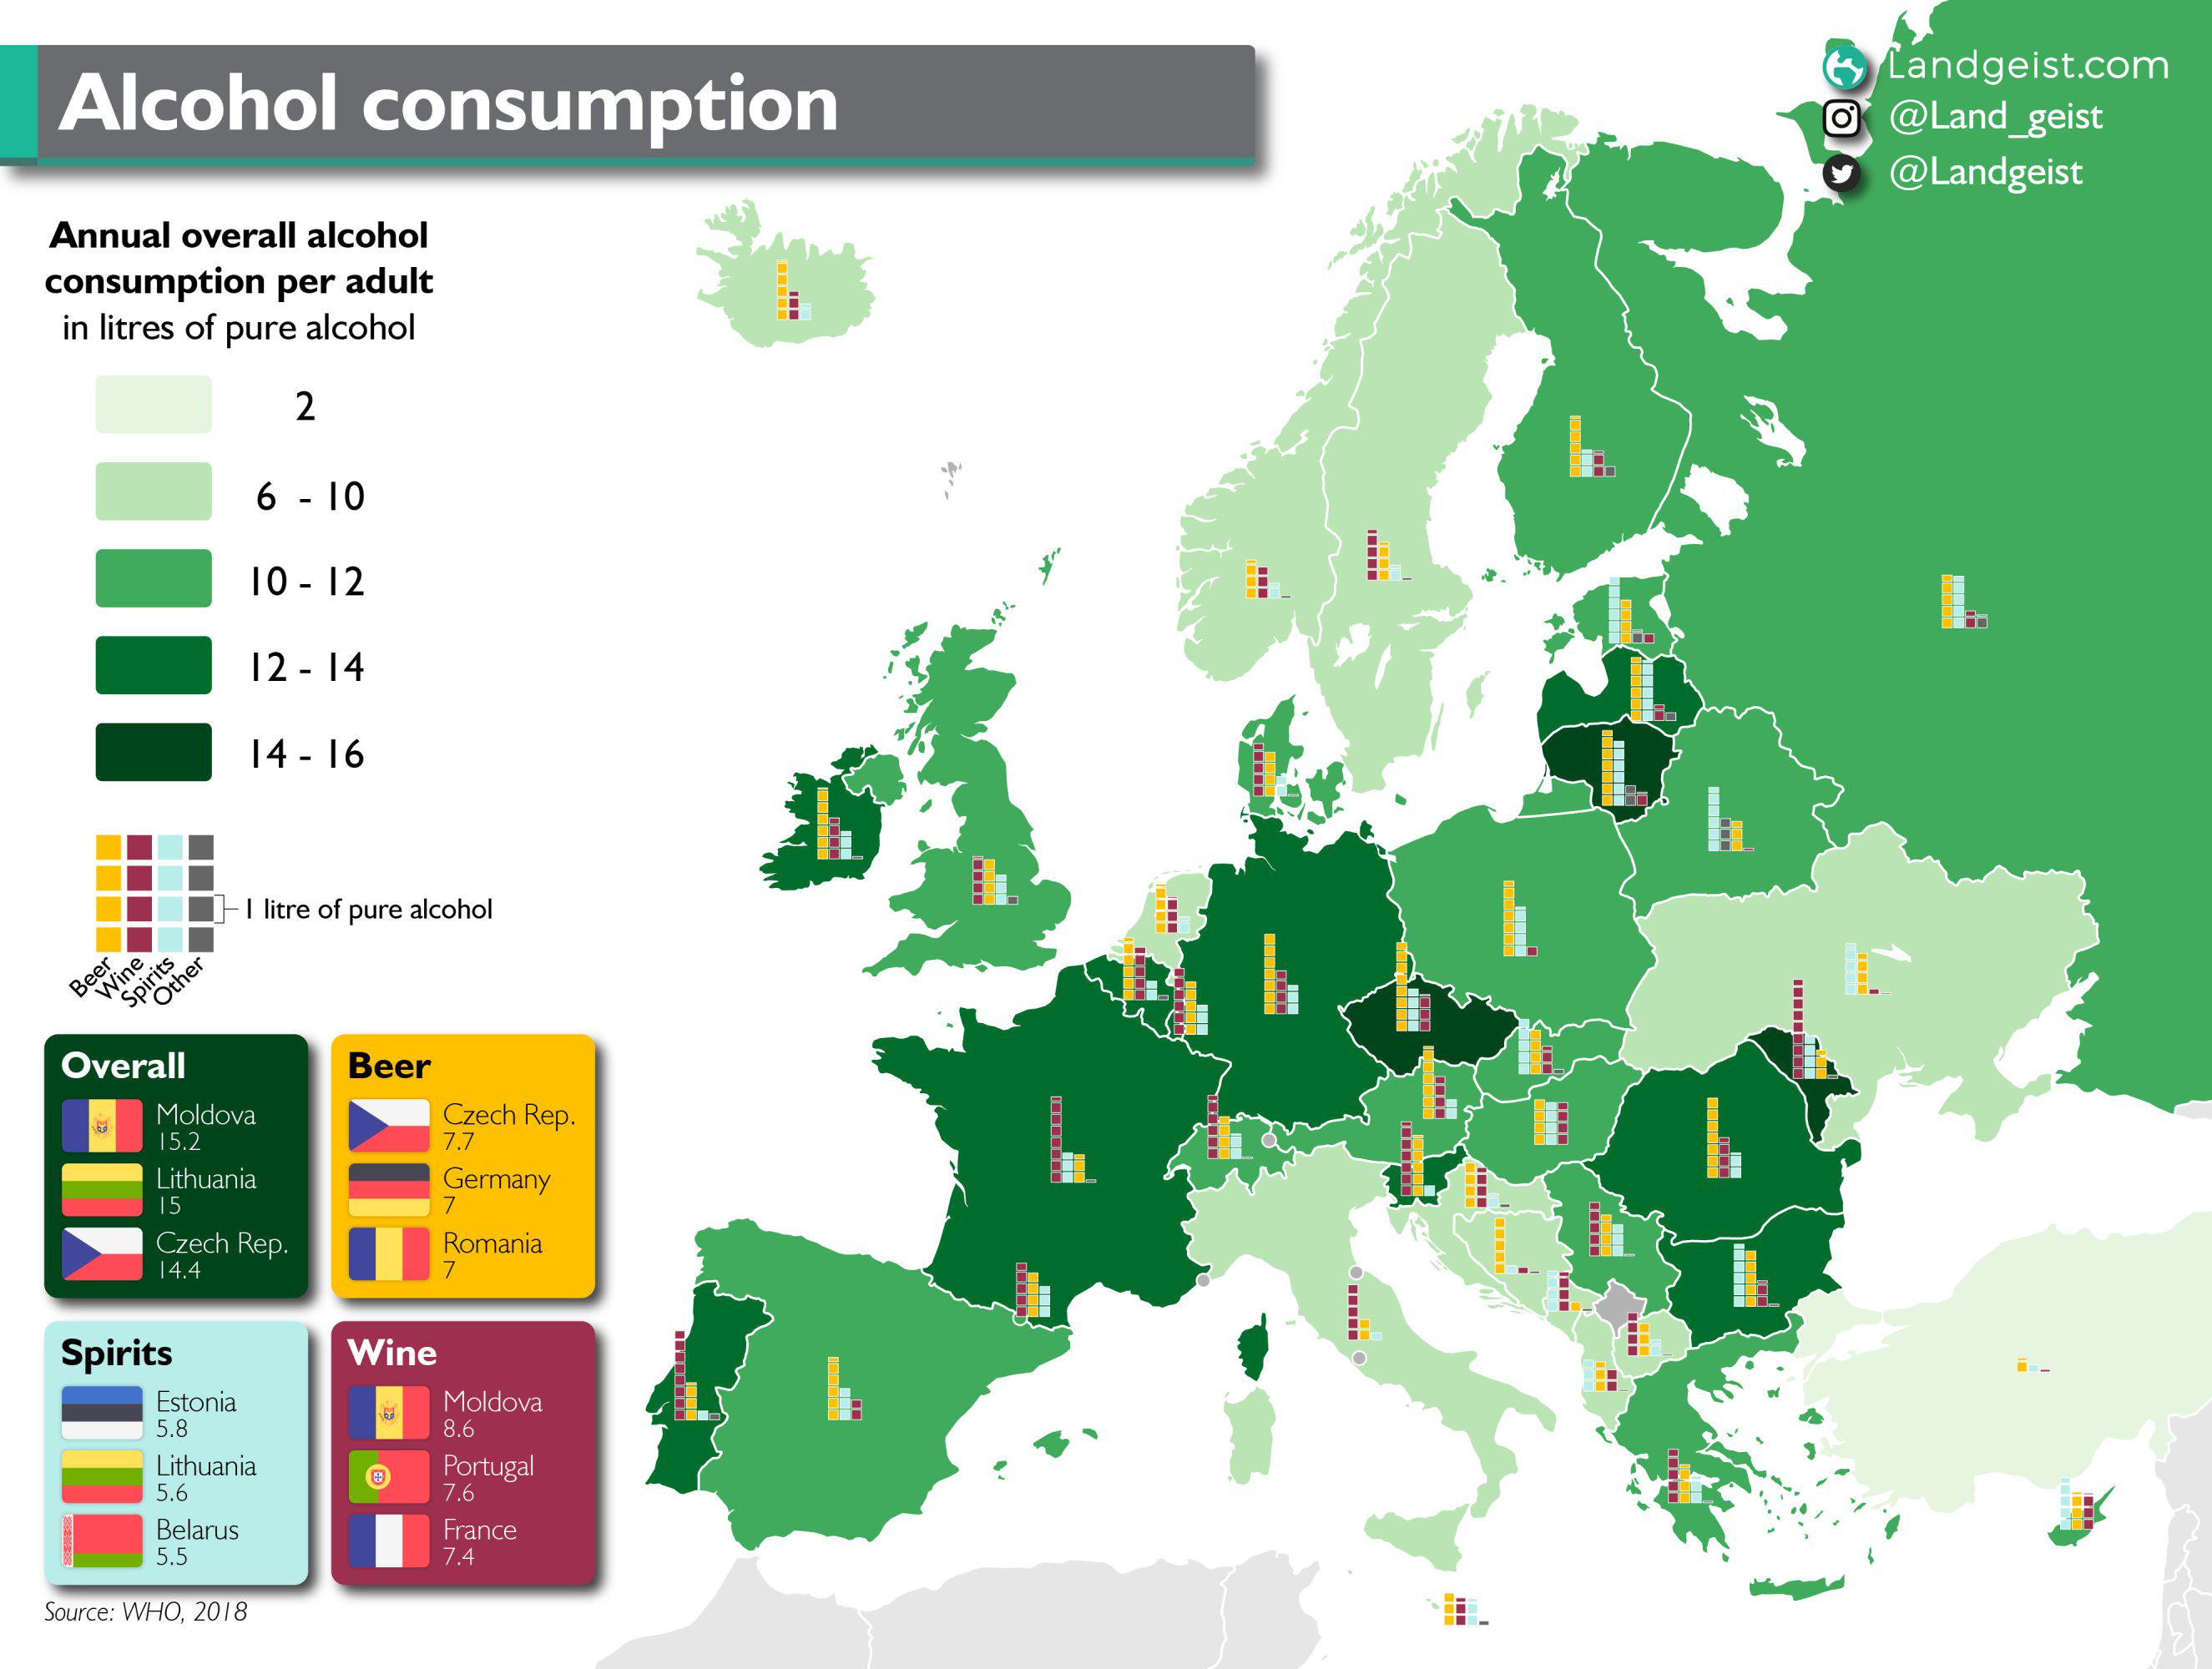
European Alcohol Consumption Map 2024
Interestingly, the cultural acceptance of alcohol in these regions plays a significant role in these statistics. In many...
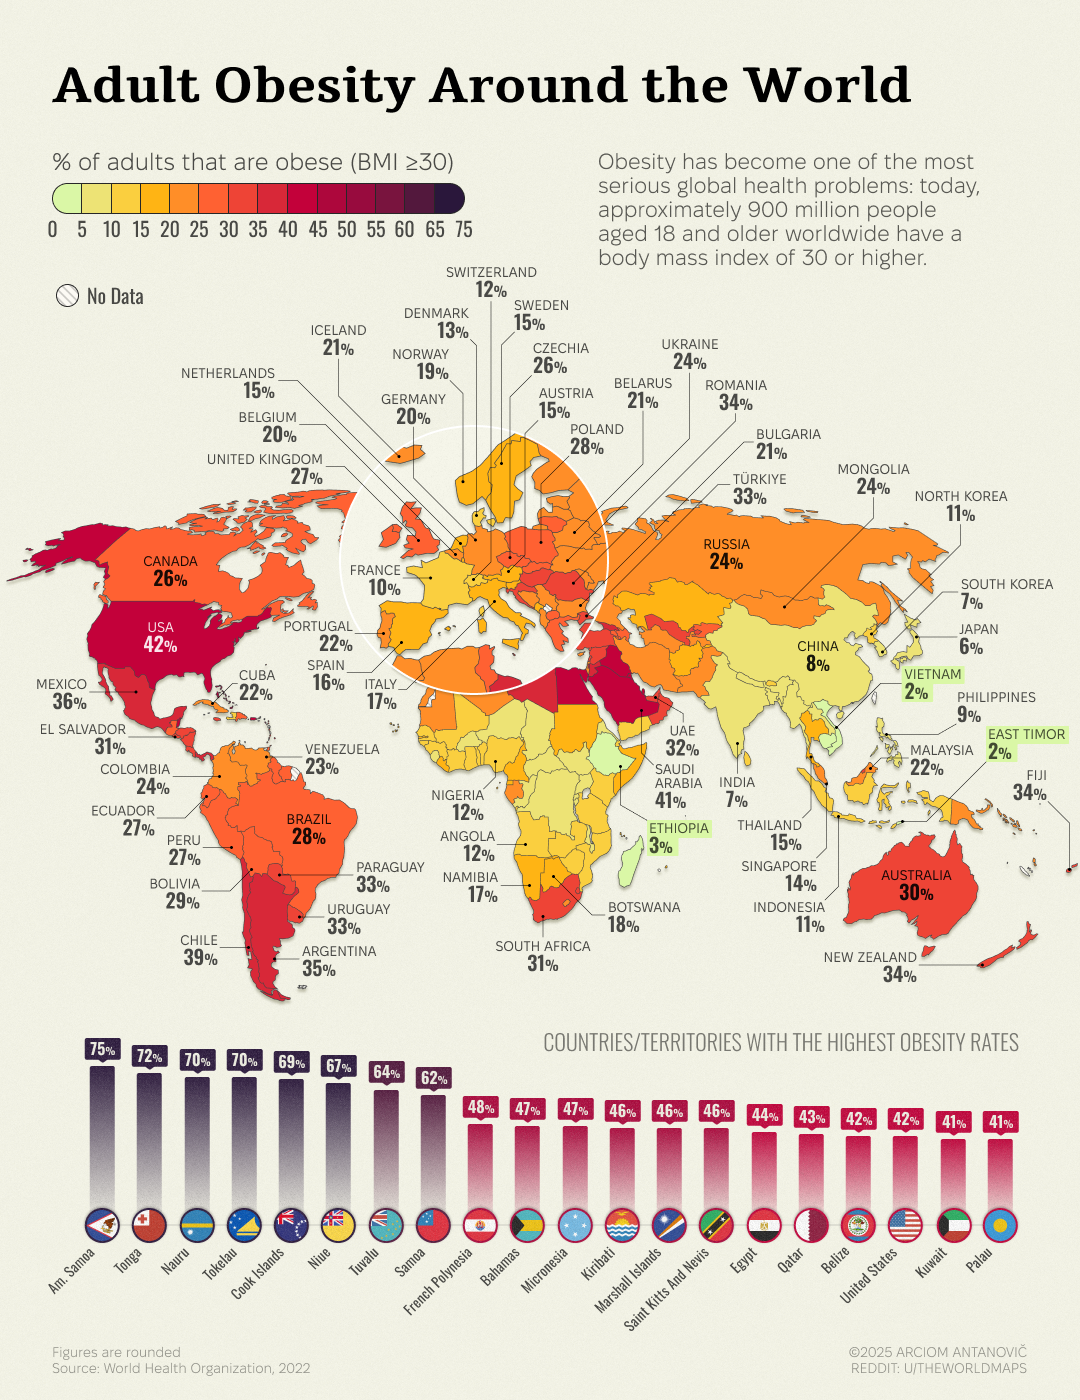
Obesity Rates Map of Adults Aged 18 and Older
This map visually represents the percentage of adults aged 18 and older who are classified as obese in various regions. ...
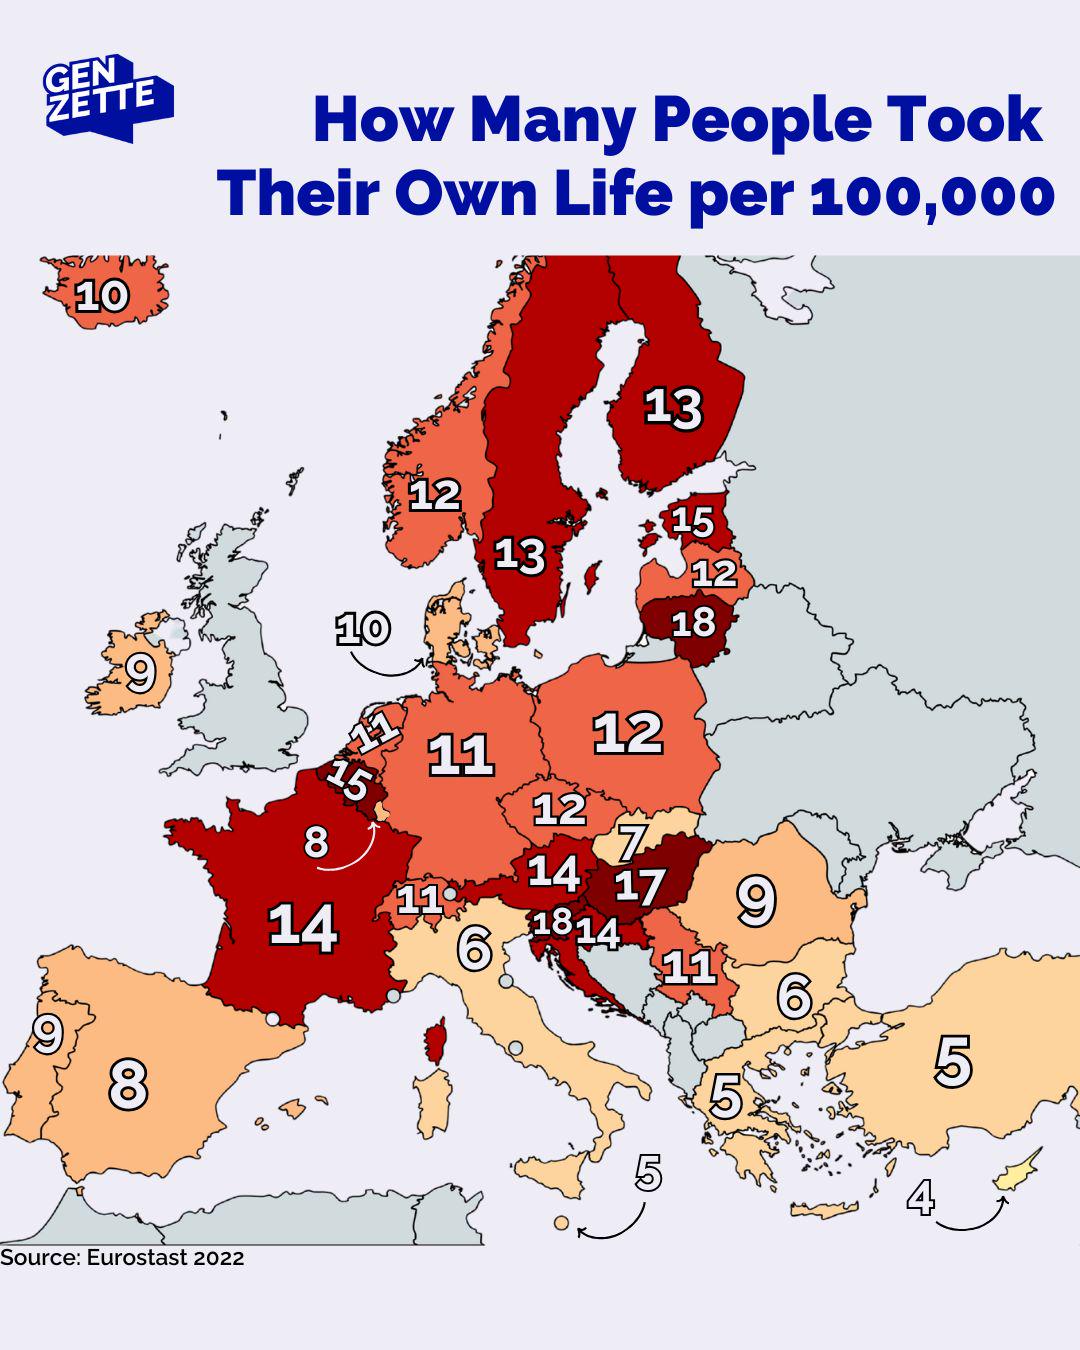
Suicide Rate Map 2022 Per 100,000 People
This map visualizes the suicide rates across different countries in 2022, represented as the number of deaths by suicide...
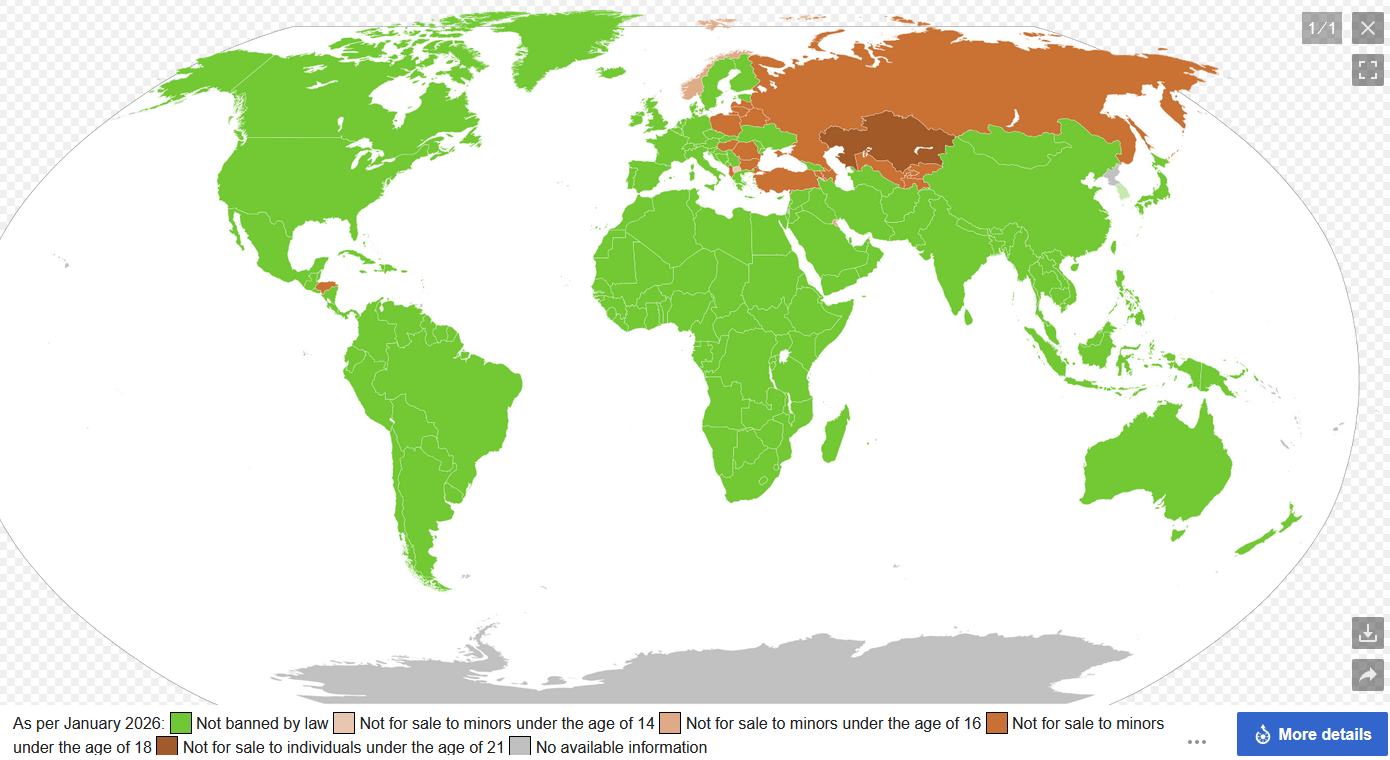
Age Restrictions on Energy Drinks by Country Map
The "Age Restrictions on Energy Drinks by Country Map" visually illustrates the varying legal age limits imposed on the ...
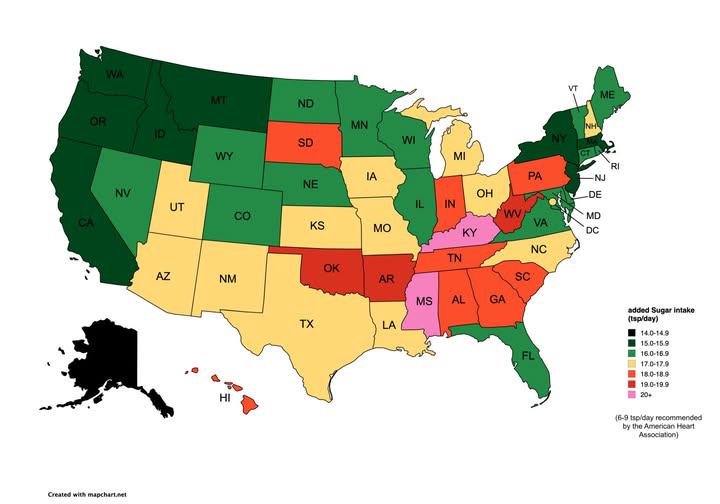
Map of Estimated Daily Sugar Intake By U.S. State
The "Map of Estimated Daily Sugar Intake By U.S. State" provides a visual representation of how much sugar the average p...
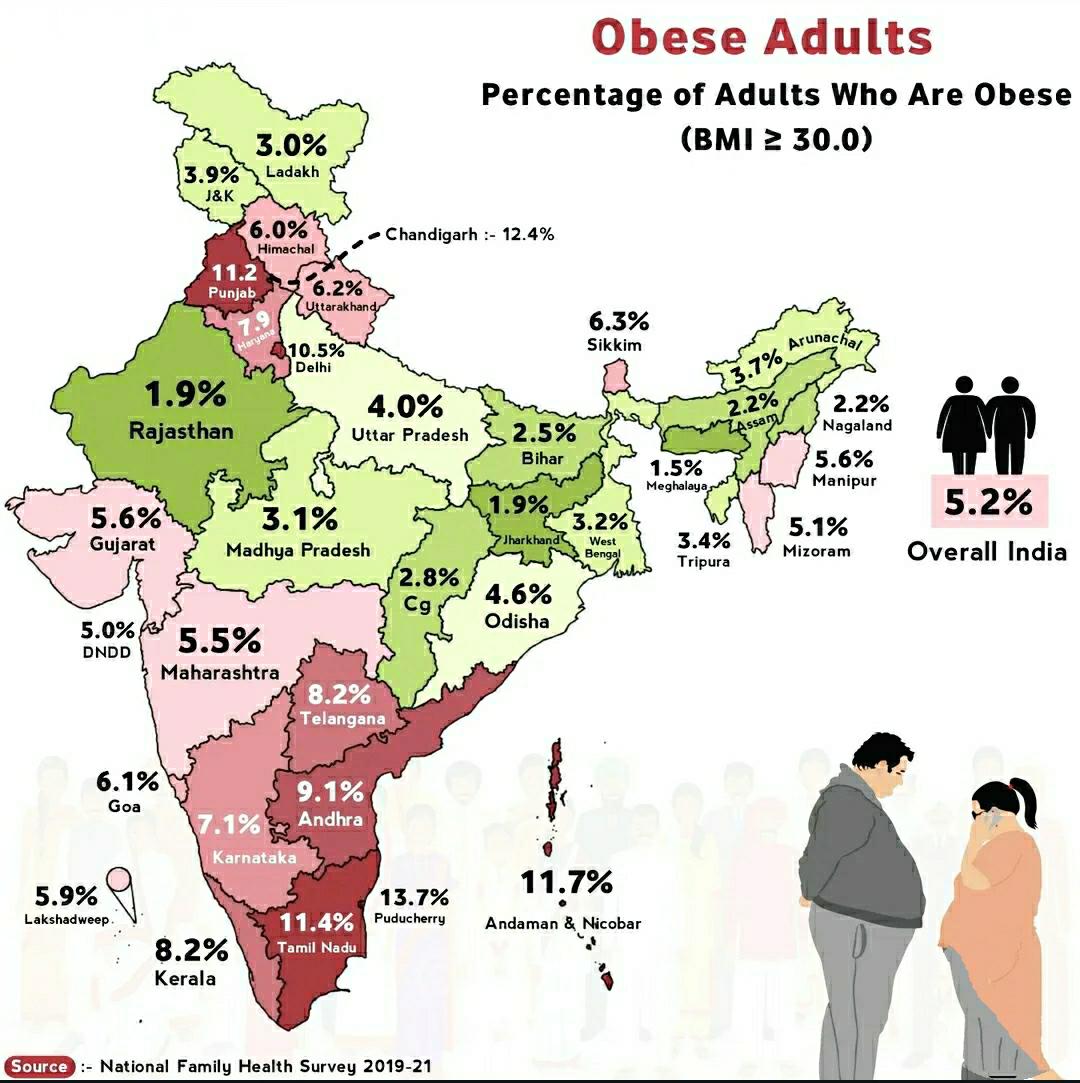
Obese Adults in India Map
The "Obese Adults in India Map" provides a visual representation of the prevalence of obesity among adults across variou...
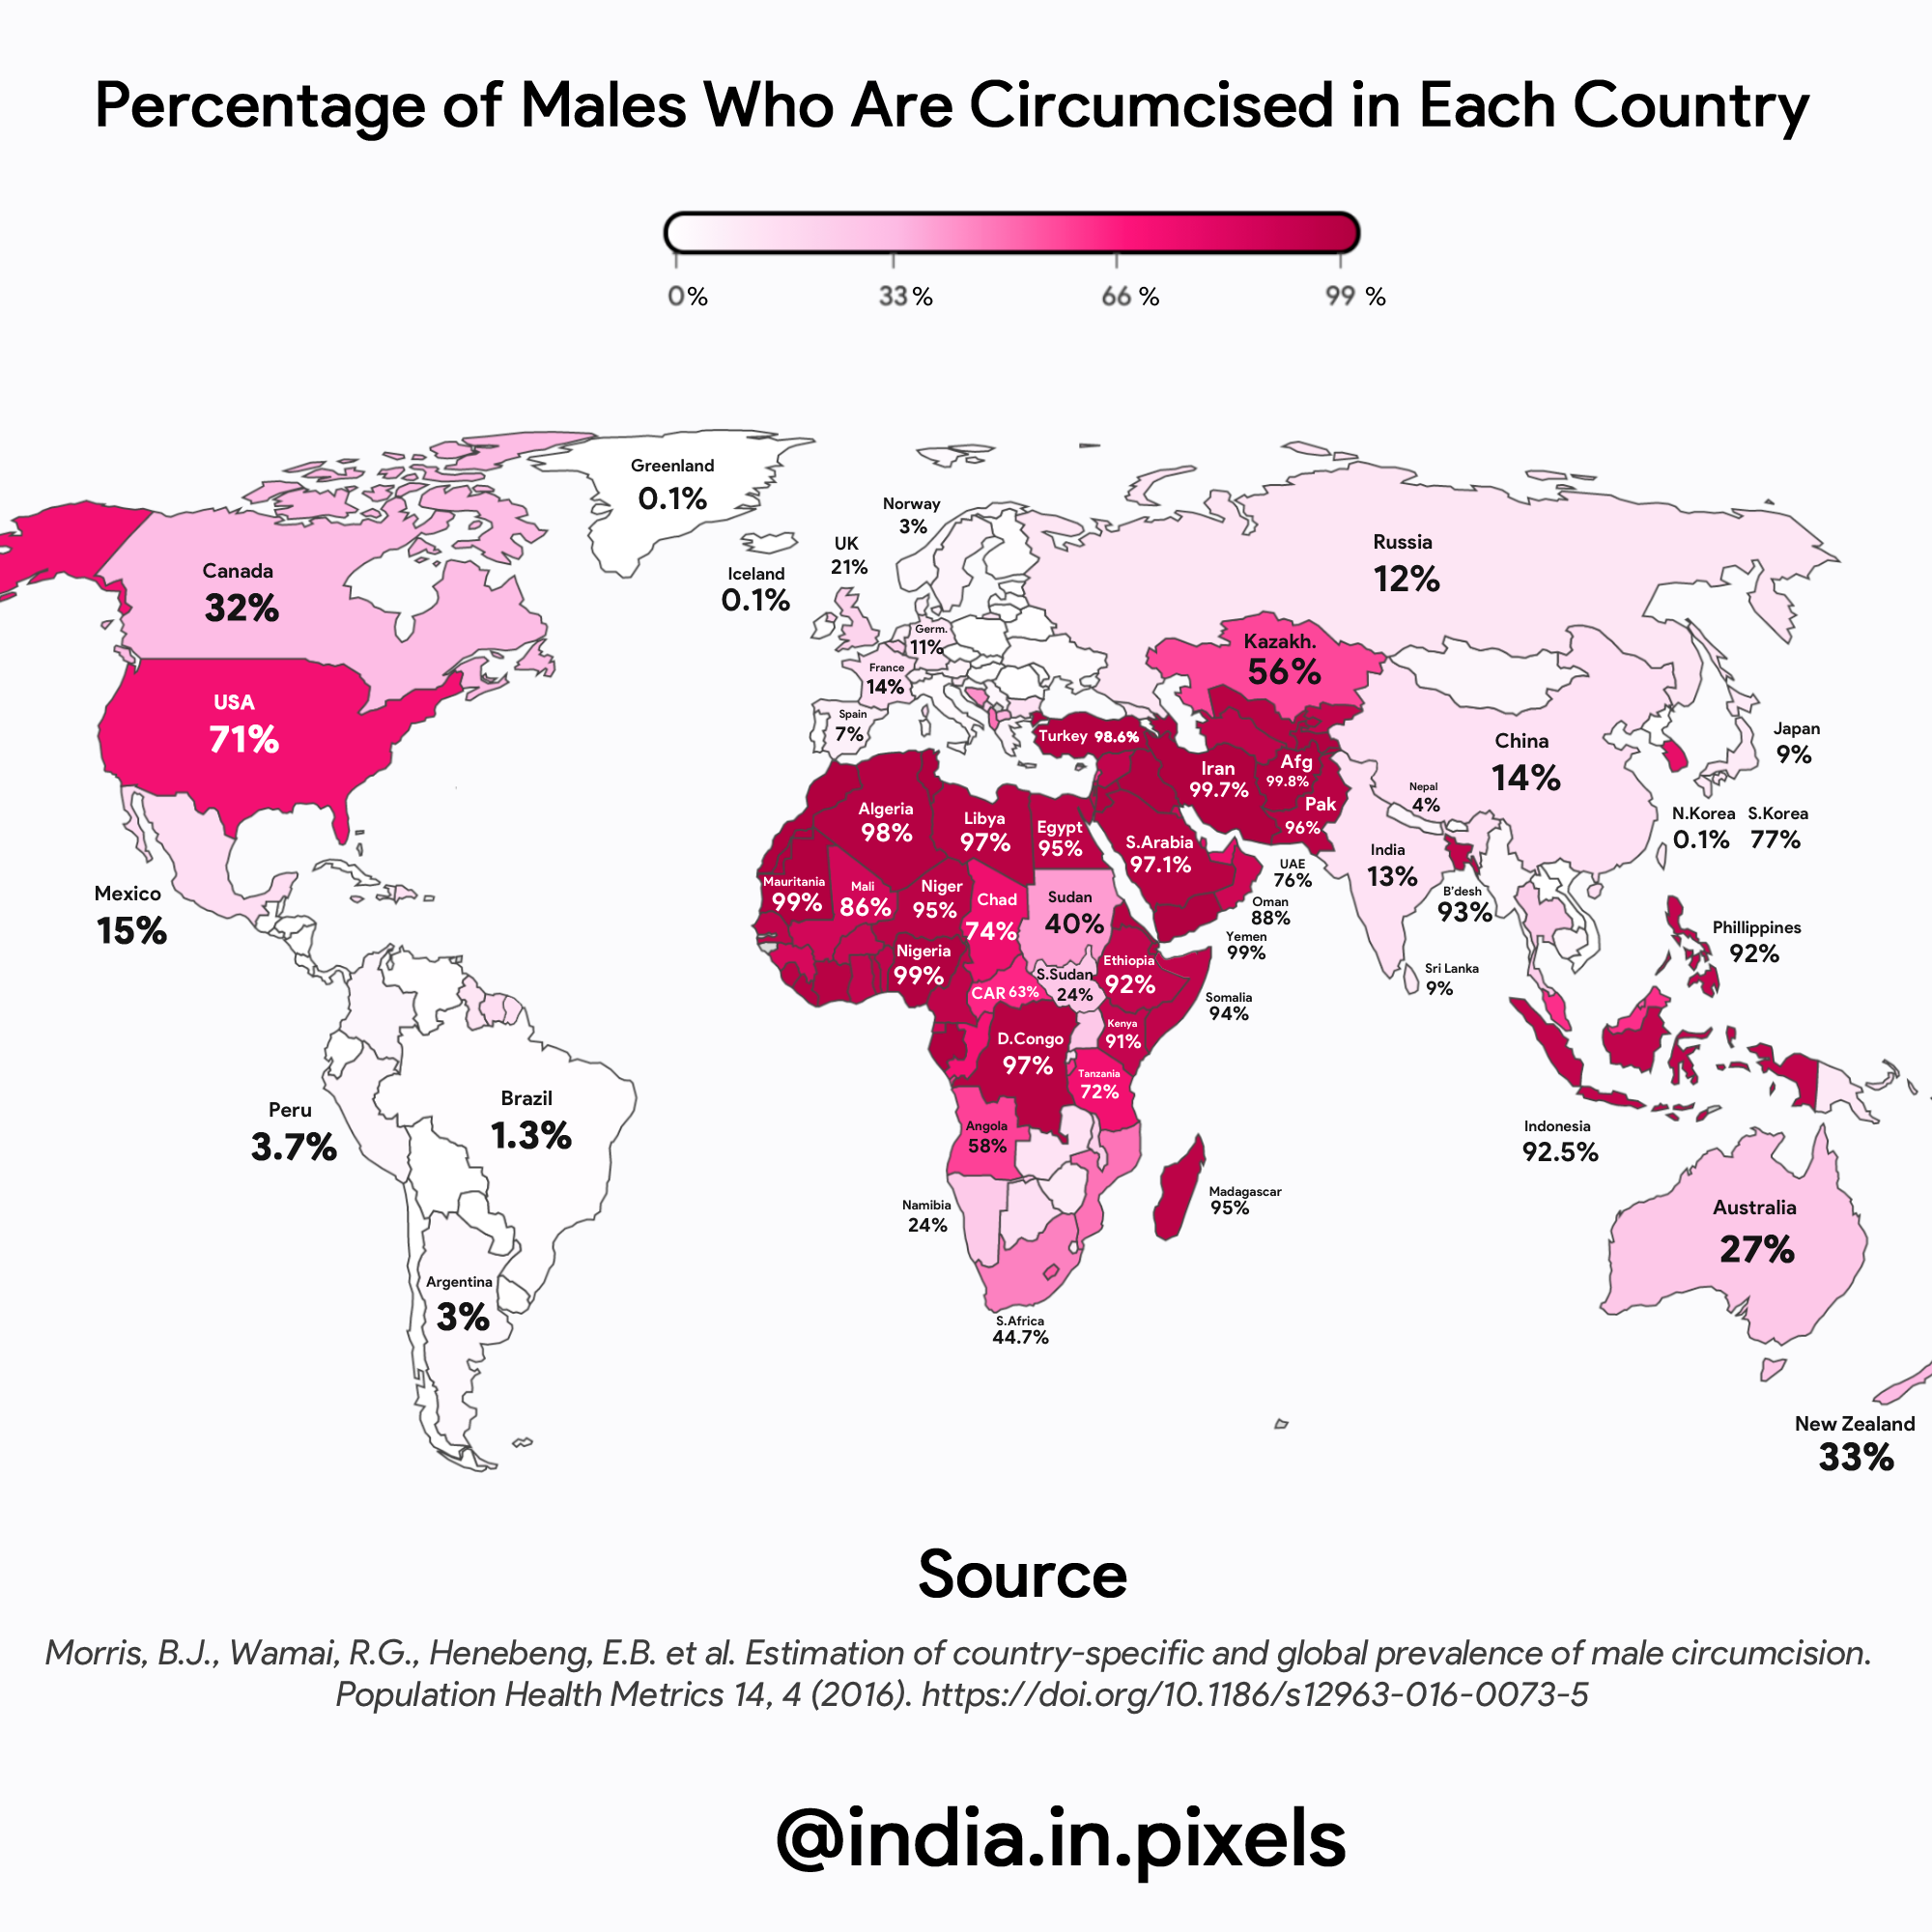
Circumcision Rates by Country Map
However, the prevalence of circumcision isn't solely tied to religious beliefs. In many parts of the world, it has becom...