Obesity Rate by Country Map

Alex Cartwright
Senior Cartographer & GIS Specialist
Alex Cartwright is a renowned cartographer and geographic information systems specialist with over 15 years of experience in spatial analysis and data...
Geographic Analysis
What This Map Shows
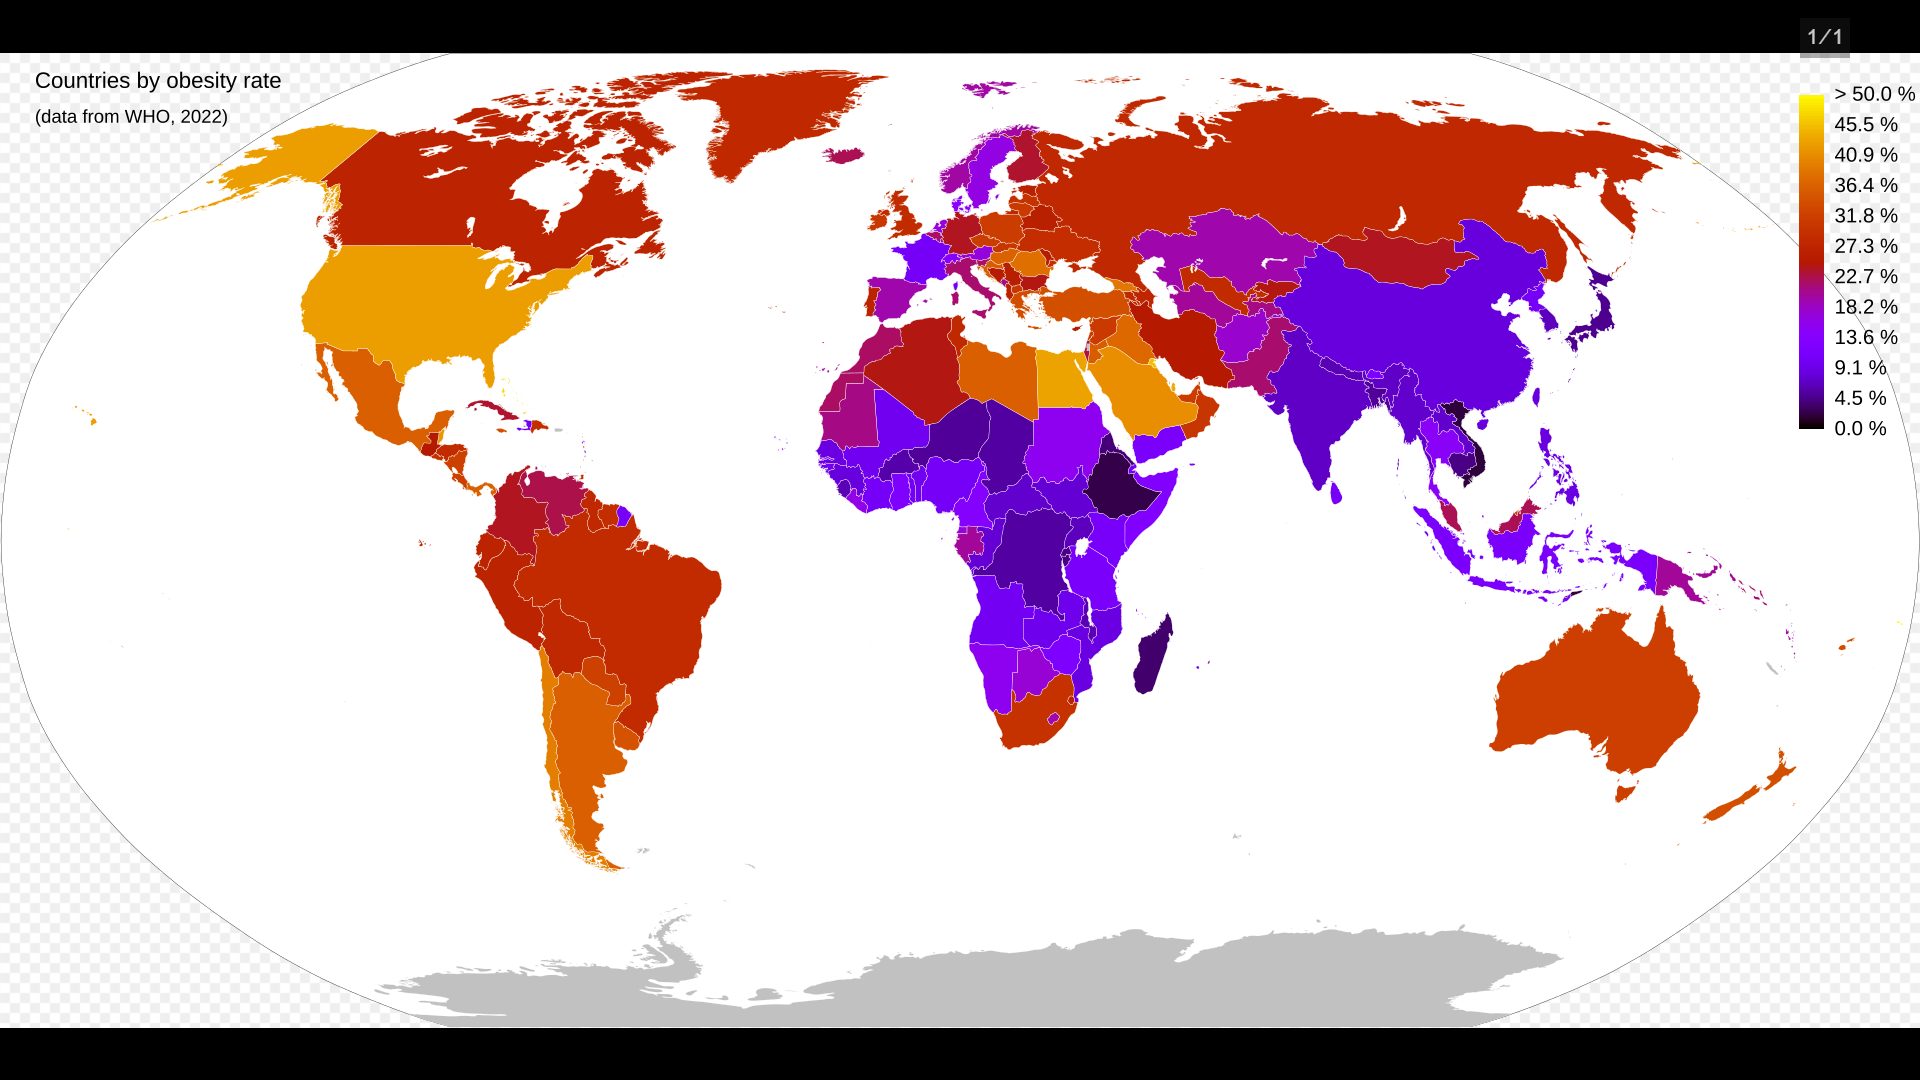
The "Countries by Obesity Rate, WHO 2022" map provides a comprehensive overview of global obesity rates, highlighting the percentage of adult populations classified as obese in various countries. This visualization is a reflection of a significant public health issue that has gained increasing attention over the years. Obesity is not just a matter of personal health; it is a complex interplay of lifestyle, environment, and economic factors that vary widely across the globe.
Deep Dive into Obesity Rates
Obesity is defined as having a body mass index (BMI) of 30 or higher. It is a major risk factor for various diseases, including diabetes, cardiovascular diseases, and certain cancers. The World Health Organization (WHO) has identified obesity as a global epidemic, and its prevalence has been rising steadily since the 1970s. What’s fascinating is that obesity doesn't just affect individuals; it has far-reaching implications for health systems, economies, and societies at large.
Interestingly, the global obesity epidemic is not uniform. Factors such as urbanization, economic development, cultural practices, and dietary habits all play significant roles. For instance, in many high-income countries, the prevalence of obesity has surged due to increased consumption of processed foods rich in sugars and fats, coupled with sedentary lifestyles. In contrast, some low and middle-income countries are experiencing a dual burden of malnutrition, where obesity coexists with undernutrition among different segments of the population.
According to the WHO, in 2022, the United States recorded one of the highest obesity rates, with over 36% of adults classified as obese. This alarming statistic raises questions about lifestyle choices, healthcare access, and public health initiatives in the country. On the other hand, countries like Japan and South Korea report significantly lower obesity rates, around 4-5%. Their traditional diets, rich in vegetables and fish, alongside active lifestyles, contribute to these favorable numbers.
Moreover, the map reveals that certain regions, particularly in the Pacific Islands, face some of the most severe obesity challenges. Countries such as Nauru and Cook Islands report rates exceeding 50%. This situation can be attributed to a combination of factors, including reliance on imported, calorie-dense foods and limited access to fresh produce. The impact of cultural acceptance of larger body sizes also plays a part in these statistics.
Regional Analysis
When looking at the map, it's essential to consider the regional disparities in obesity rates. In North America, the high rates are largely linked to fast food culture and lifestyle choices that prioritize convenience over nutrition. Meanwhile, Europe presents a mixed picture; while countries like the UK show concerning rates, others like Italy maintain lower averages through healthier dietary habits.
In Africa, obesity rates are on the rise, particularly in urban areas where lifestyles are rapidly changing. Countries like South Africa see obesity rates climbing due to increased availability of processed foods and decreased physical activity. Interestingly, some regions still grapple with undernutrition, highlighting a complex health landscape.
Asia showcases stark contrasts as well. While countries like India and China are witnessing rising obesity rates alongside economic growth, others, particularly in Southeast Asia, maintain lower rates due to traditional dietary practices. The disparity often stems from urbanization, where the shift from rural to urban living leads to lifestyle changes that can increase obesity risk.
Significance and Impact
Understanding obesity rates globally is vital for several reasons. First, it underscores the urgent need for public health interventions aimed at prevention and management of obesity-related diseases. Countries must address the root causes, which include not just food availability but also education, awareness, and access to healthcare.
Secondly, the economic implications of rising obesity rates cannot be understated. Healthcare systems worldwide are already stretched, and the projected increase in obesity-related health issues could lead to skyrocketing healthcare costs. Indeed, the WHO estimates that obesity-related diseases cost the global economy hundreds of billions of dollars annually.
Lastly, as the world becomes more interconnected, the trends in obesity can inform global health policies. For example, sharing successful strategies from countries with lower rates could inspire initiatives elsewhere. As communities work towards healthier lifestyles, understanding the dynamics of obesity can help shape effective solutions.
In conclusion, the "Countries by Obesity Rate, WHO 2022" map serves as a critical tool in visualizing the complex, multifaceted issue of obesity around the world. By examining these rates, we can better understand the challenges and opportunities that lie ahead in combating this global health crisis.
Visualization Details
- Published
- September 21, 2025
- Views
- 66
Comments
Loading comments...