U.S. States with Smaller Economies than San Francisco Bay Area Map

David Chen
Data Visualization Specialist
David Chen is an expert in transforming complex geographic datasets into compelling visual narratives. He combines his background in computer science ...
Geographic Analysis
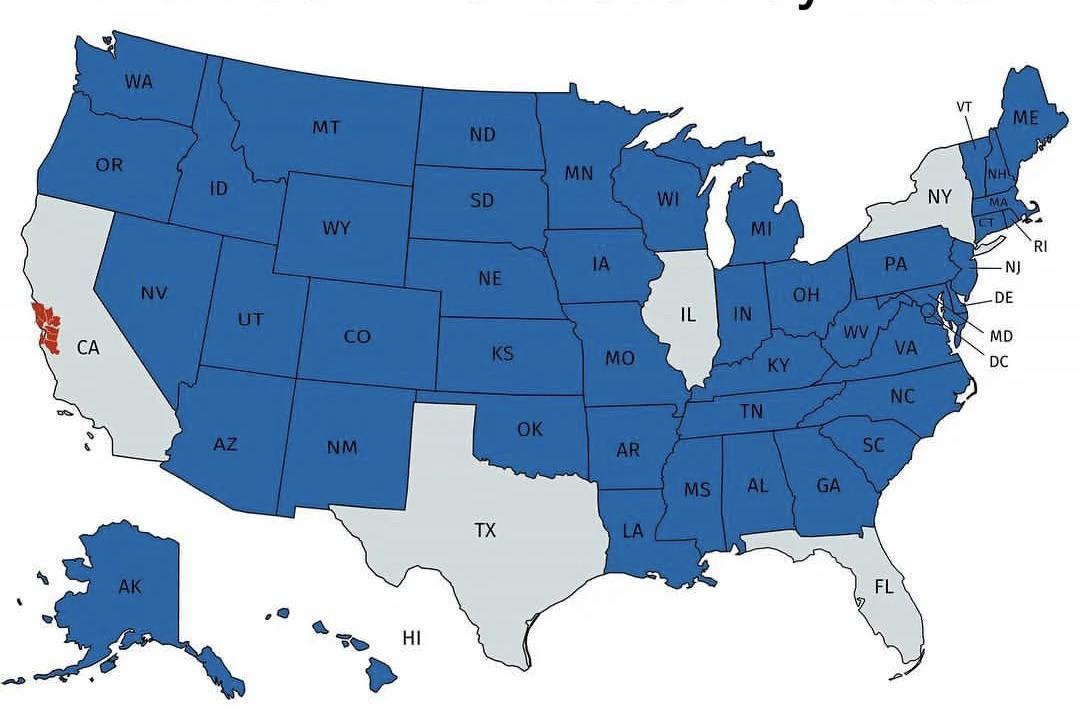
What This Map Shows
This map provides a striking visualization of U.S. states whose economies are smaller than that of the San Francisco Bay Area. The Bay Area, often regarded as a tech hub and economic powerhouse, boasts a GDP that rivals entire countries. The visualization highlights the economic disparities across the United States, showcasing states that, despite their size and population, have economies that do not meet the scale of this one metropolitan area.
The San Francisco Bay Area, encompassing cities like San Francisco, San Jose, and Oakland, is known for its innovation-driven economy, heavily influenced by the technology sector. This map prompts us to dive deeper into understanding the factors contributing to such economic variations across different states.
Deep Dive into Economic Disparities
When we examine economic performance, GDP (Gross Domestic Product) is a crucial metric. The Bay Area's economy has a staggering GDP that exceeds $600 billion, which is higher than that of many individual states. What's fascinating is that this region’s wealth is not evenly distributed; it is concentrated in specific sectors, primarily technology, finance, and real estate. The presence of companies like Google, Apple, and Facebook has created a ripple effect, driving up demand for services and housing, thus boosting the overall regional economy.
However, the economic landscape of the United States is incredibly diverse. States with smaller economies than the Bay Area often rely on different industries. For instance, states like Vermont and Wyoming may have their economic strengths in agriculture or natural resources, but their overall GDP remains significantly lower than that of the Bay Area. In fact, Vermont's economy is less than one-tenth the size of the Bay Area's, reflecting the challenges faced by smaller economies in competing with tech-heavy regions.
Interestingly, many of the states that fall below the Bay Area’s economic benchmark are not necessarily underdeveloped. For example, states like New Mexico and Mississippi have unique cultural and natural resources that contribute to their economies, such as tourism and agriculture. However, their economic structures are often less varied and less robust than the Bay Area’s.
Understanding these disparities can shed light on broader economic trends. States with smaller economies often face challenges like population decline, limited investment in technology, and lower levels of educational attainment. These factors can create a cycle where limited economic growth perpetuates lower GDP figures, making it difficult to attract new businesses or retain talent.
Regional Analysis
When looking at the map, it becomes clear that geographical location plays a significant role in economic performance. For instance, states in the Northeast, such as Rhode Island and Delaware, have economies that trail behind the Bay Area despite being more populous and having a long history of industrial development. On the other hand, states in the Midwest like Iowa and South Dakota also show smaller economies, largely due to their agricultural focus.
In contrast, states like Texas and Florida, while not represented on this map due to their larger economies, offer compelling case studies of how geography and resource availability can bolster economic growth. Texas, with its oil and gas sector, and Florida, with its tourism and retirement industries, underscore how diverse economic bases can lead to greater GDP figures.
There's also a notable difference in how urban versus rural areas contribute to state economies. Urban areas tend to have more diversified economies, which can lead to higher GDPs. The Bay Area exemplifies this, with its mix of tech, finance, and creative industries, while many smaller states experience economic limitations due to a reliance on fewer industries.
Significance and Impact
Understanding the economic disparities represented in this map is crucial for policymakers, businesses, and communities. It highlights the need for targeted economic development strategies that can help smaller states enhance their GDP. Efforts such as investing in technology, improving education systems, and fostering innovation can create pathways for growth.
Moreover, as we navigate the complexities of a post-pandemic economy, these disparities may widen further. Remote work, for example, has allowed some individuals to relocate from high-cost areas like the Bay Area to states with lower living costs, potentially impacting local economies differently. As we look to the future, it will be essential to monitor these trends and understand their implications on both local and national levels.
In conclusion, while the San Francisco Bay Area stands as a beacon of economic prowess, the map serves as a reminder of the diverse economic landscapes that exist across the United States. Each state has its unique strengths and challenges, and understanding these nuances is essential for fostering an equitable economic future.
Visualization Details
- Published
- August 18, 2025
- Views
- 176
Comments
Loading comments...