Map of U.S. States Leading in Organ Donations

David Chen
Data Visualization Specialist
David Chen is an expert in transforming complex geographic datasets into compelling visual narratives. He combines his background in computer science ...
Geographic Analysis
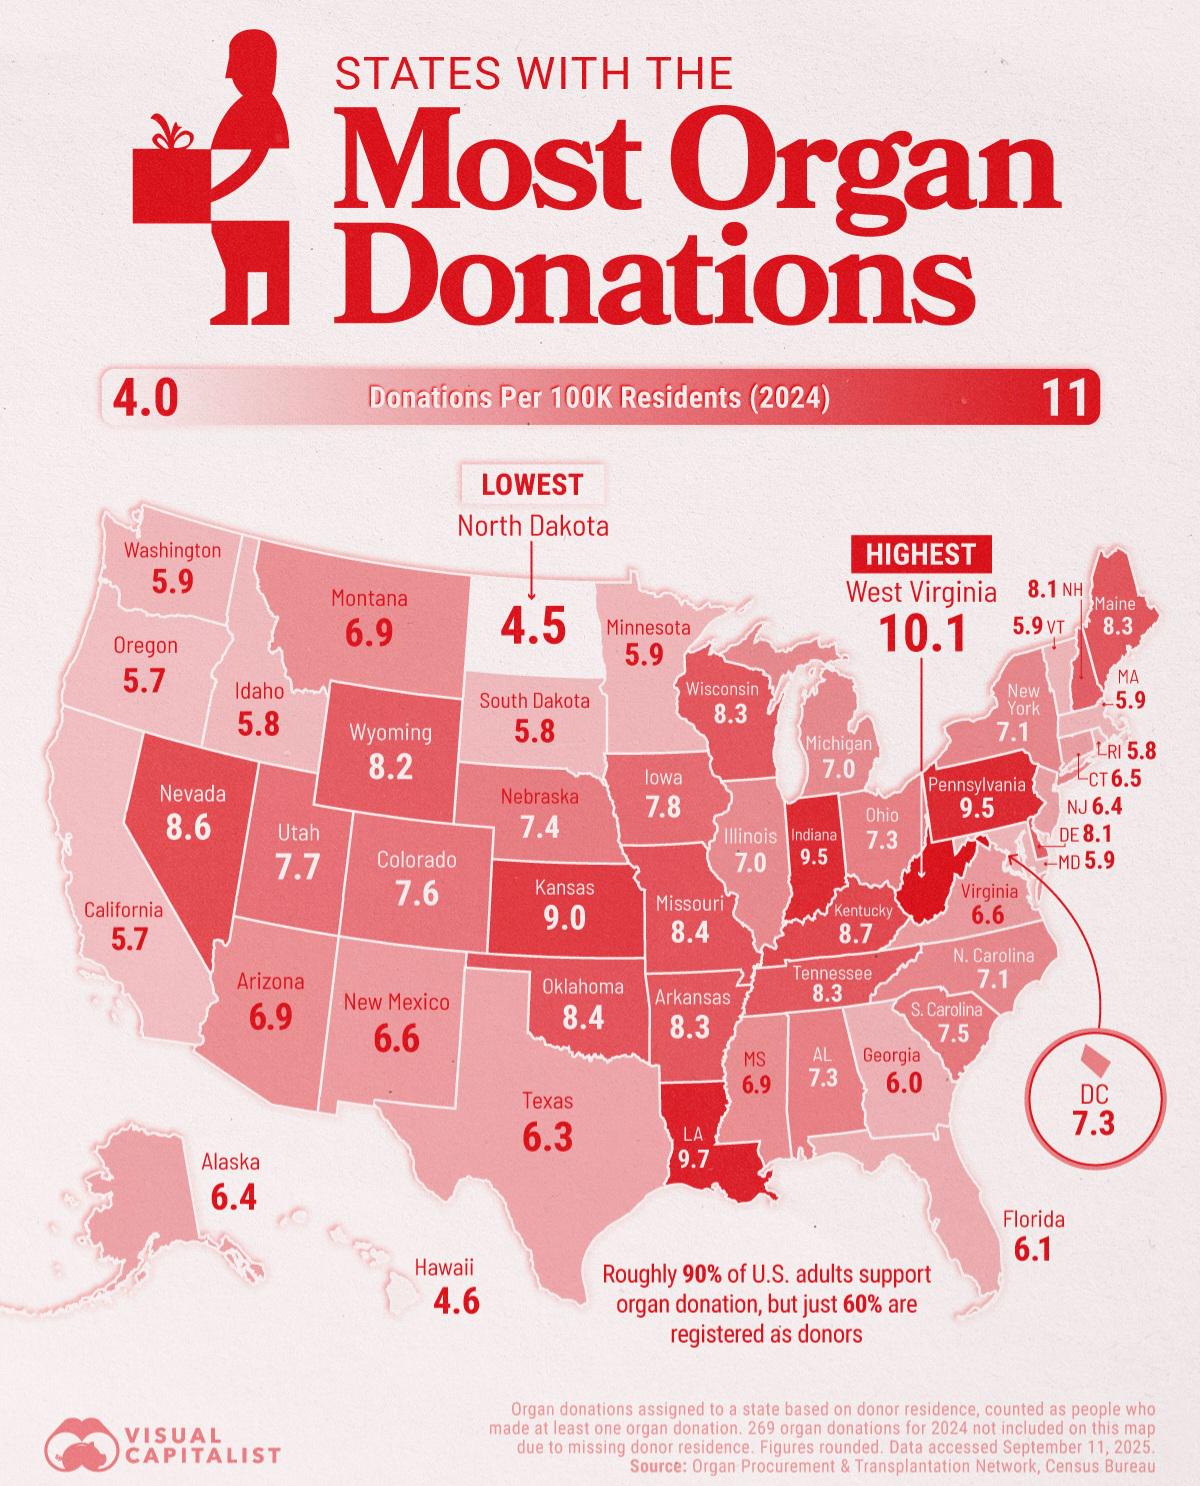
What This Map Shows
This map provides a comprehensive overview of organ donation rates across various U.S. states, highlighting which states excel in donor registration and organ transplants. It visually represents the number of organ donors per capita, showcasing significant disparities in organ donation rates from one state to another. Understanding these trends not only sheds light on regional healthcare practices but also reflects the cultural attitudes toward organ donation in different parts of the country.
Deep Dive into Organ Donation in the U.S.
Organ donation is a crucial aspect of modern medicine that can save countless lives. In the United States, more than 100,000 people are currently on the waiting list for organ transplants, and the need for donors continues to rise. Interestingly, the majority of organ donations come from deceased donors, but living donors also play a vital role, particularly in kidney transplants. As of recent statistics, roughly 20,000 living kidney donations occur each year, underscoring the importance of awareness and education around organ donation.
Every state has different policies and initiatives aimed at increasing donor registration. For instance, states like California and Texas have robust donor registries and extensive public awareness campaigns. According to data from the Health Resources and Services Administration (HRSA), California alone had over 35,000 organ donors in 2022, which is remarkable given its large population.
Moreover, cultural perceptions significantly influence donation rates. For example, states in the Northeast, such as New York and Massachusetts, have faced challenges with lower donor registration rates, partly due to historical mistrust in the healthcare system. However, recent efforts to engage communities and promote education have started to shift these trends positively. It’s fascinating to see how these social factors can directly impact healthcare outcomes.
Statistics show that the average donation rate in the U.S. is around 30 donors per million population. However, in states like Utah and Colorado, this rate can soar to over 50 donors per million. Such differences can often be attributed to proactive health policies and community engagement programs that encourage people to become donors. Interestingly, states with a high number of outdoor enthusiasts and younger populations, like Colorado, tend to have higher donor rates, possibly due to a culture that values health and community service.
Regional Analysis
When examining the map, it’s evident that the Southeast region has some of the lowest organ donation rates in the country. States such as Alabama and Mississippi struggle with donor registration, which can be linked to a combination of socioeconomic factors, lack of awareness, and cultural beliefs. In contrast, the Midwest, particularly states like Illinois and Wisconsin, show commendable rates of donation, thanks in part to effective advocacy from local organizations and hospitals.
In the West, states like Washington and Oregon are leading the charge with innovative programs that encourage organ donation. Oregon, for example, has implemented an automatic opt-in system for organ donation, which significantly increases the number of registered donors. This contrasts sharply with states that still rely on opt-in systems, leading to lower participation rates.
On the other hand, the Northeast presents a mixed bag. While states like New Jersey have made strides in improving donor registration, neighboring New York continues to lag behind due to longstanding public skepticism about organ donation practices. This disparity illustrates how regional policies and cultural attitudes can either facilitate or hinder the donation process.
Significance and Impact
Understanding organ donation rates across the U.S. is essential for several reasons. First and foremost, it highlights the urgent need for more donors to meet the ever-growing demand for transplants. With advancements in medical technology, the success rates of organ transplants continue to improve, making the need for donors even more pressing.
Moreover, this topic has significant implications for public health policy. By identifying states with lower donation rates, policymakers can target education and outreach efforts to increase awareness and registration. Current trends indicate a push towards more community-driven initiatives that engage potential donors and their families, which could lead to a significant increase in donor numbers.
Additionally, as the population ages, the demand for organ transplants is expected to rise sharply. Projections suggest that by 2030, the number of people on waiting lists could double if current trends continue. Therefore, addressing the organ donation gap is not only vital for saving lives but also for the sustainability of healthcare systems across the nation. In conclusion, the map of U.S. states leading in organ donations not only serves as a visual representation of current trends but also calls for a collective effort to improve these numbers for the benefit of society as a whole.
Visualization Details
- Published
- September 29, 2025
- Views
- 34
Comments
Loading comments...