Largest Immigrant Group by US State Map

David Chen
Data Visualization Specialist
David Chen is an expert in transforming complex geographic datasets into compelling visual narratives. He combines his background in computer science ...
Geographic Analysis
What This Map Shows
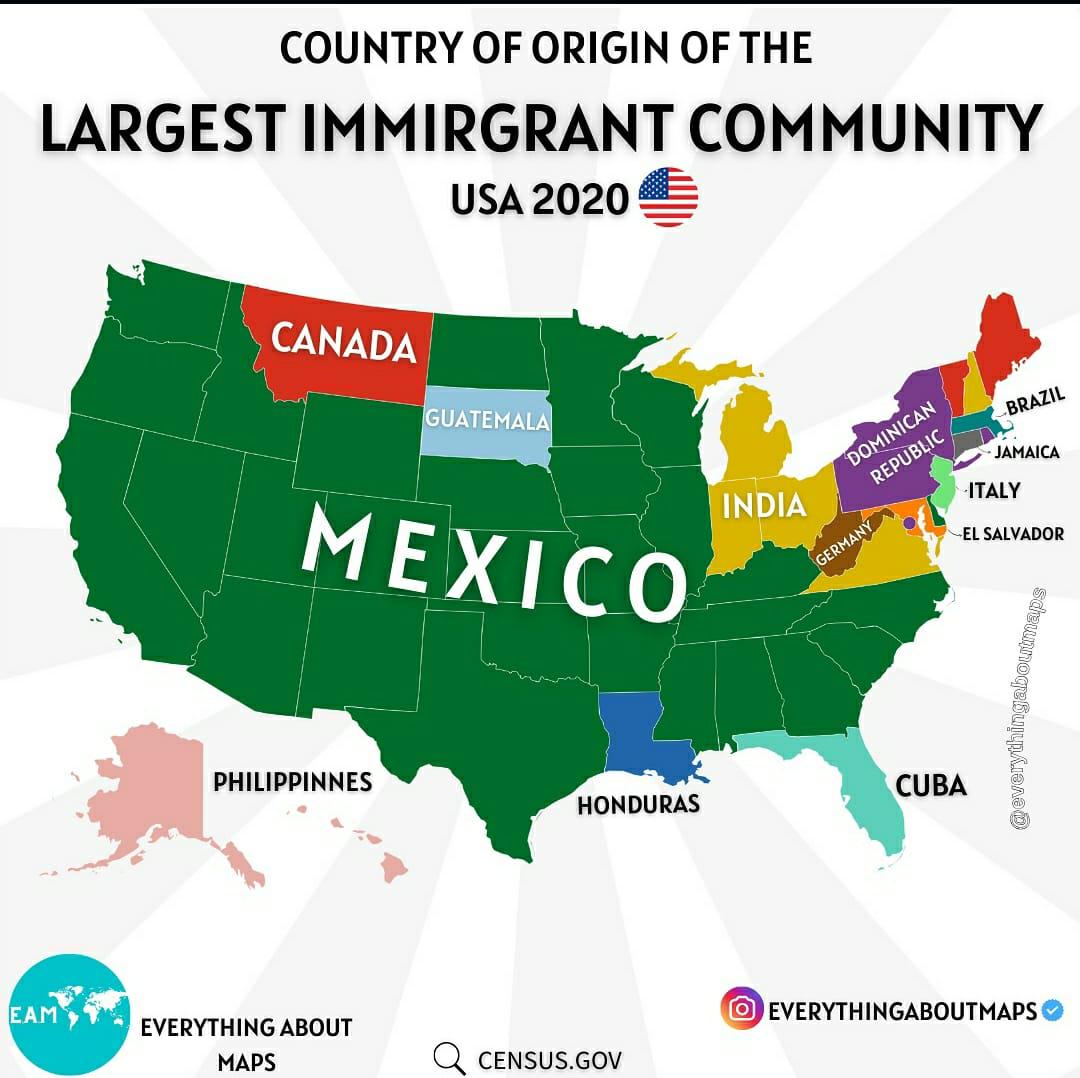
This map reveals the largest immigrant group in each U.S. state, showcasing a diverse tapestry of cultures and nationalities across the nation. At first glance, you might assume that the largest immigrant group in states like California or New York would be from Mexico or Puerto Rico, respectively. However, this visualization elucidates the often surprising realities of immigration patterns in the U.S. For instance, states such as North Dakota and Delaware have immigrant populations that may not be as widely recognized, highlighting the complexity of immigration demographics in America.
Deep Dive into Immigrant Demographics
Immigration plays a crucial role in shaping the demographic landscape of the United States. Currently, the U.S. is home to over 44 million immigrants, accounting for approximately 13.7% of the total population. These individuals come from various countries and contribute significantly to the economy, culture, and social fabric of their communities. Interestingly, the largest immigrant groups can vary dramatically from state to state, influenced by historical migration waves, economic opportunities, and regional characteristics.
For example, in states like Florida, the largest immigrant group is Cuban Americans, largely due to the historical context of the Cuban Revolution and subsequent migration. In contrast, in states like Wyoming, the largest immigrant group may consist of individuals from Latin America, reflecting recent trends in labor migration. This demographic diversity isn't just a matter of numbers; it significantly influences local cultures, economies, and even political landscapes.
Another fascinating aspect is how some states have seen shifts in their largest immigrant groups over the years. For instance, Minnesota has a significant population of Somali immigrants, which has transformed the state's cultural dynamics. The reasons behind these large migrations can be multifaceted, including economic opportunities, family reunification policies, and the quest for better living conditions.
Regional Analysis
When we break down the map by regions, distinct patterns emerge. In the West, states like California and Nevada are heavily influenced by Mexican immigration due to proximity and established communities. In contrast, the Midwest showcases a blend of immigrant groups, with states like Illinois having a significant Polish community, reflecting historical migration patterns from Europe.
Moving to the Southeast, states such as Georgia and North Carolina have seen a rise in immigrant populations from Central America and Asia, driven by labor demands in agriculture and industry. This shift is particularly noteworthy as these states have not traditionally been seen as immigrant hubs. Moreover, in the Northeast, New York continues to be a melting pot with a diverse array of immigrant groups, including significant populations from the Dominican Republic and China.
Interestingly, even in less populous states such as Montana and South Dakota, the immigrant groups present are often unexpected. For instance, the largest immigrant group in South Dakota consists of individuals from the Philippines, many of whom have come to work in healthcare and service industries. This highlights how immigration can reshape even the least expected corners of the country.
Significance and Impact
Understanding the largest immigrant groups in each state provides insight into broader societal trends and shifts. It helps us grasp not only the diversity of the U.S. population but also the economic contributions these groups make. For instance, immigrant communities often fill crucial labor gaps in various sectors, from agriculture to technology. This dynamic is especially relevant in today’s economy, where labor shortages are becoming a pressing issue.
Moreover, these demographics influence cultural exchange, leading to richer, more diverse communities. However, immigration also brings challenges, such as integration and resource allocation, which can spark debates in local and national politics. As we look ahead, the U.S. is expected to see continued shifts in its immigration landscape influenced by global events, economic trends, and changing policies. Understanding these patterns will be essential for fostering inclusive communities and addressing the needs of all residents.
In summary, this map is more than just a representation of numbers; it encapsulates the stories, struggles, and contributions of millions of individuals who have chosen the U.S. as their home. The diversity of immigrant groups across states reminds us of the rich, multicultural tapestry that makes up the United States.
Visualization Details
- Published
- August 26, 2025
- Views
- 206
Comments
Loading comments...