
Marcus Rodriguez
Historical Geography Expert
Marcus Rodriguez specializes in historical cartography and geographic data analysis. With a background in both history and geography, he brings unique...
Geographic Analysis
What This Map Shows
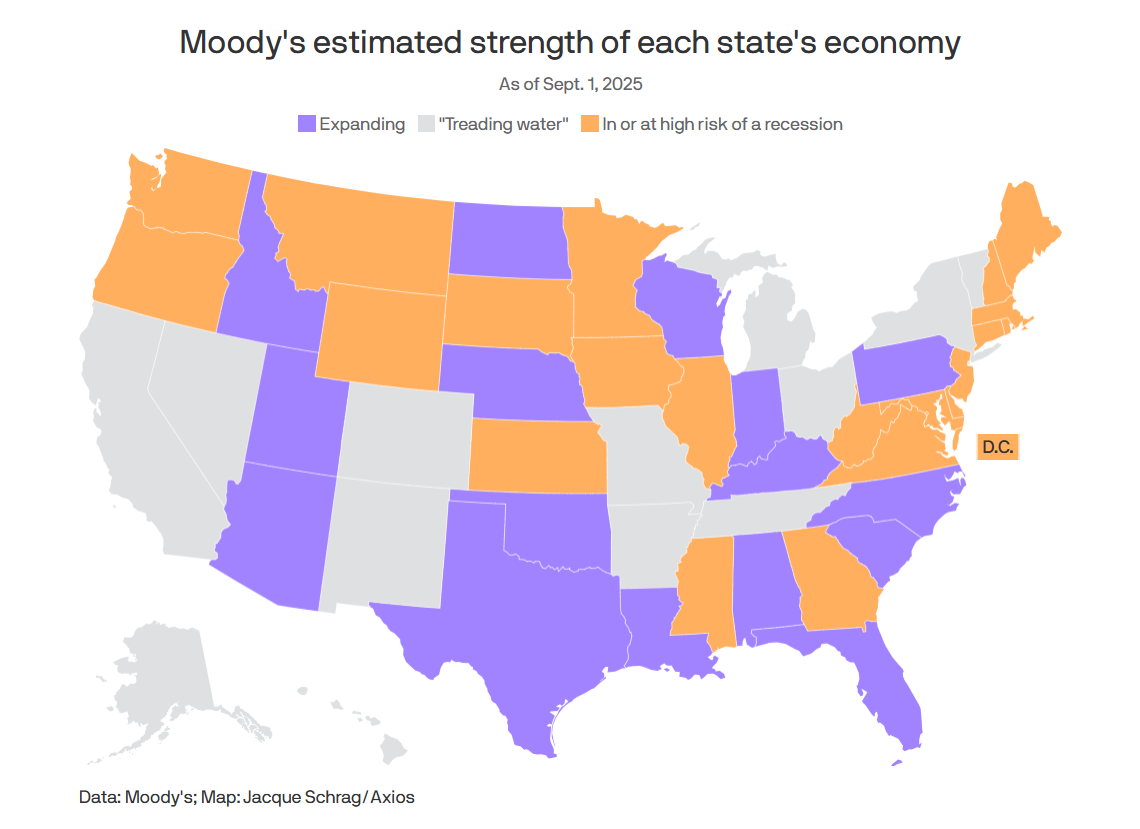
The "Recession in US States (September 2025)" map provides a detailed visualization of the economic landscape across the United States as the nation grapples with the effects of a recession. This map employs color coding to illustrate which states are experiencing significant economic downturns, allowing for a quick assessment of the geographic spread of financial distress. Understanding the states affected by recession is crucial for policymakers, businesses, and citizens alike, as it highlights regions where economic support and recovery efforts are urgently needed.
Deep Dive into Economic Recession
A recession is defined as a significant decline in economic activity across the economy, lasting longer than a few months. It is typically visible in real GDP, real income, employment, industrial production, and wholesale-retail sales. The current recession affecting the U.S. states in September 2025 is a product of various factors, including inflationary pressures, supply chain disruptions, and changes in consumer behavior following the post-pandemic recovery period. Interestingly, the map reveals that the impact of the recession is not uniform across the United States. Some states have been hit harder than others, which can often be attributed to their economic structures and reliance on specific industries.
For instance, states like California and New York, with significant tech and finance sectors, have shown higher rates of unemployment and business closures compared to states with more diversified economies. The presence of local industries, such as manufacturing in the Midwest or agriculture in the South, can buffer against economic downturns, but certain sectors may suffer heavily during a recession. In fact, according to recent statistics, states like Nevada and Hawaii, which rely heavily on tourism, have seen unemployment rates soar, as travel restrictions and economic uncertainty lead to decreased visitor numbers.
Moreover, the map highlights how certain regions may be better equipped to weather the storm thanks to previous investments in economic diversification and workforce development. For example, states that have invested in renewable energy and technology sectors may experience a less severe impact than those that are heavily dependent on fossil fuels or single industries. This divergence illustrates the importance of economic resilience and adaptability in the face of economic challenges.
Regional Analysis
Examining the map closely, we see stark contrasts among various regions of the United States. The Northeast, traditionally a hub for finance and technology, is marked by significant recessional impacts, particularly in urban centers. States like New Jersey and Massachusetts are grappling with high unemployment and business closures, while rural areas in the same states may report less severe impacts due to a slower pace of economic activity.
Conversely, the South shows a mixed picture. States like Texas and Florida, which have diversified economies, are experiencing milder recession effects. Texas, with its energy sector and strong job market, has been able to maintain a relatively stable economy, while Florida’s tourism-driven economy is facing challenges but has been resilient due to a strong domestic travel response.
Interestingly, the Midwest presents a unique case. States such as Michigan, which have historically faced economic challenges, are now showing signs of recovery due to a resurgence in manufacturing and automotive industries. This shift suggests a potential for resilience despite the broader economic troubles depicted in the map, highlighting how local conditions and industries can influence economic outcomes.
Significance and Impact
Understanding the geographic distribution of recession impacts across the U.S. is not just a matter of economic interest; it has real-world implications for millions of Americans. Economic downturns can lead to increased unemployment, reduced consumer spending, and decreased public services. This map serves as a crucial tool for policymakers seeking to allocate resources effectively and implement targeted interventions where they are needed most.
Moreover, the insights gleaned from this visualization can inform future economic strategies. For instance, recognizing which states are more vulnerable to economic shocks can guide investment in infrastructure, education, and workforce training programs. In the long run, states that adapt swiftly to changing economic landscapes are likely to emerge stronger after recessions.
As we move forward, it’s essential to monitor trends and developments as they unfold. The economic landscape is dynamic, and while this map captures a moment in time, it also serves as a reminder of the resilience and adaptability required to navigate future challenges. Have you noticed how different regions respond to economic pressures? The conversation around economic recovery and resilience is more important now than ever, making this map not just a snapshot of a moment, but a call to action for proactive measures and informed decision-making.
Comments
Loading comments...