US County-Level GDP Per Capita Map 2022

Alex Cartwright
Senior Cartographer & GIS Specialist
Alex Cartwright is a renowned cartographer and geographic information systems specialist with over 15 years of experience in spatial analysis and data...
Geographic Analysis
What This Map Shows
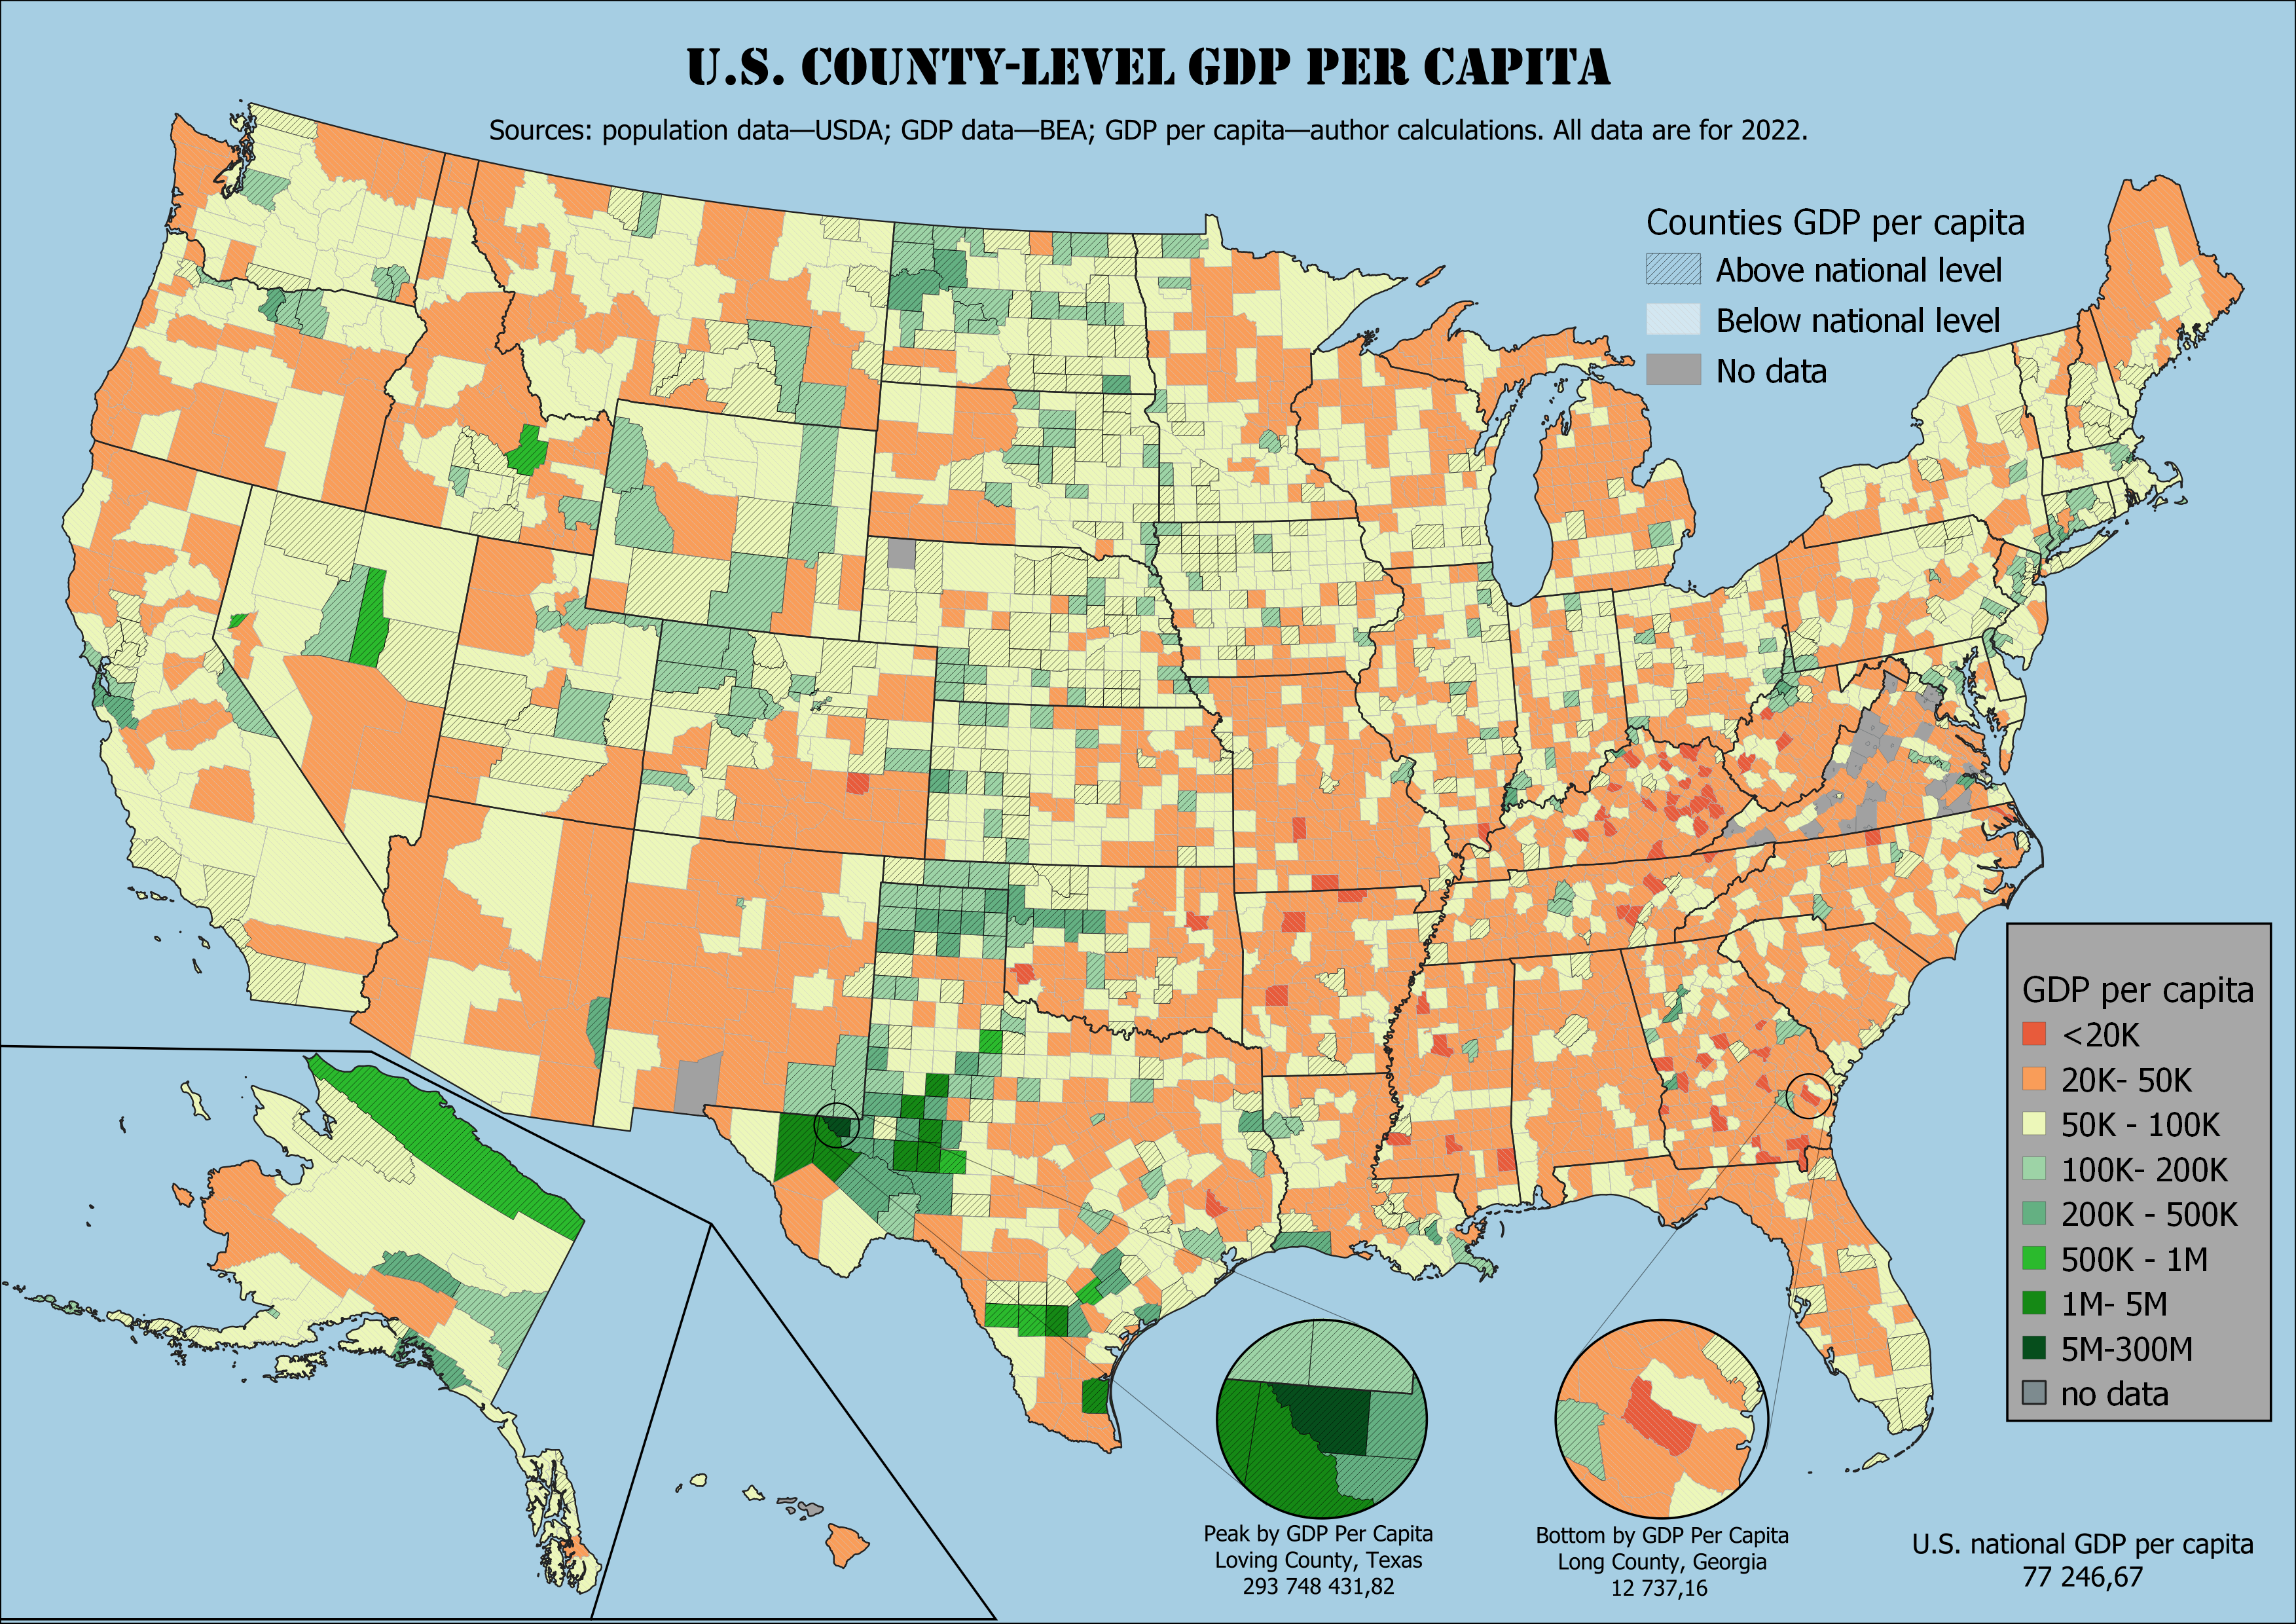
The "US County-Level GDP Per Capita, 2022" map provides a detailed visualization of the economic performance across various counties in the United States. GDP per capita is a critical measure of economic activity, representing the average economic output per person in a specific area. This map highlights the disparities in economic wealth across counties, illustrating how some areas thrive while others lag behind. By examining GDP per capita, we gain insight into economic health, living standards, and potential growth opportunities in different regions.
Deep Dive into GDP Per Capita
GDP per capita is not just a number; it represents the economic vitality of a region and the well-being of its residents. It is calculated by dividing the total economic output of a county by its population. This metric can reveal a lot about the economic environment, including employment levels, income distribution, and local industry strength.
Interestingly, the GDP per capita varies significantly across the United States, influenced by factors such as industry composition, education levels, and local policies. For example, counties with robust technology sectors, like Santa Clara County in California, often exhibit much higher GDP per capita due to the high-value products and services generated there. In contrast, rural counties with economies based primarily on agriculture may show lower figures, reflecting less economic diversification and lower average income levels.
As of 2022, some of the highest GDP per capita figures are found in metropolitan areas, where the concentration of businesses and services drives economic growth. Conversely, many rural areas struggle with lower GDP per capita, often due to population decline, lack of infrastructure, and limited access to education and healthcare. Understanding these disparities is crucial for policymakers aiming to stimulate economic growth and improve the quality of life for all residents.
Regional Analysis
When we break down the map regionally, the differences become even more pronounced. In the Northeast, counties like New York and Washington D.C. show incredibly high GDP per capita, primarily driven by finance, technology, and government services. These areas benefit from a dense population of educated individuals and significant investment, creating a cycle of wealth accumulation.
Moving to the Midwest, counties may show more varied GDP per capita figures, often reflecting a mix of agriculture and manufacturing. For instance, counties in Illinois with strong agricultural bases might lag behind those with diversified economies involving tech or finance.
Southern counties often display a mixed bag of economic performance. Urban centers like Atlanta are thriving, while rural areas in states like Mississippi may experience economic challenges, with GDP per capita figures significantly lower than the national average. What's fascinating is that even within the same state, the economic disparity can be stark; urban versus rural dynamics often create a tale of two economies.
Significance and Impact
Understanding the GDP per capita at the county level is essential for grasping the broader economic landscape of the United States. These figures not only reflect the current economic health of an area but can also serve as indicators of future growth and development. For instance, counties with rising GDP per capita often attract new businesses, leading to job creation and further economic expansion.
Conversely, areas with stagnant or declining GDP per capita may face significant challenges, such as decreased investment, population outmigration, and reduced public services. These trends can exacerbate social issues, including poverty and lack of access to education. Therefore, policymakers need to consider these disparities when planning economic development strategies.
Moreover, as the economy continues to evolve with technological advancements and global competition, understanding regional economic dynamics will become increasingly important. Have you noticed that some counties are embracing innovation while others are still reliant on traditional industries? This divergence could shape the future of America's economic landscape, making it crucial for communities to adapt and evolve.
In conclusion, the "US County-Level GDP Per Capita, 2022" map is more than just a visualization; it is a window into the economic disparities and opportunities that define the American landscape. By examining these figures closely, we can better understand our economy and work towards a more equitable future for all regions.
Visualization Details
- Published
- August 14, 2025
- Views
- 64
Comments
Loading comments...