data visualization Maps
24 geographic visualizations tagged with "data visualization"
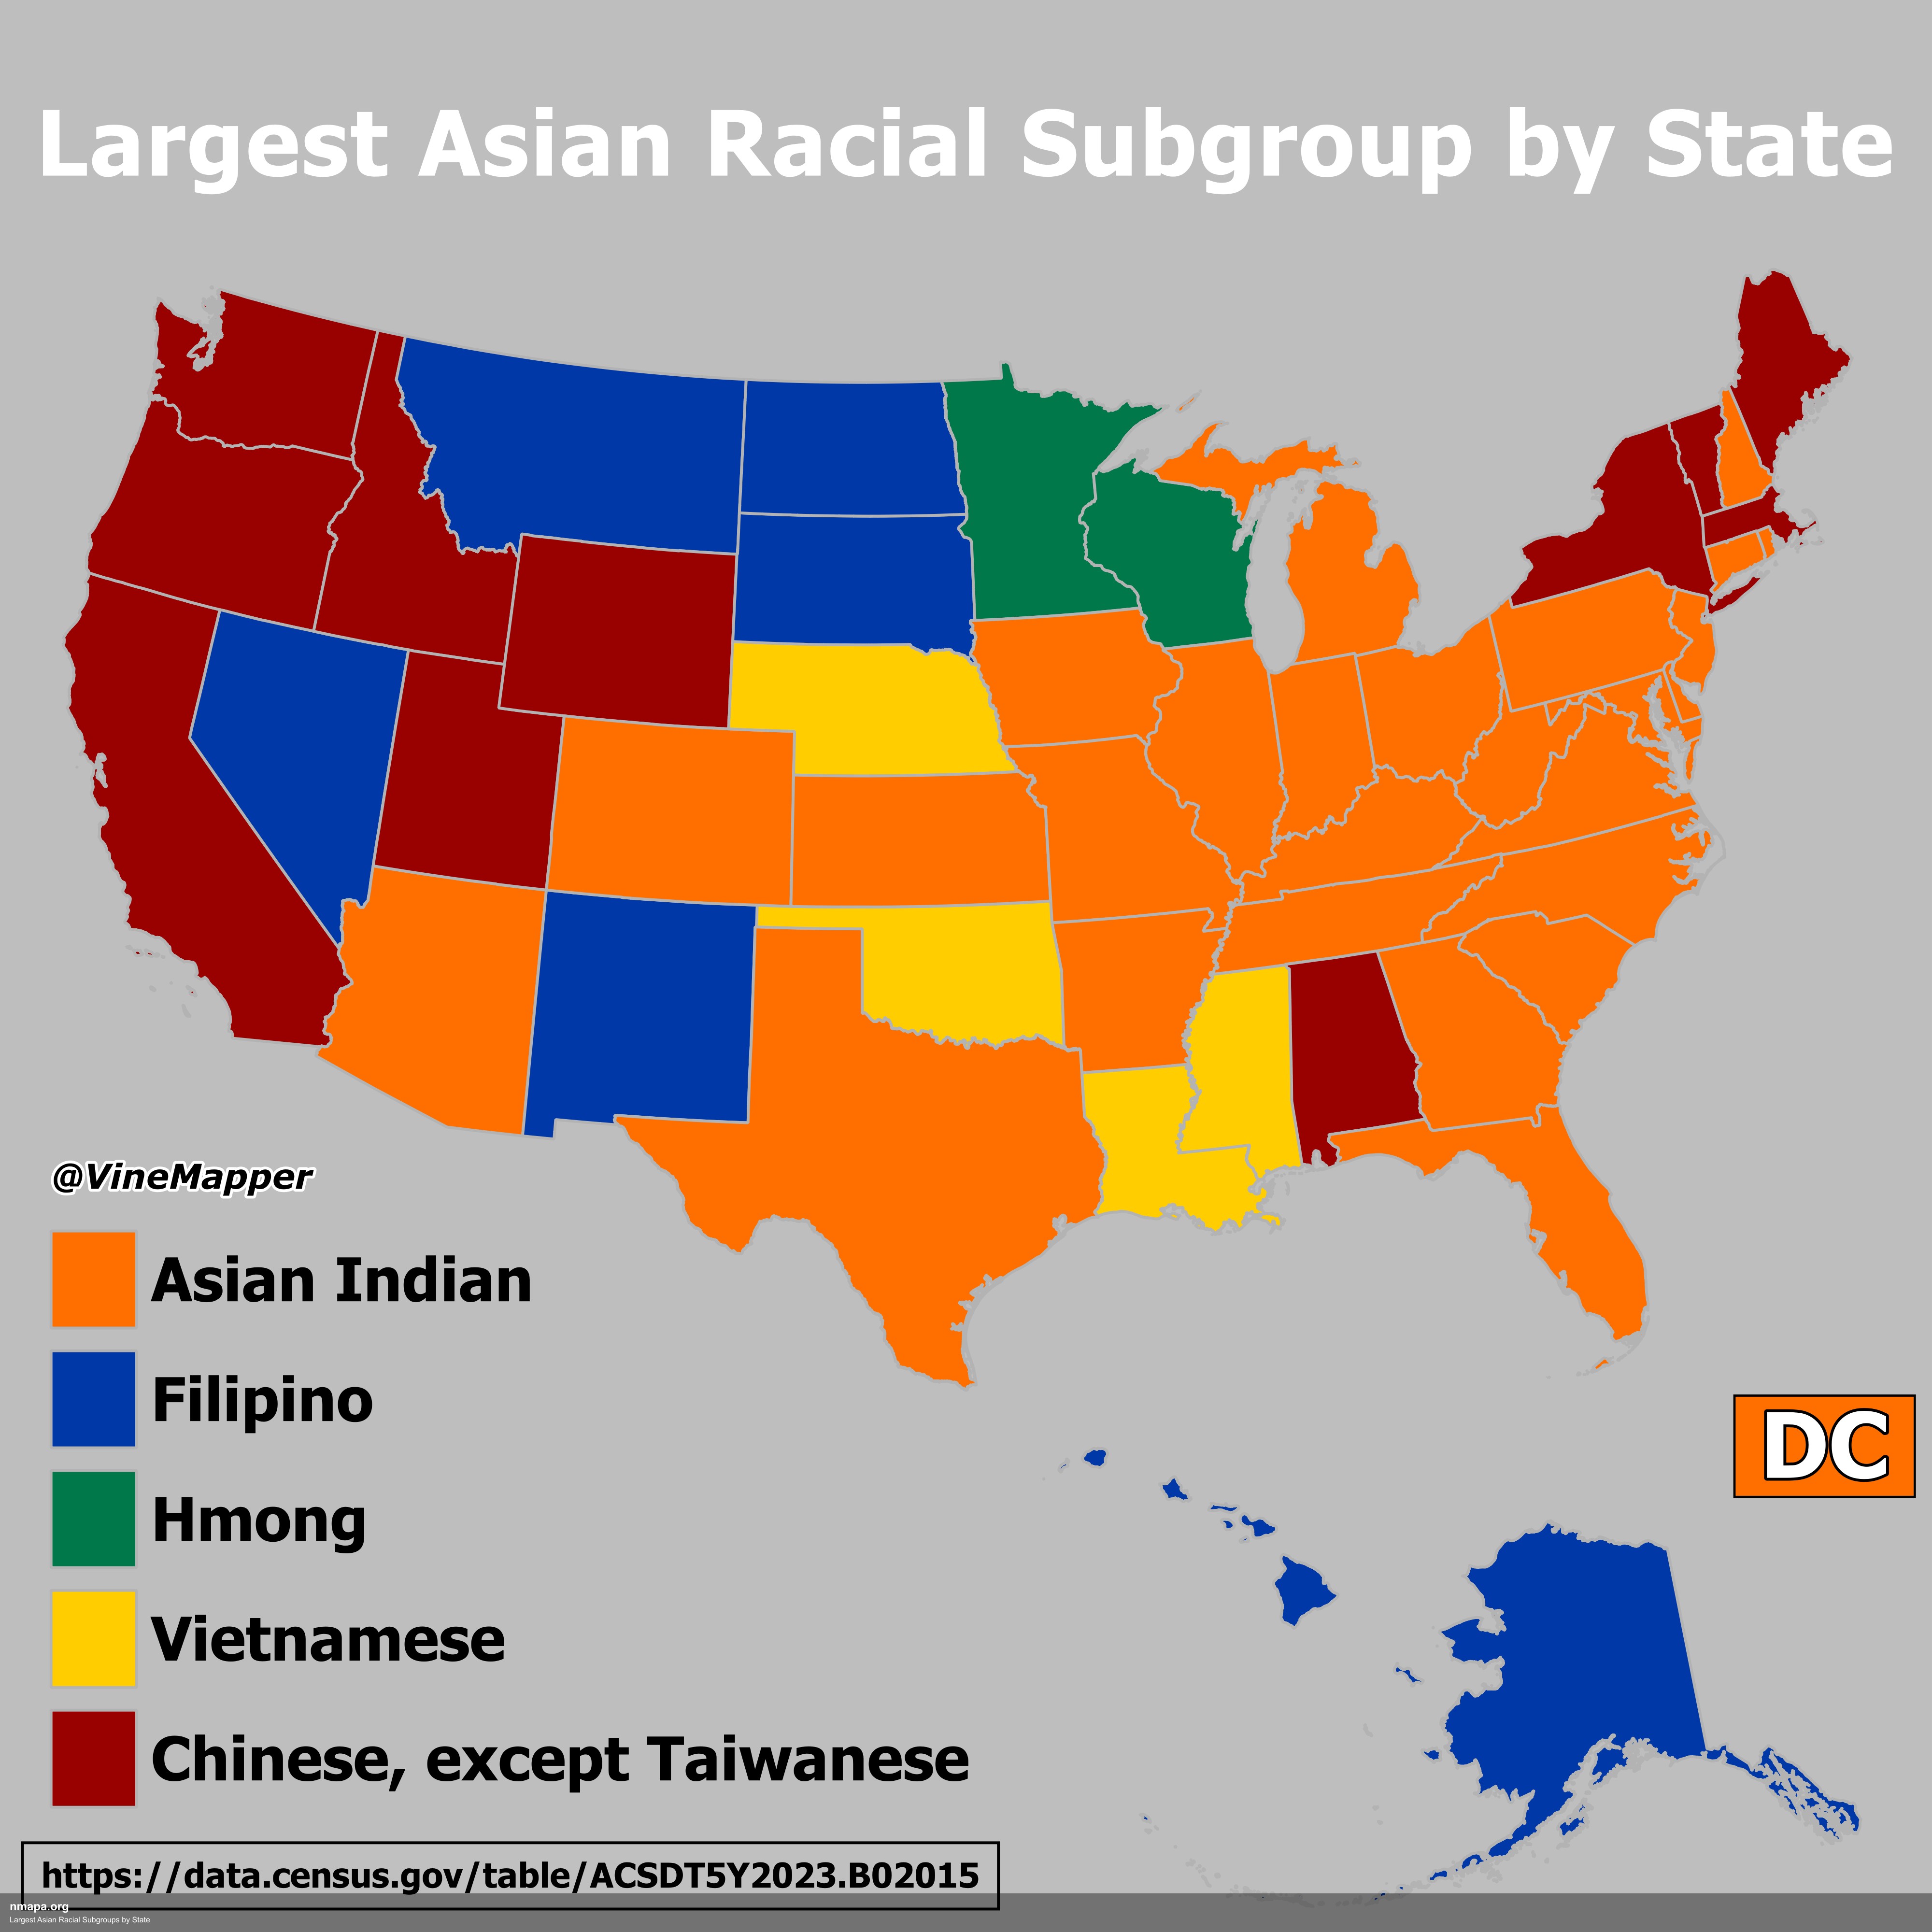
Largest Asian Racial Subgroups by State Map
This map displays "Largest Asian Racial Subgroups by State" and provides a clear visual representation of the geographic...
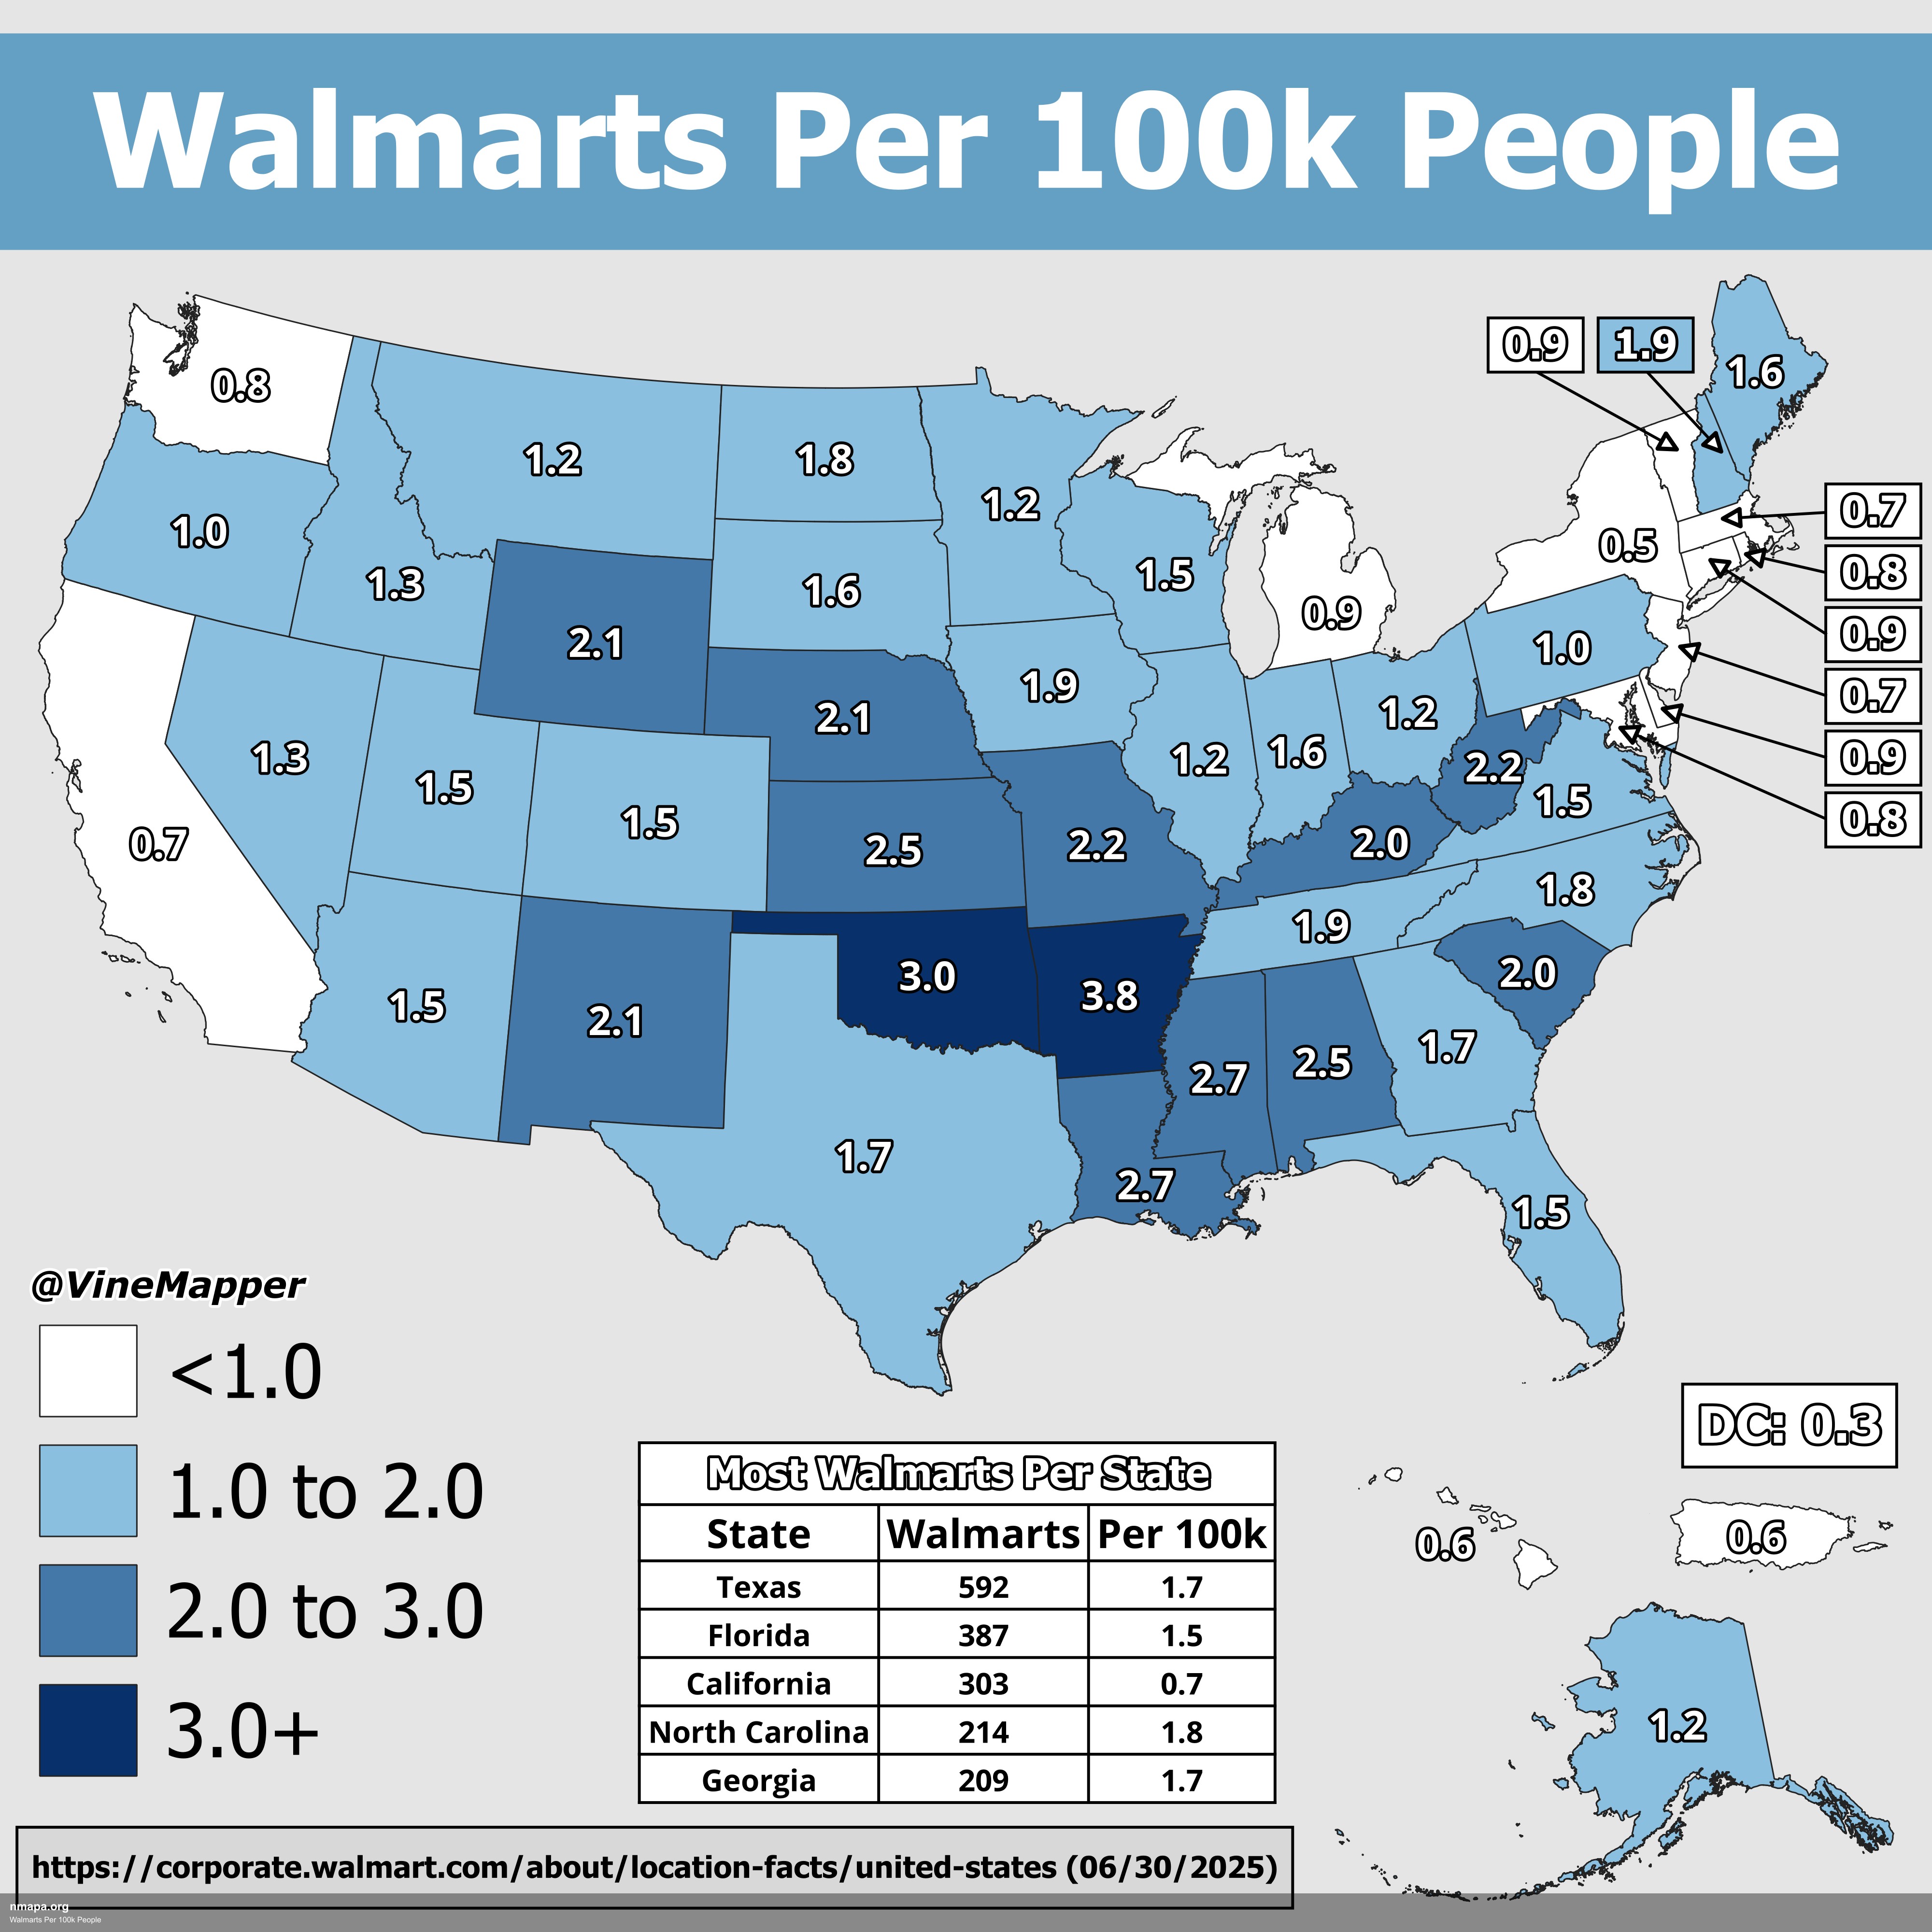
Walmarts Per 100k People Map
This geographical visualization presents "Walmarts Per 100k People" as a comprehensive map that displays spatial data pa...
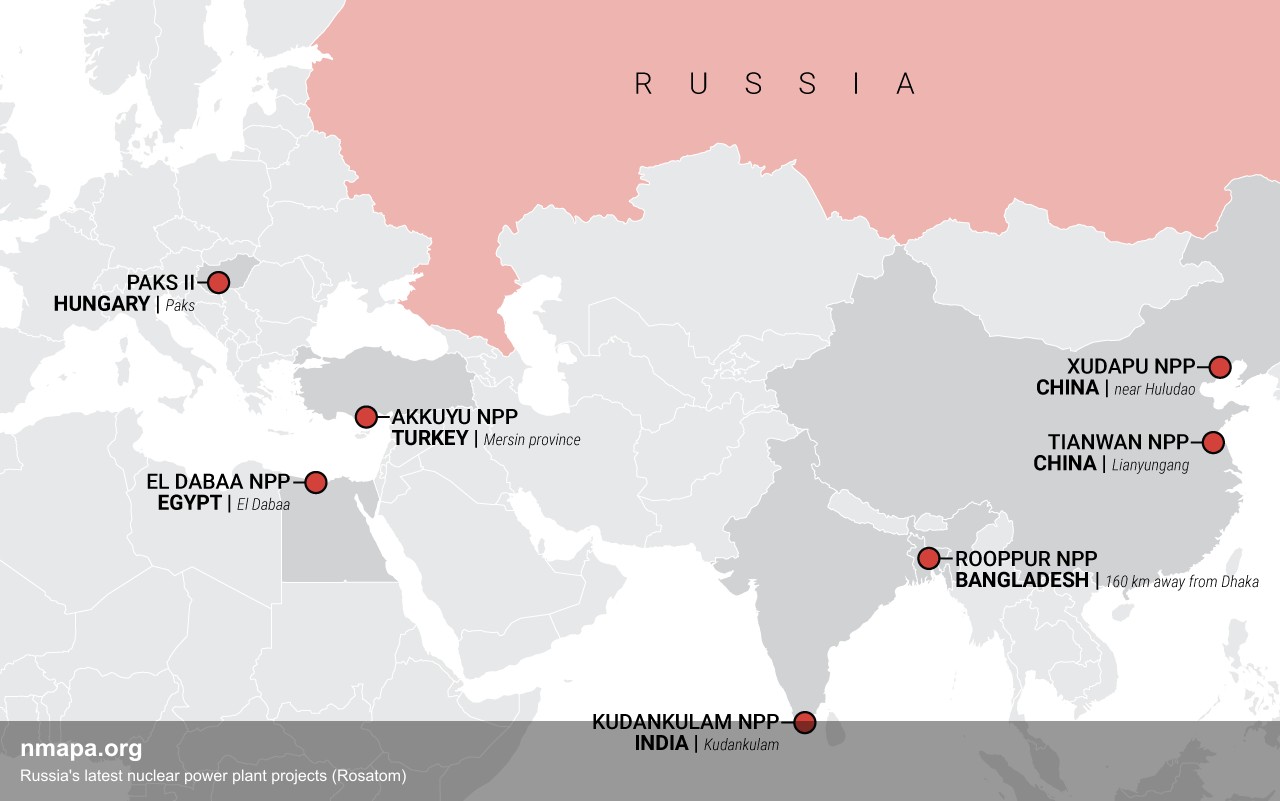
Russia's latest nuclear power plant projects (Rosatom) Map
This geographical visualization presents "Russia's latest nuclear power plant projects (Rosatom)" as a comprehensive map...
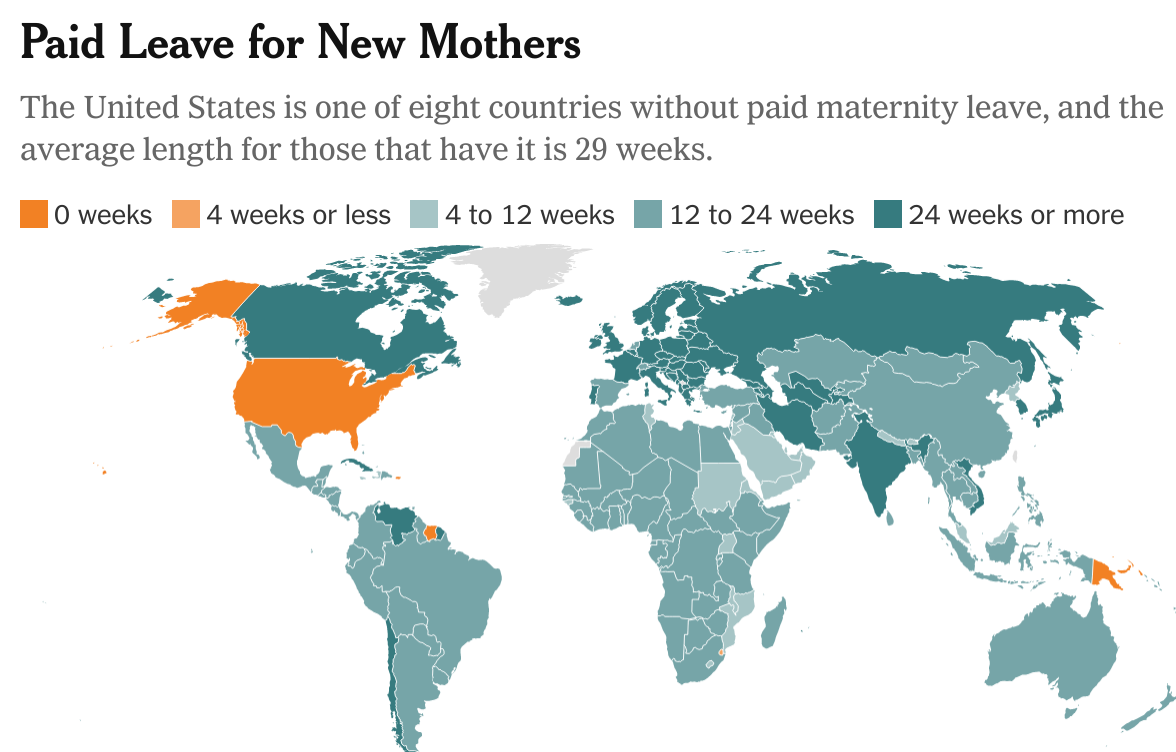
Global GDP Per Capita Map
This map provides a visual representation of Gross Domestic Product (GDP) per capita across countries worldwide. GDP per...
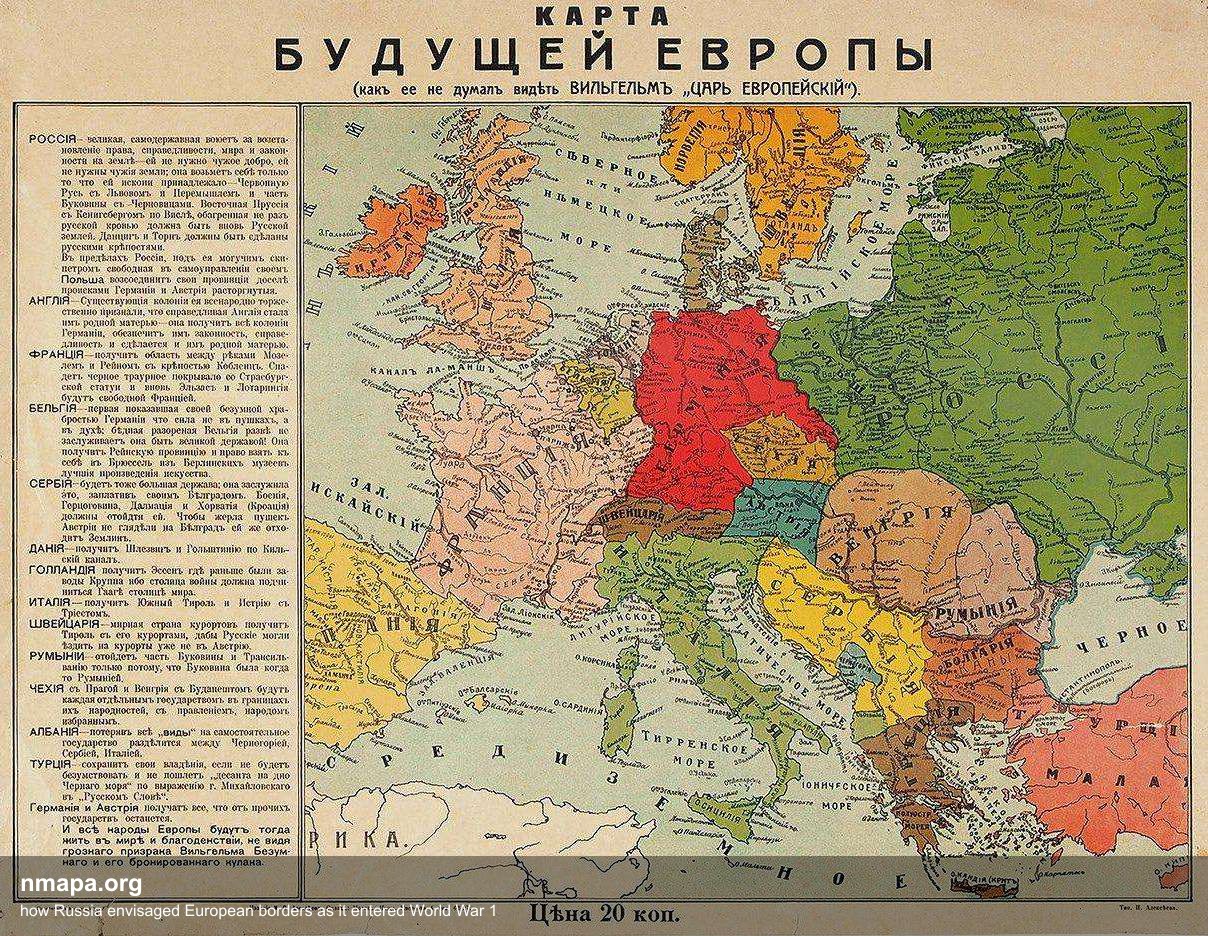
how Russia envisaged European borders as it entered World War 1 Map
This comprehensive geographical visualization presents "how Russia envisaged European borders as it entered World War 1"...
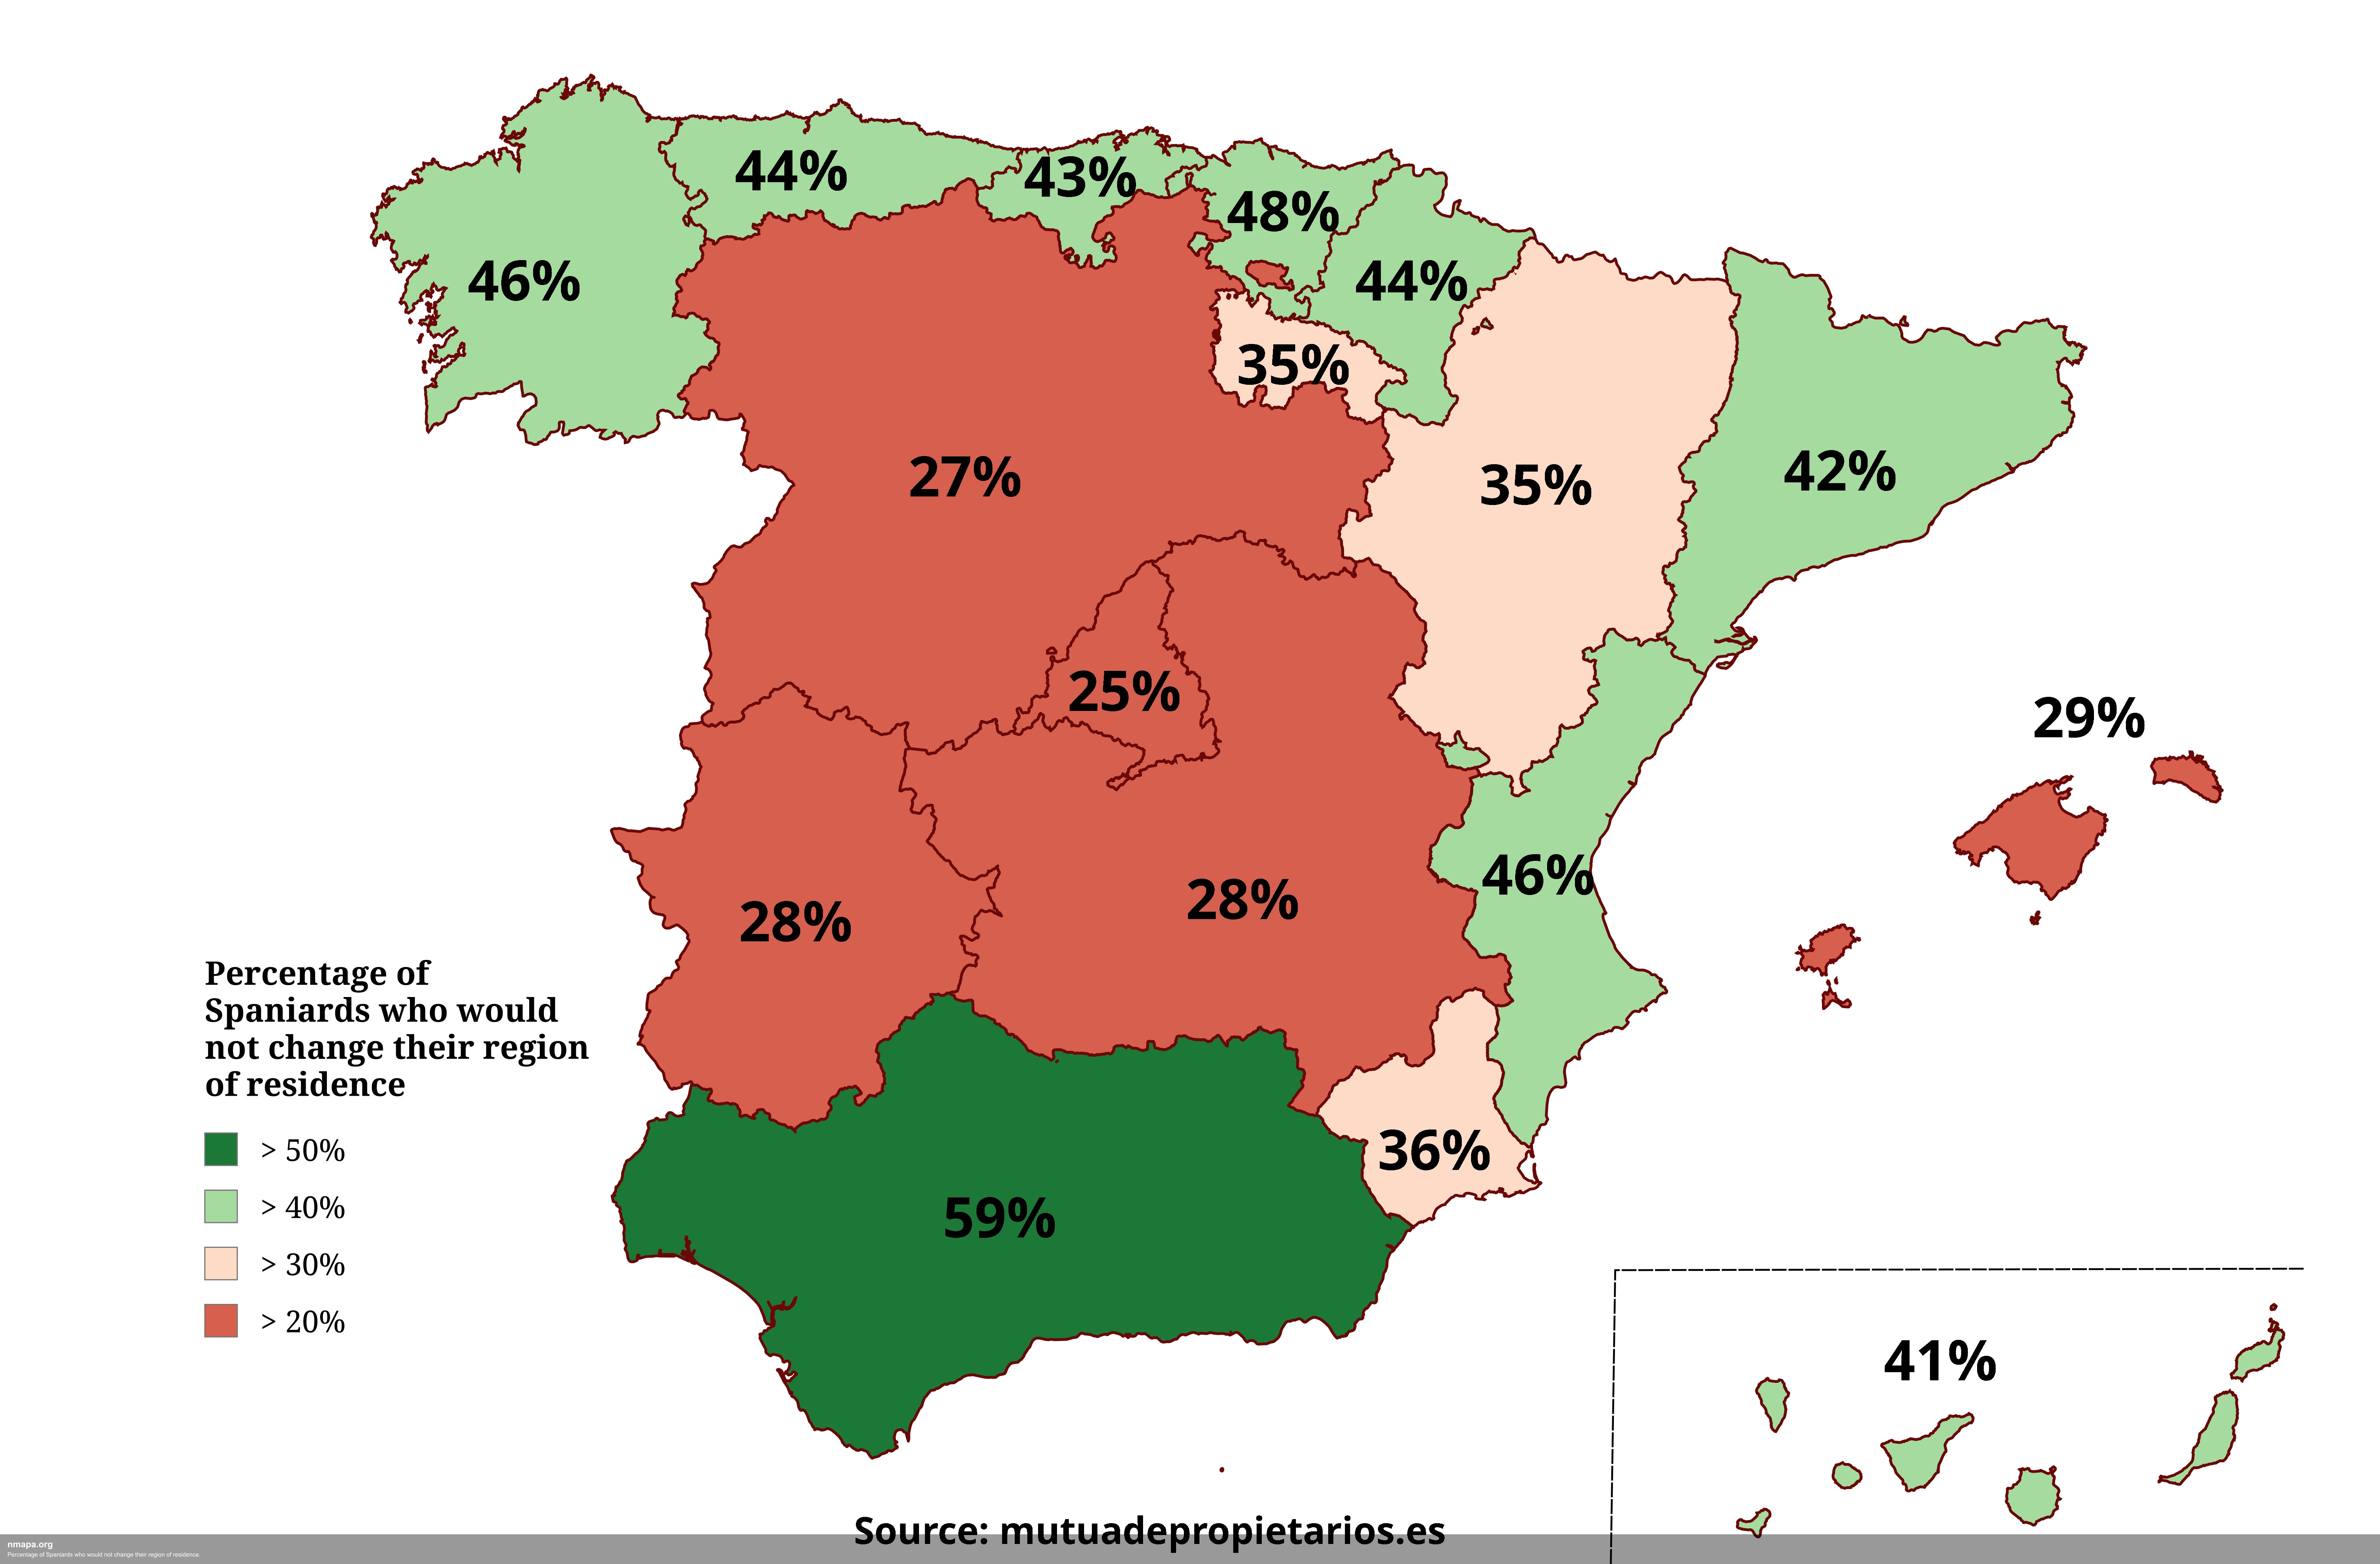
Percentage of Spaniards who would not change their region of residence. Map
This comprehensive geographical visualization presents "Percentage of Spaniards who would not change their region of res...
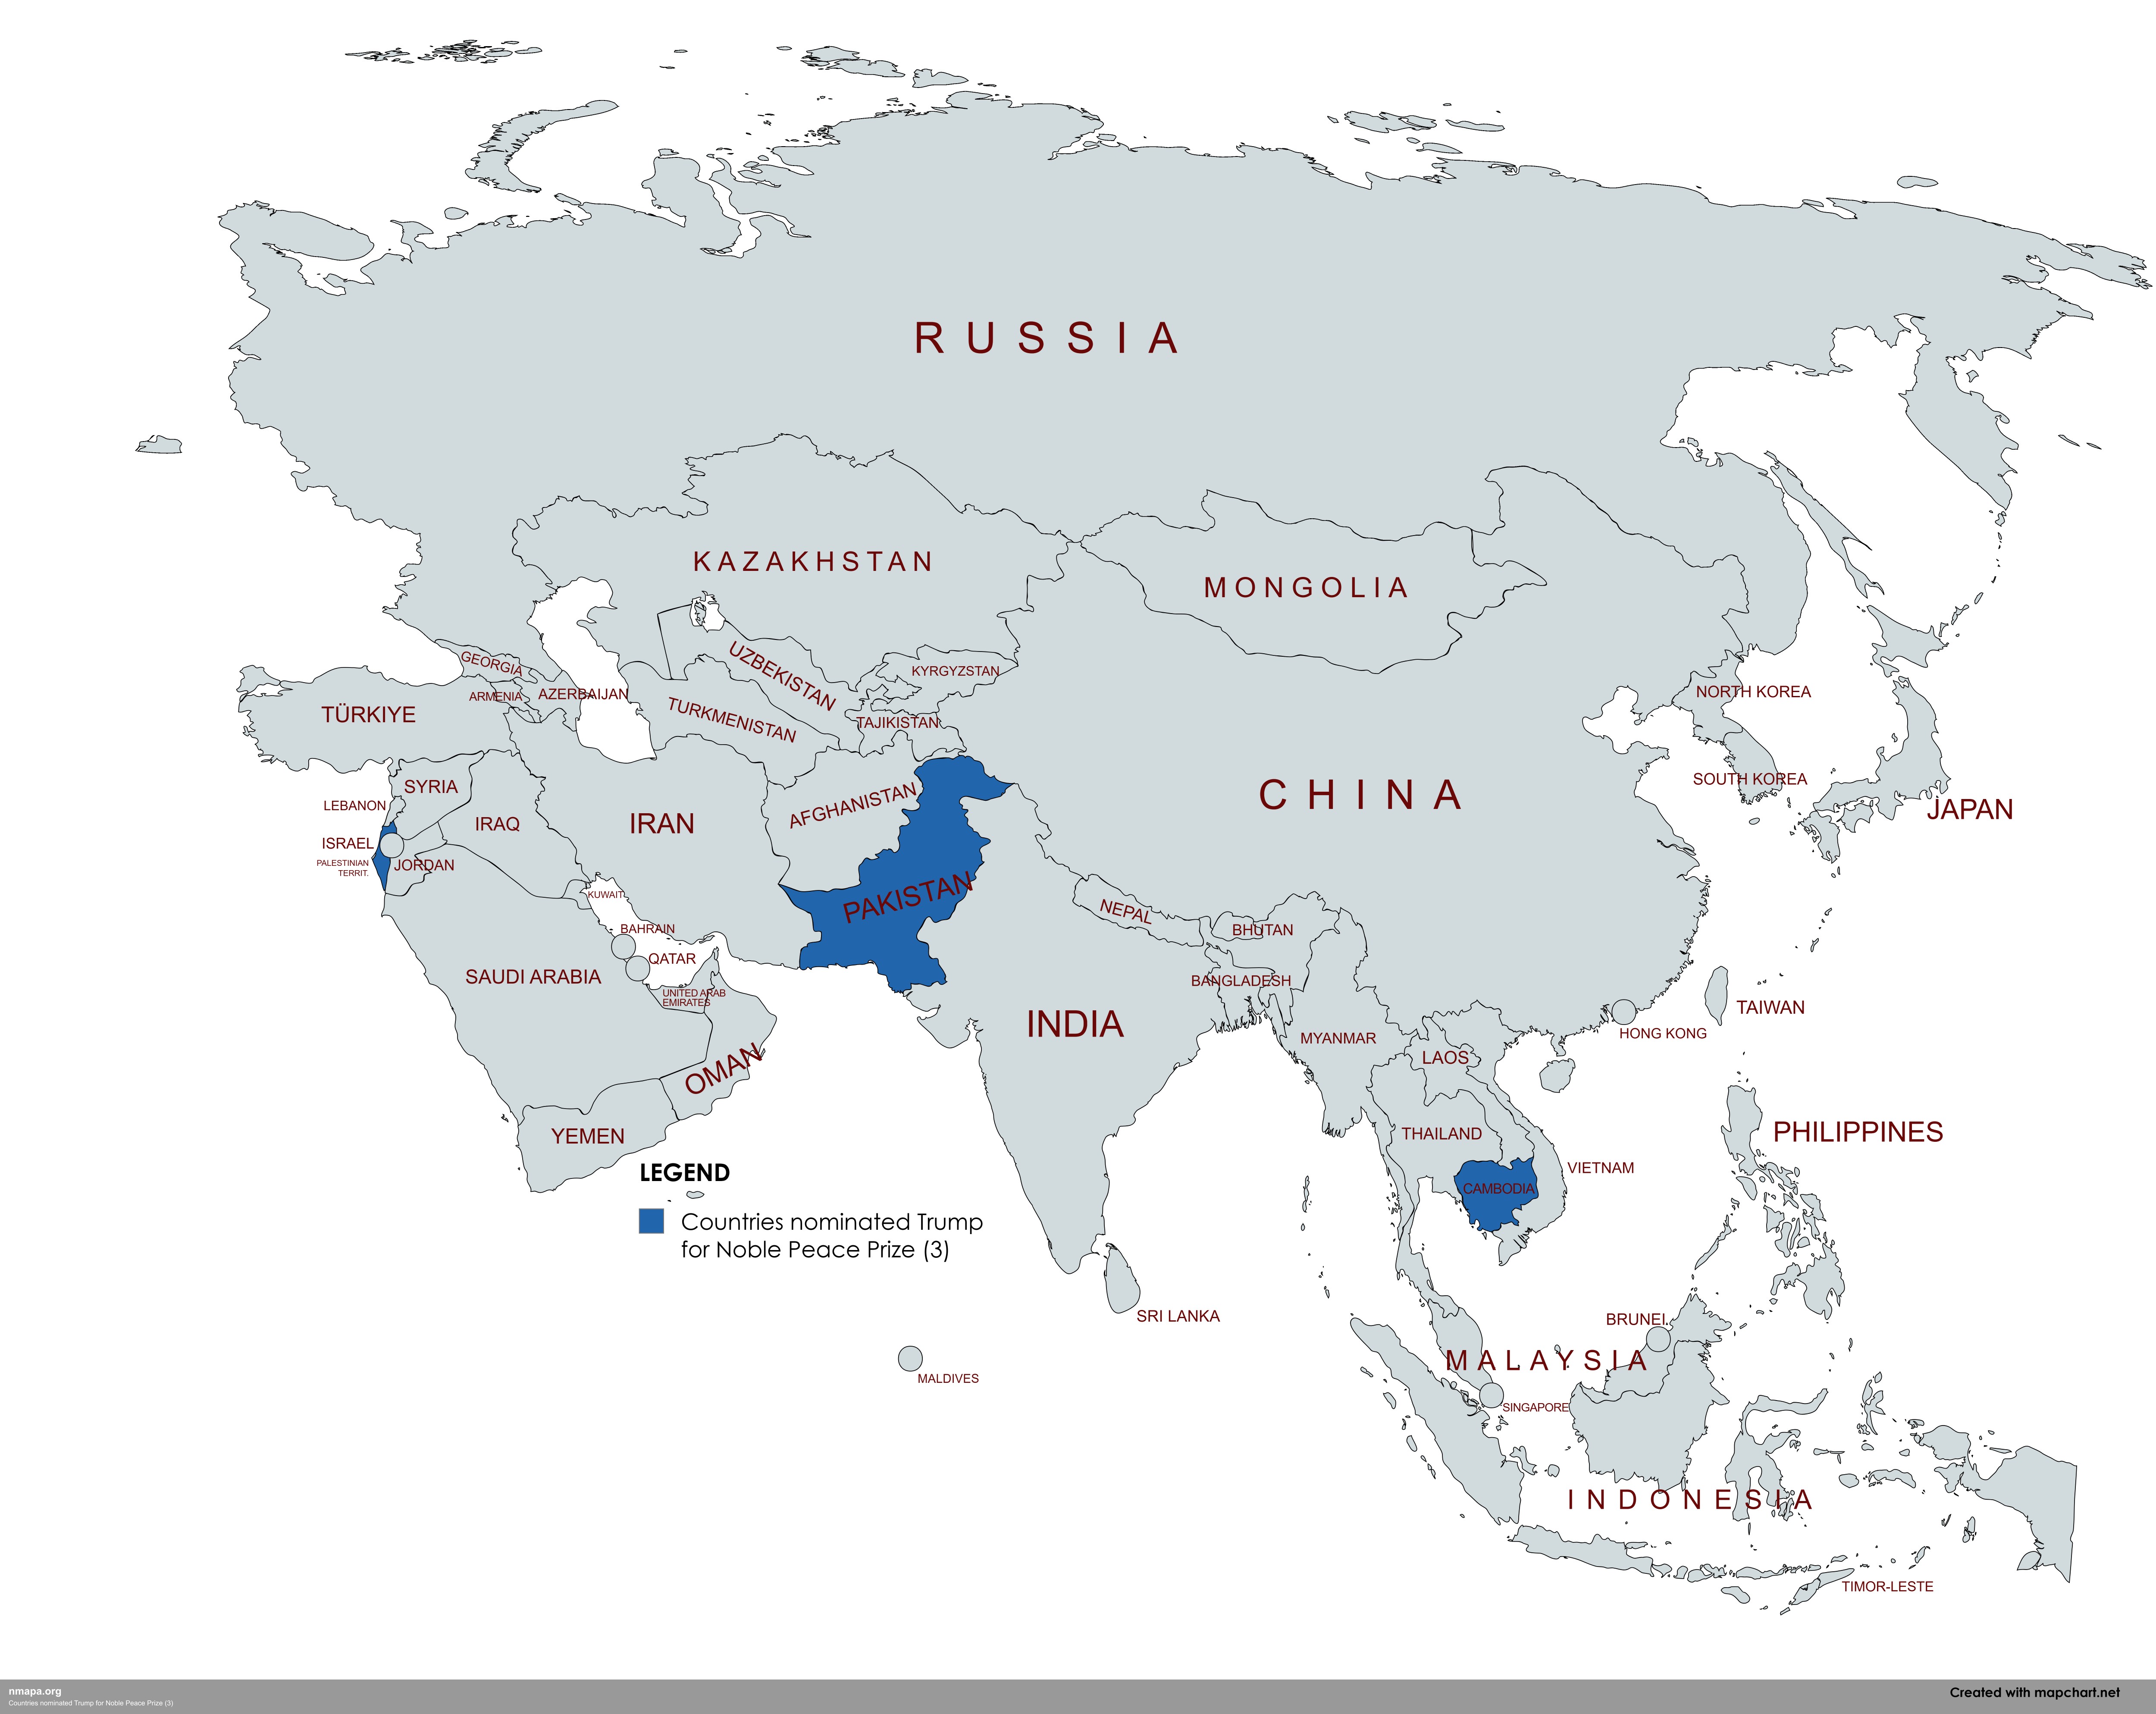
Countries nominated Trump for Noble Peace Prize (3) Map
This comprehensive geographical visualization presents "Countries nominated Trump for Noble Peace Prize (3)" in an acces...
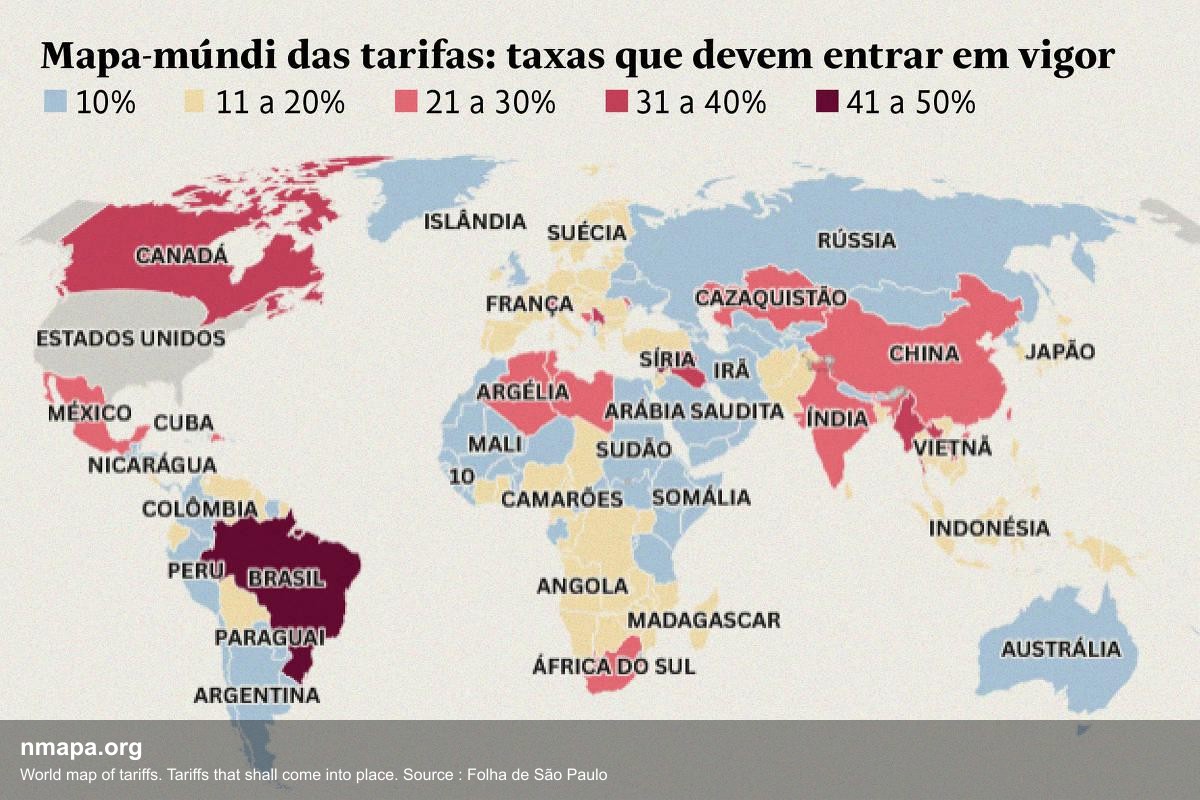
World map of tariffs. Tariffs that shall come into place. Source : Folha de São Paulo
This comprehensive geographical visualization presents "World map of tariffs. Tariffs that shall come into place. Source...
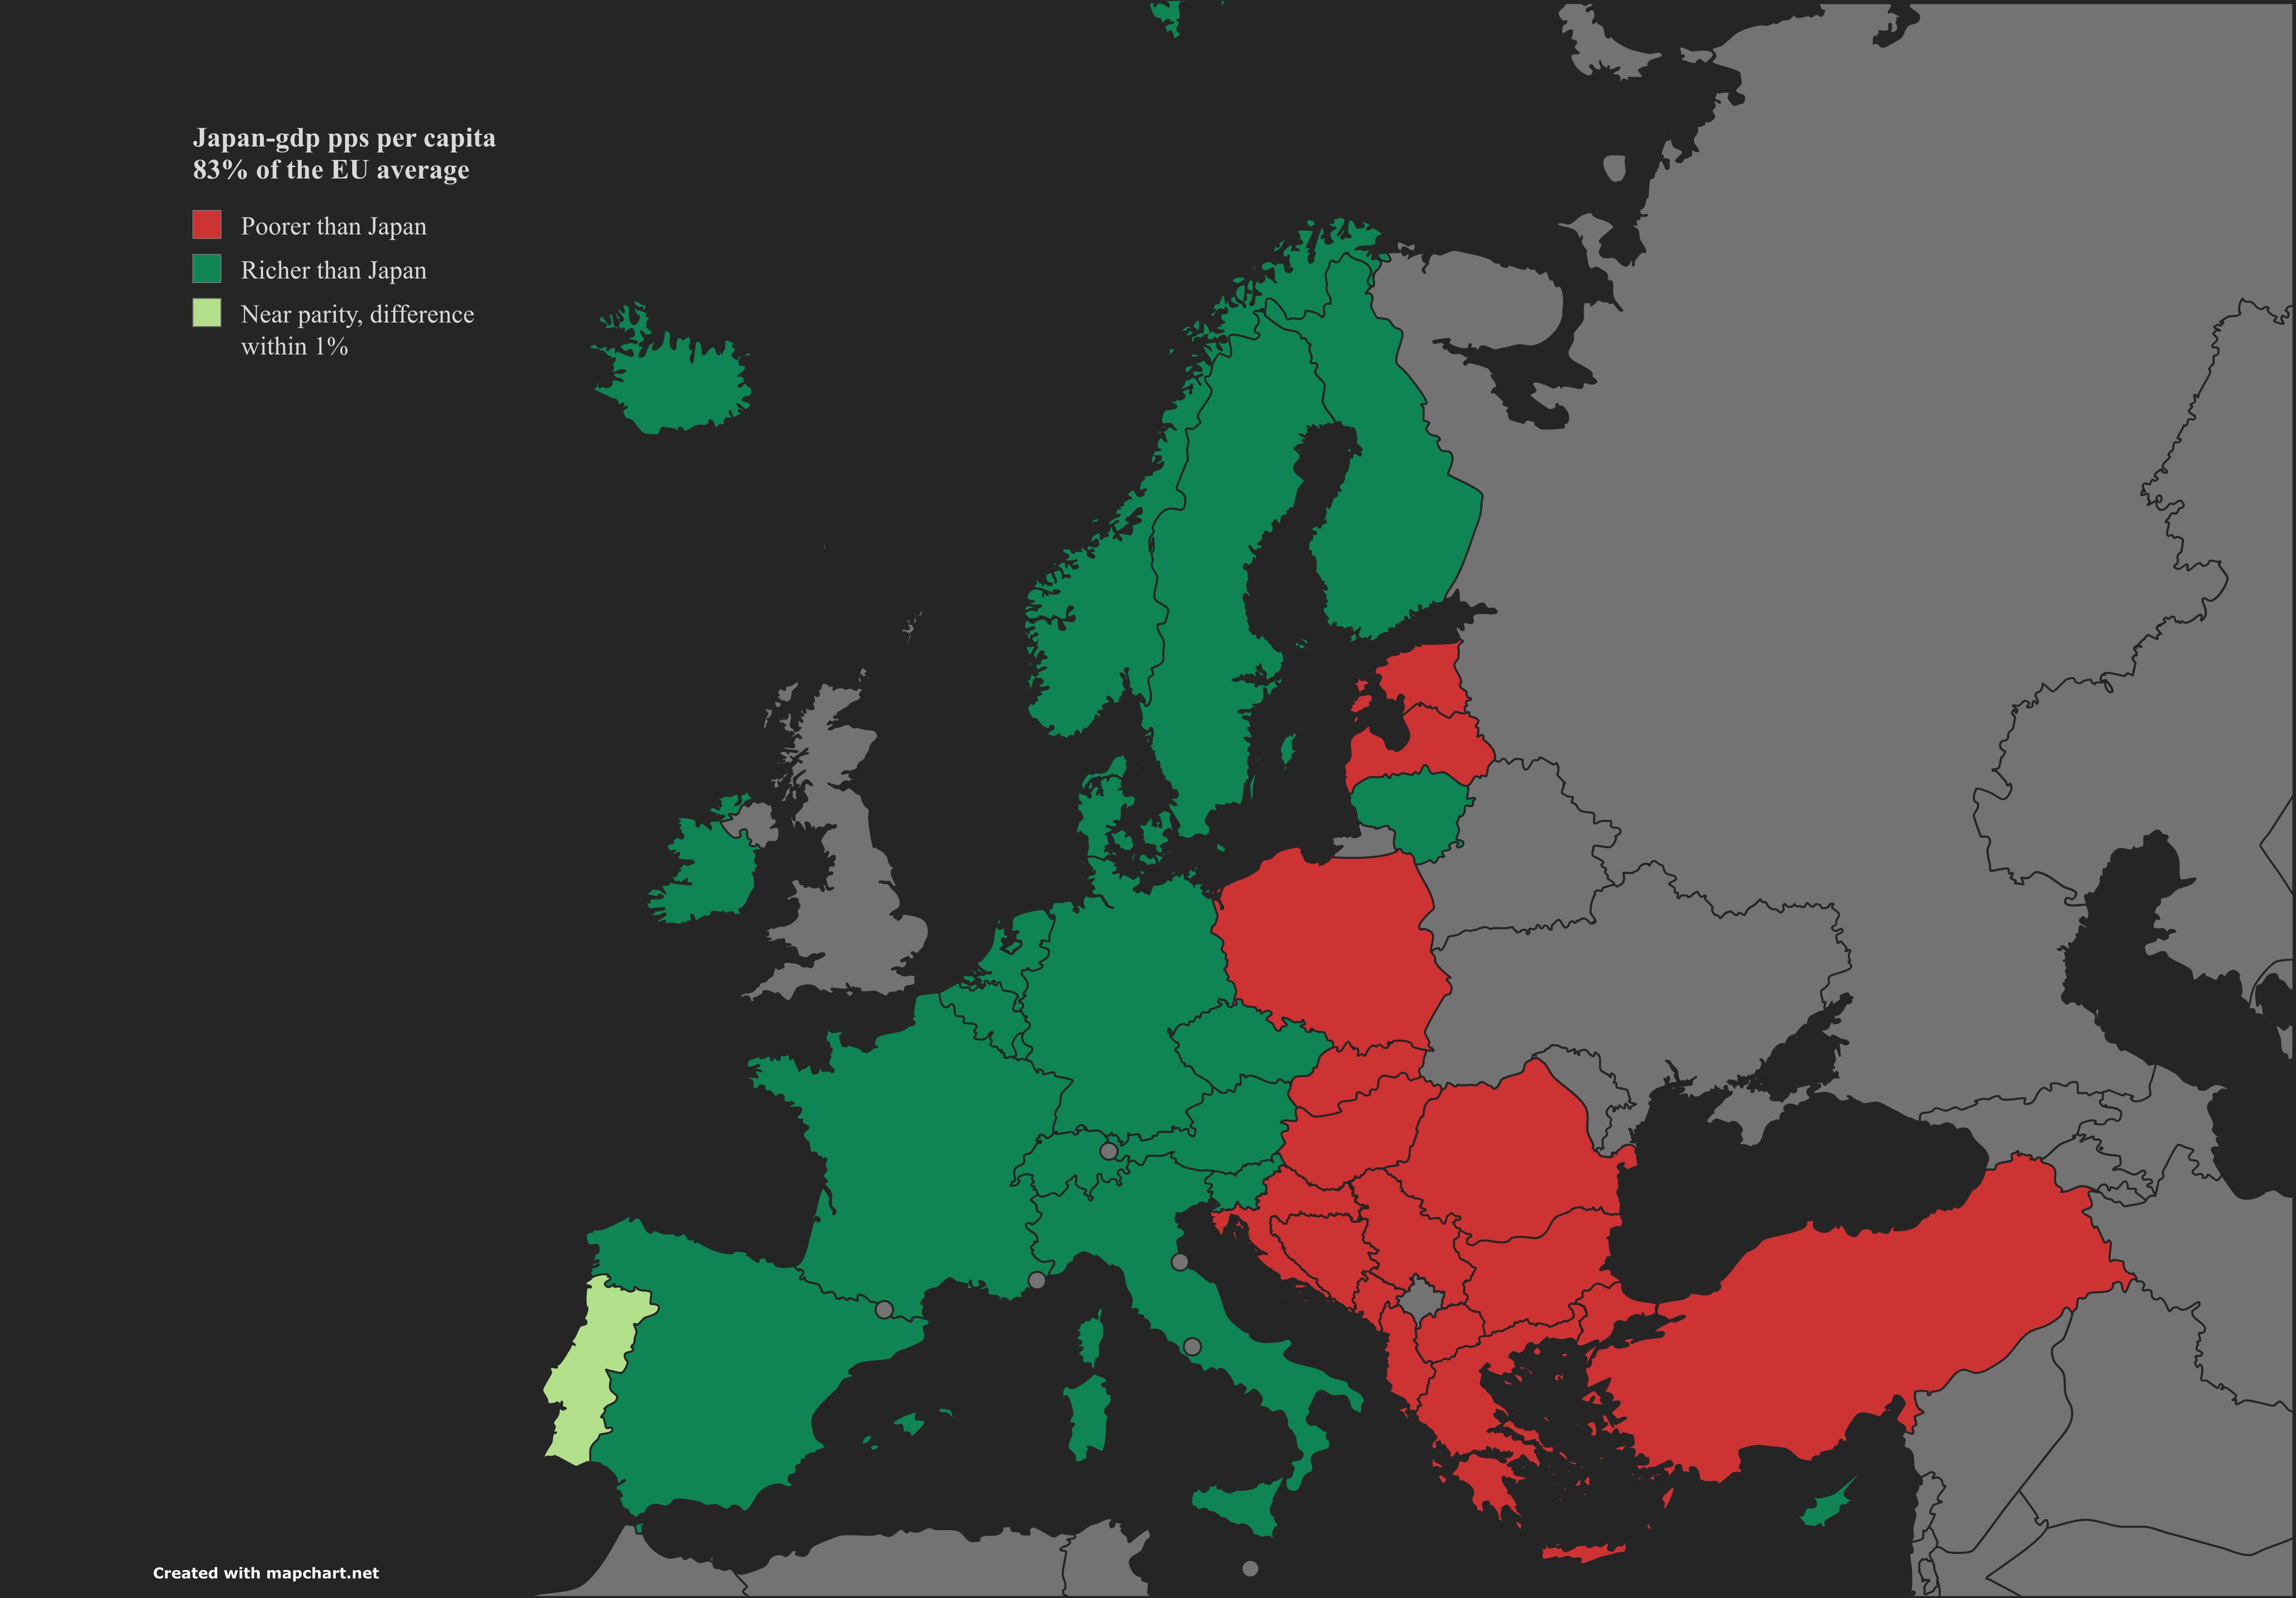
GDP PPS Per Capita Comparison Map: Japan and Europe
The visualization titled "Yen Meets Euro" presents a detailed comparison of Japan's GDP per capita in purchasing power s...
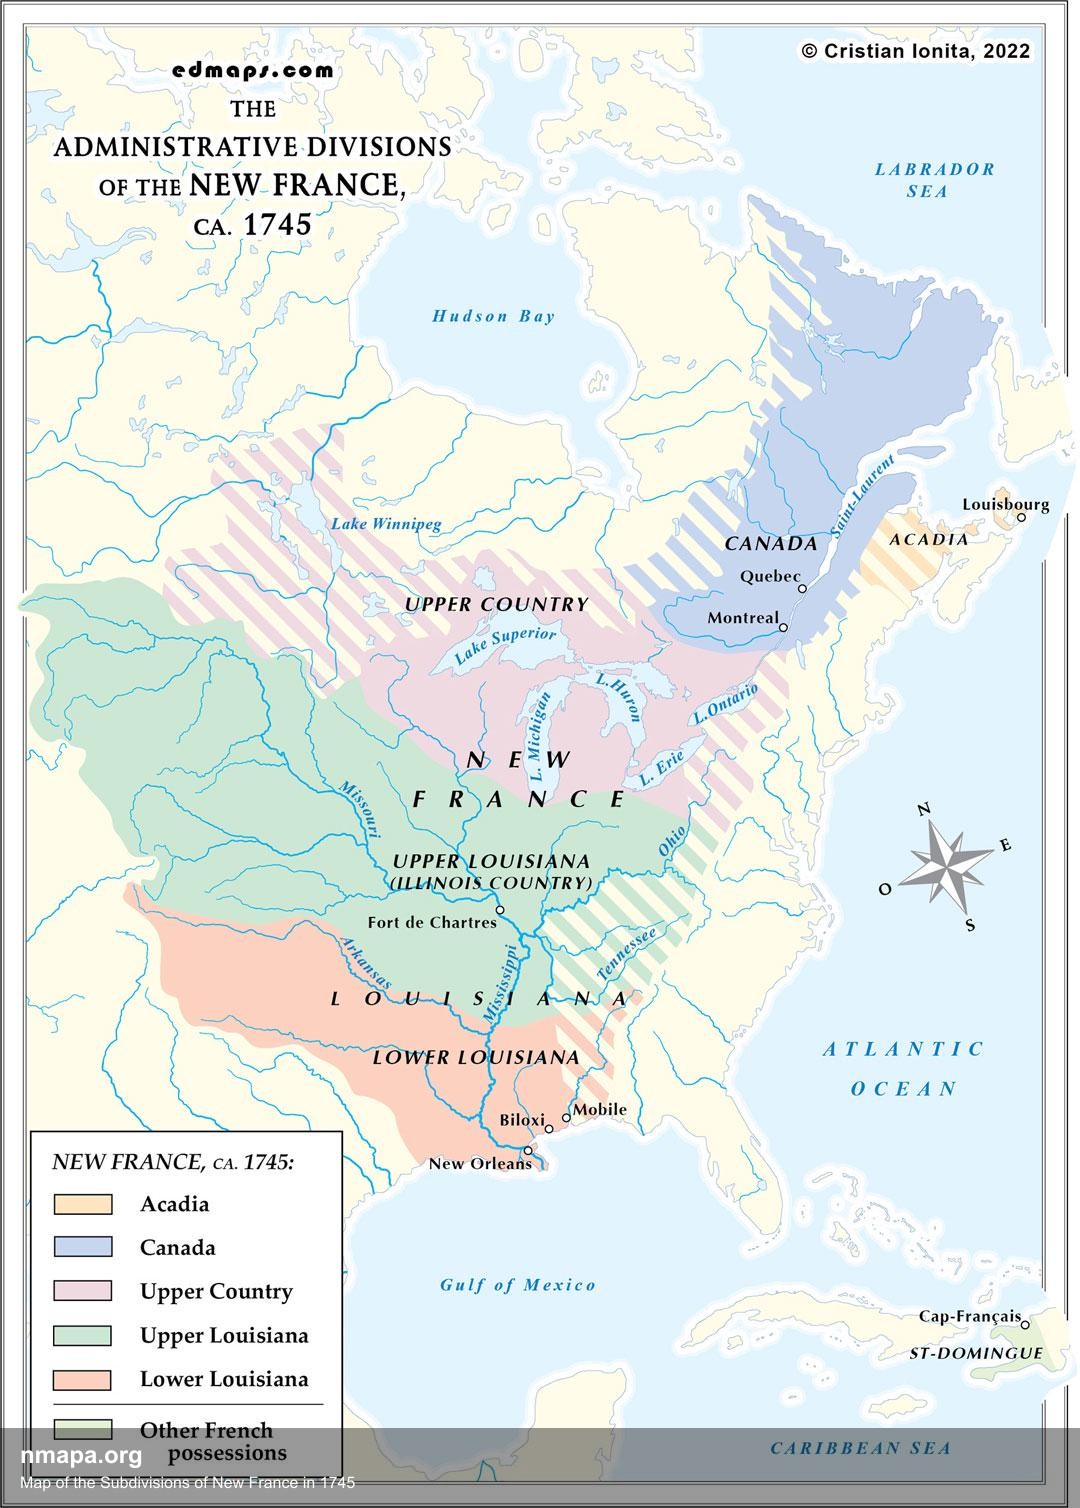
Map of the Subdivisions of New France in 1745
This comprehensive geographical visualization presents "Map of the Subdivisions of New France in 1745" in an accessible ...
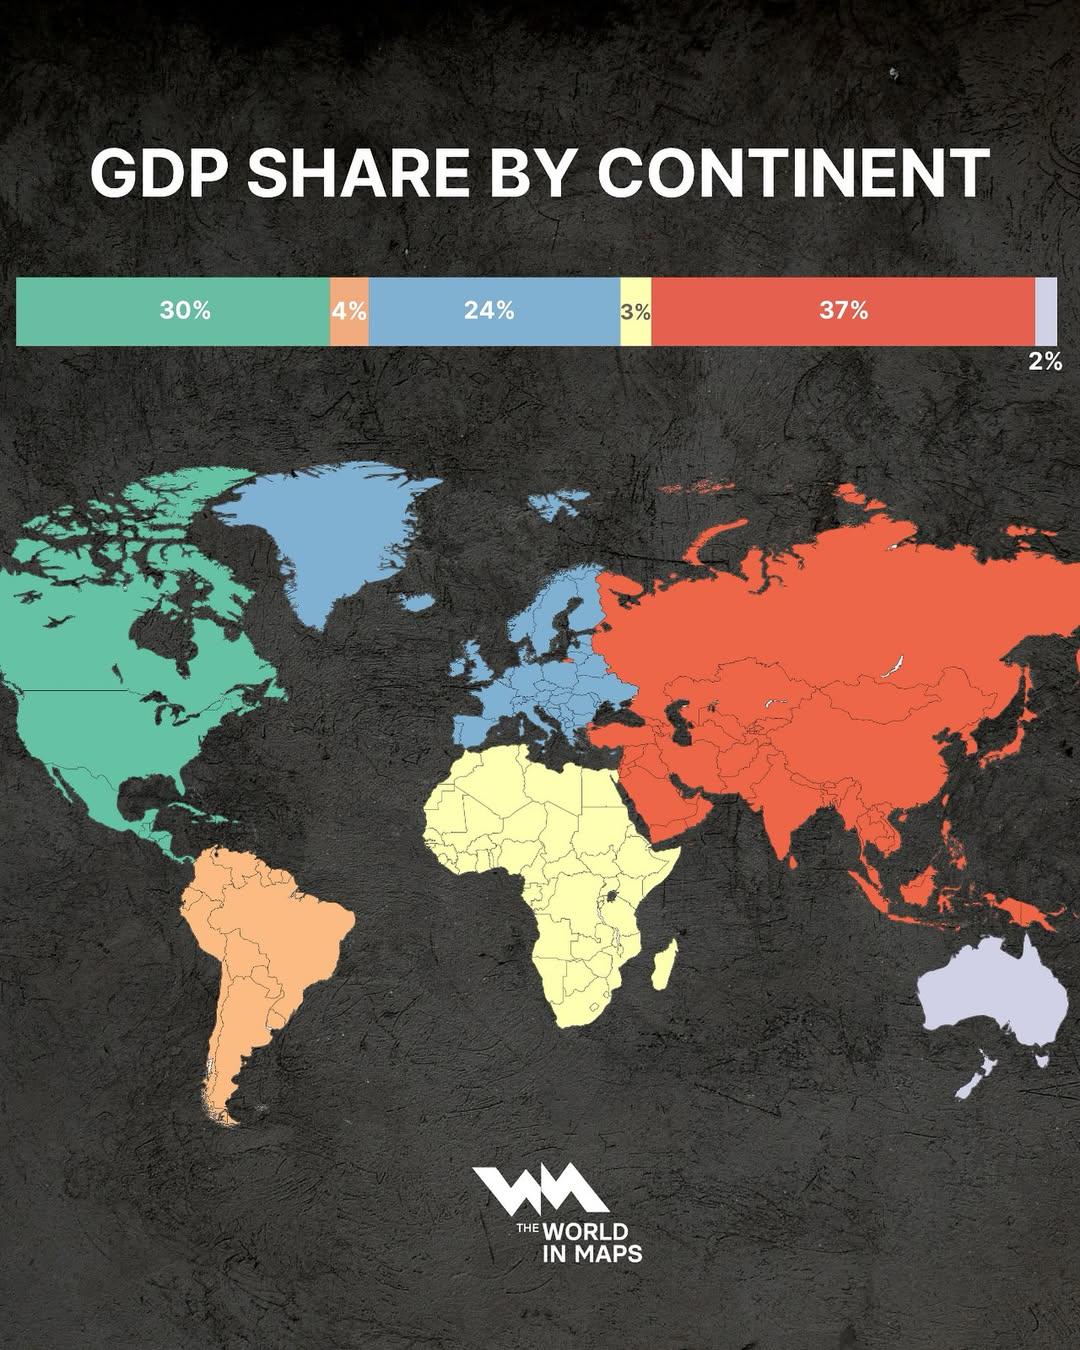
GDP Share by Continent Map
The "GDP Share by Continent Map" provides a clear visual representation of the economic output of different continents a...
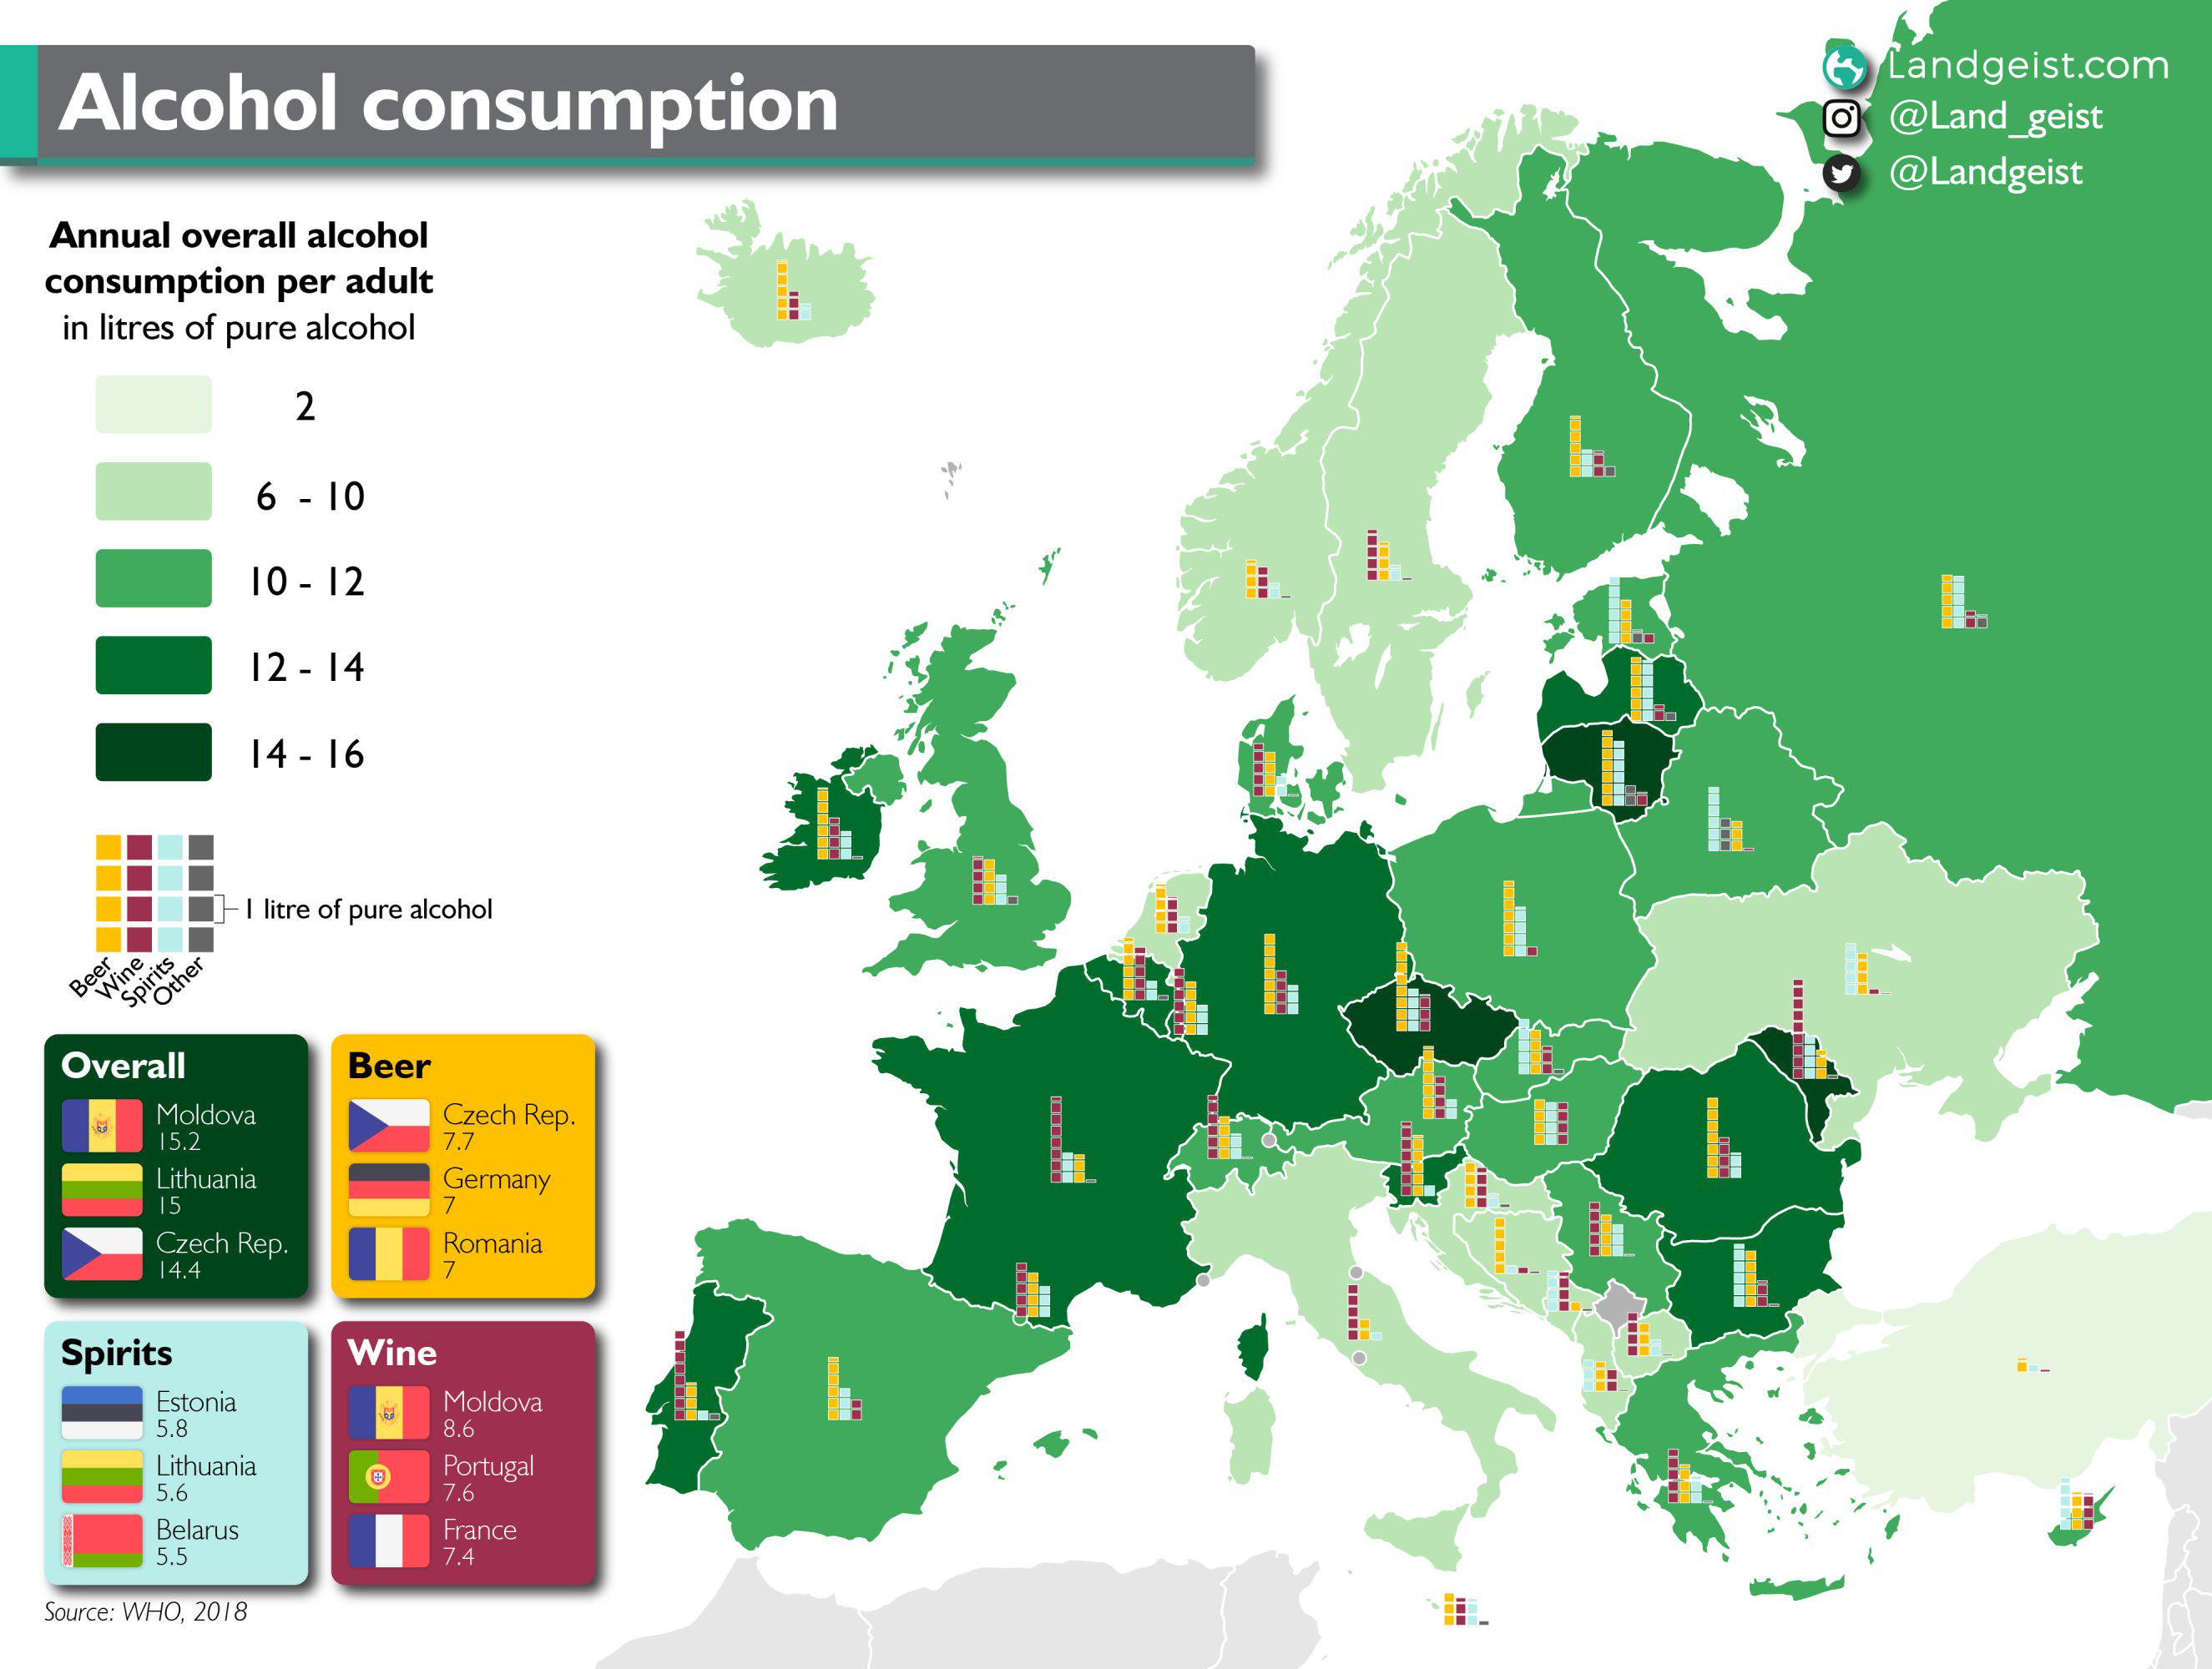
European Alcohol Consumption Map 2024
Interestingly, the cultural acceptance of alcohol in these regions plays a significant role in these statistics. In many...
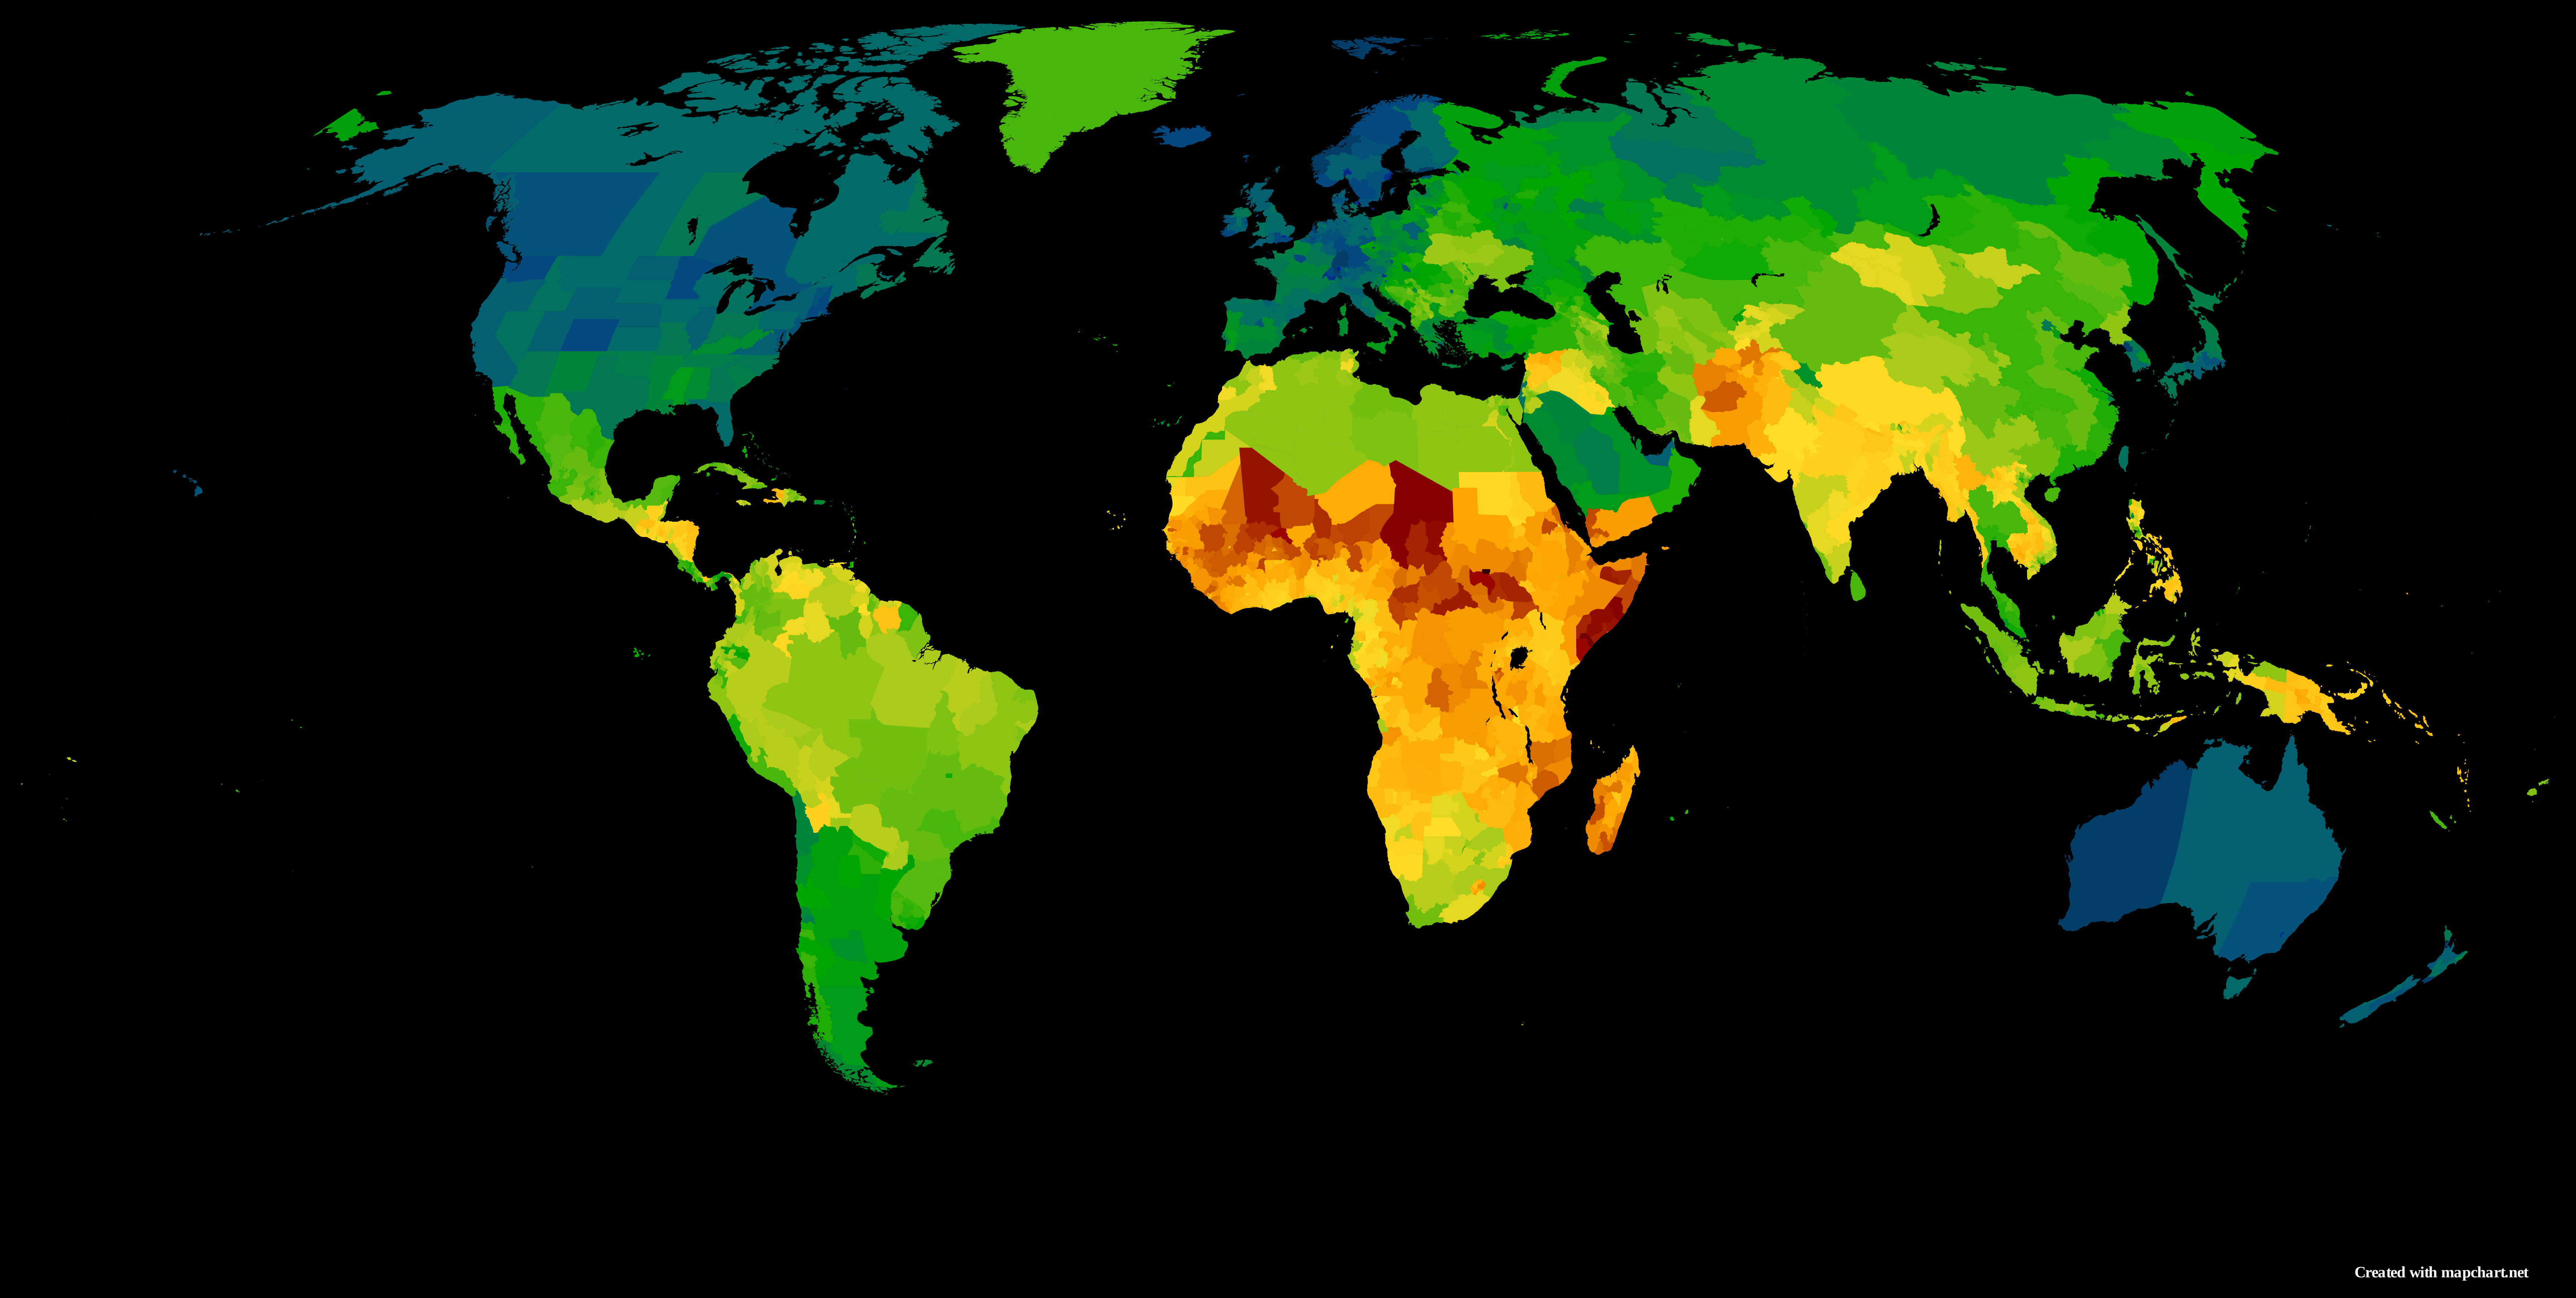
2022 Global Subnational Human Development Index Map
Interestingly, the HDI values can range from 0 to 1, with higher values indicating better overall development. Regions s...
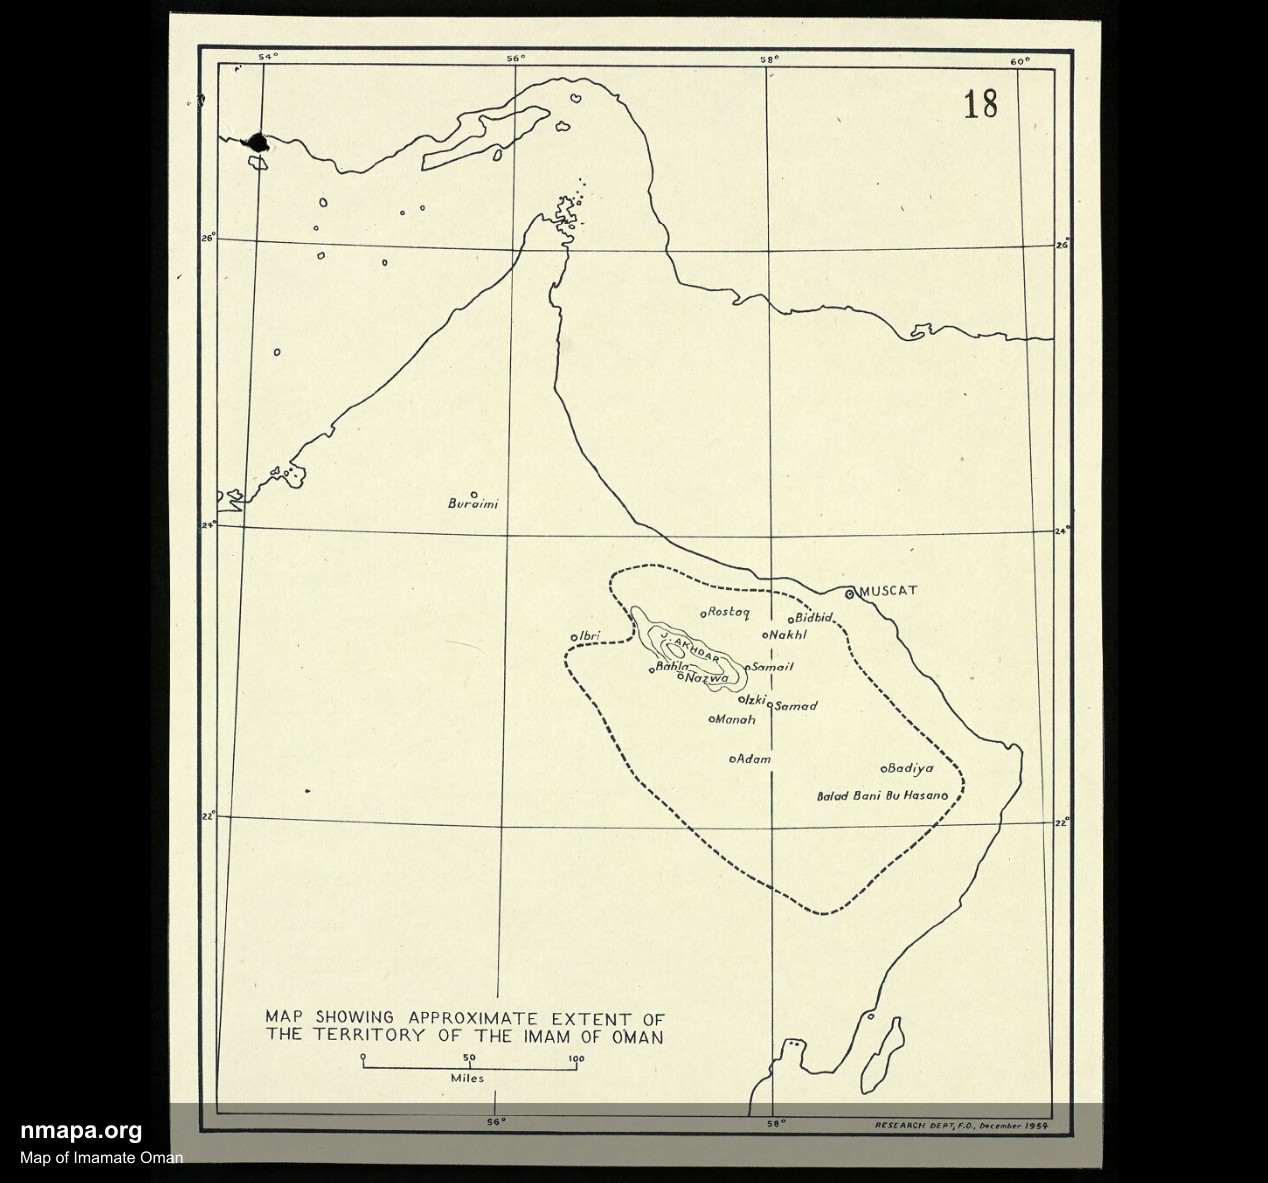
Map of Imamate Oman
This comprehensive geographical visualization presents "Map of Imamate Oman" in an accessible and informative format, of...
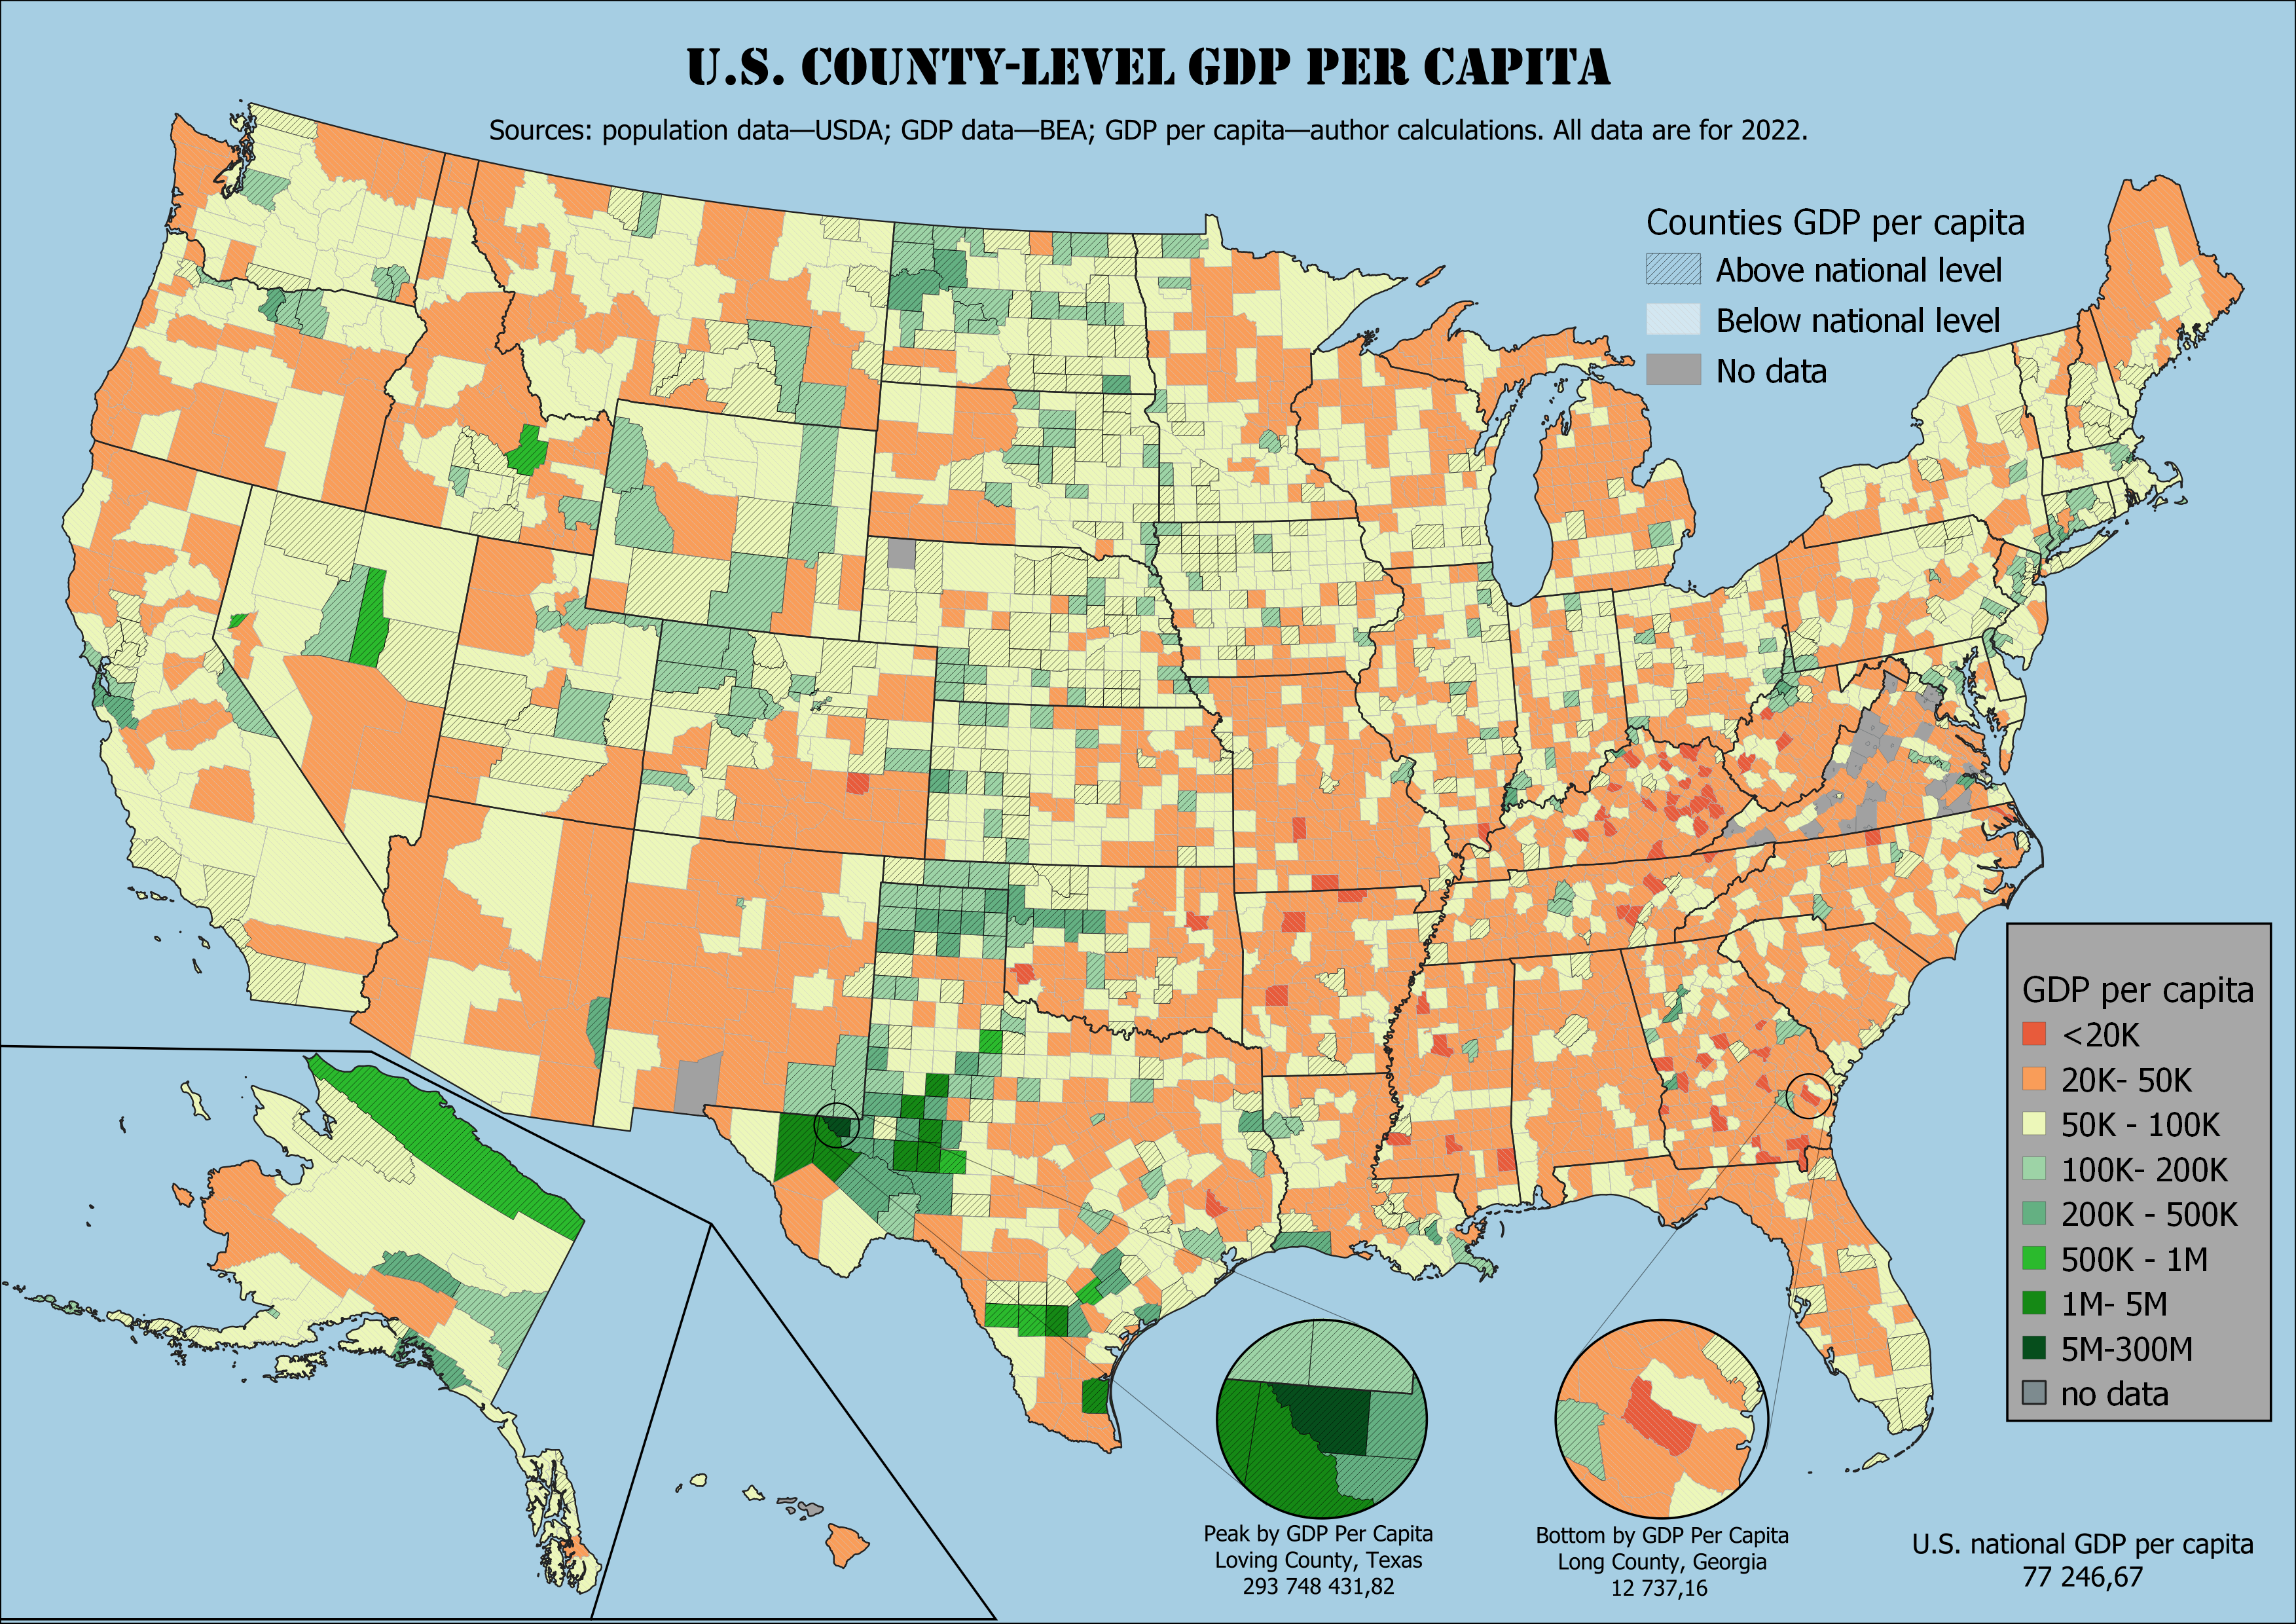
US County-Level GDP Per Capita Map 2022
The "US County-Level GDP Per Capita, 2022" map provides a detailed visualization of the economic performance across vari...
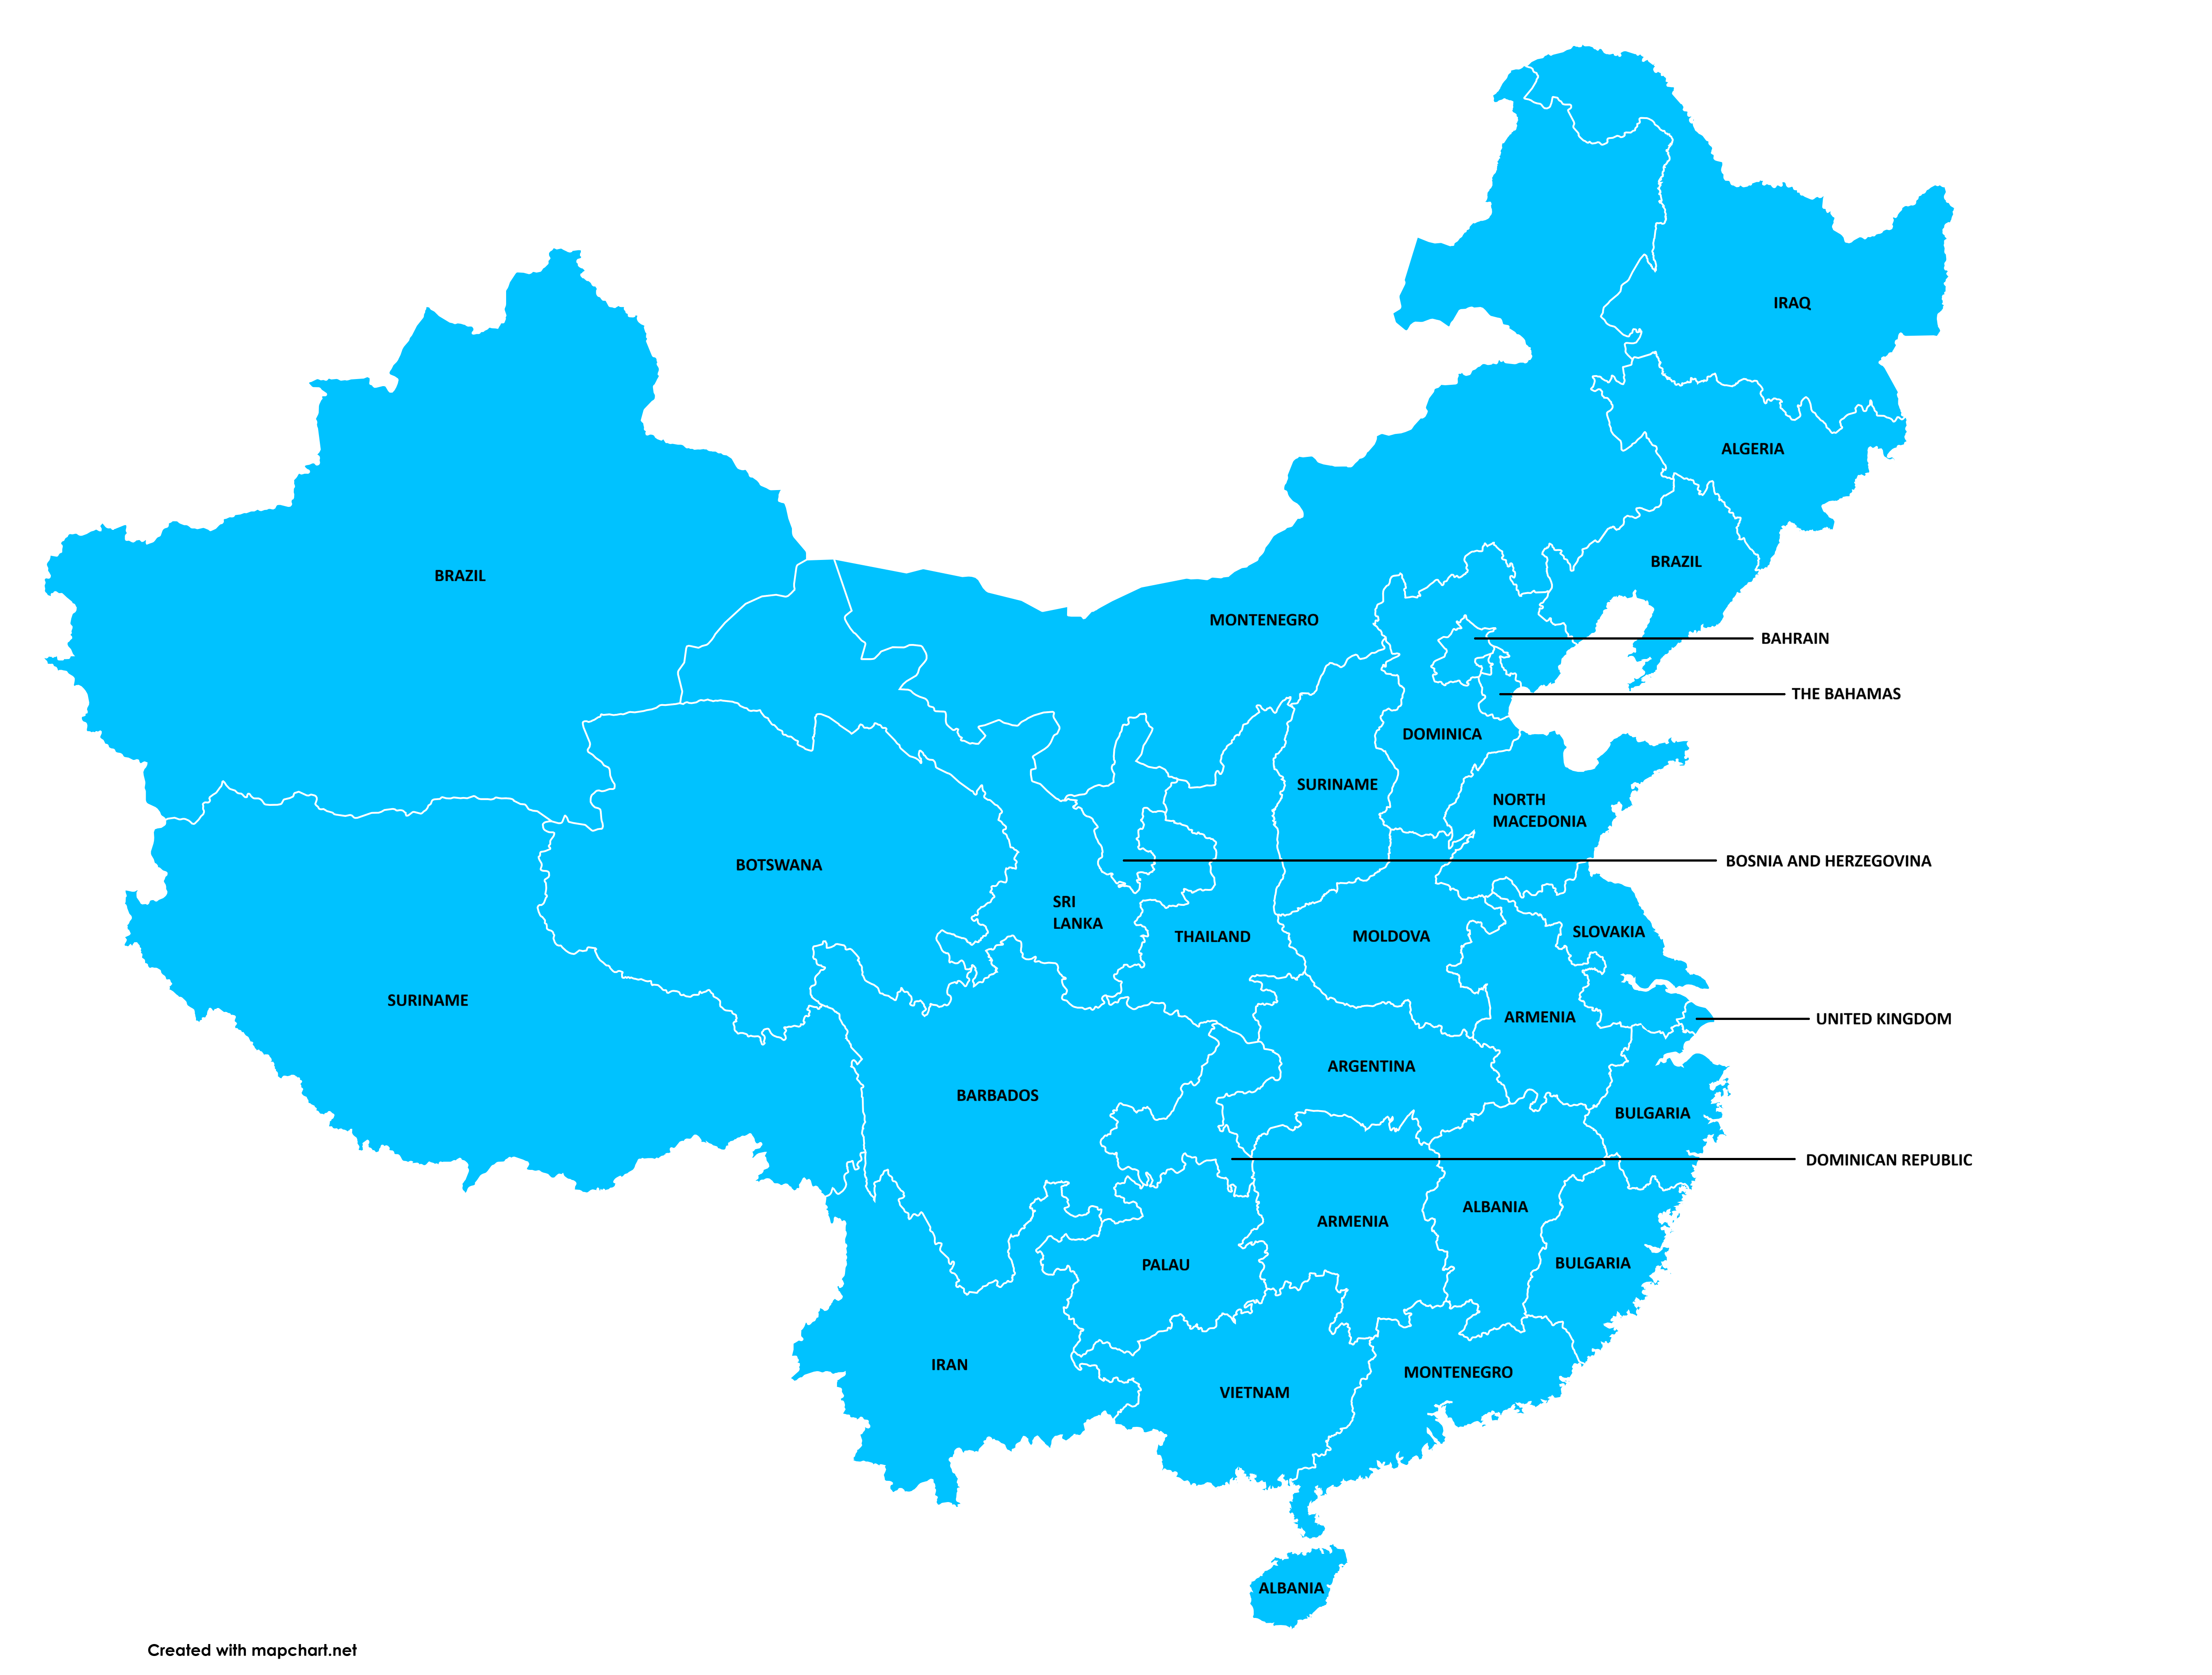
GDP Per Capita by Chinese Provinces Map
The visualization titled "Chinese Provinces Compared to Countries by GDP (PPP) Per Capita" provides a fascinating overvi...
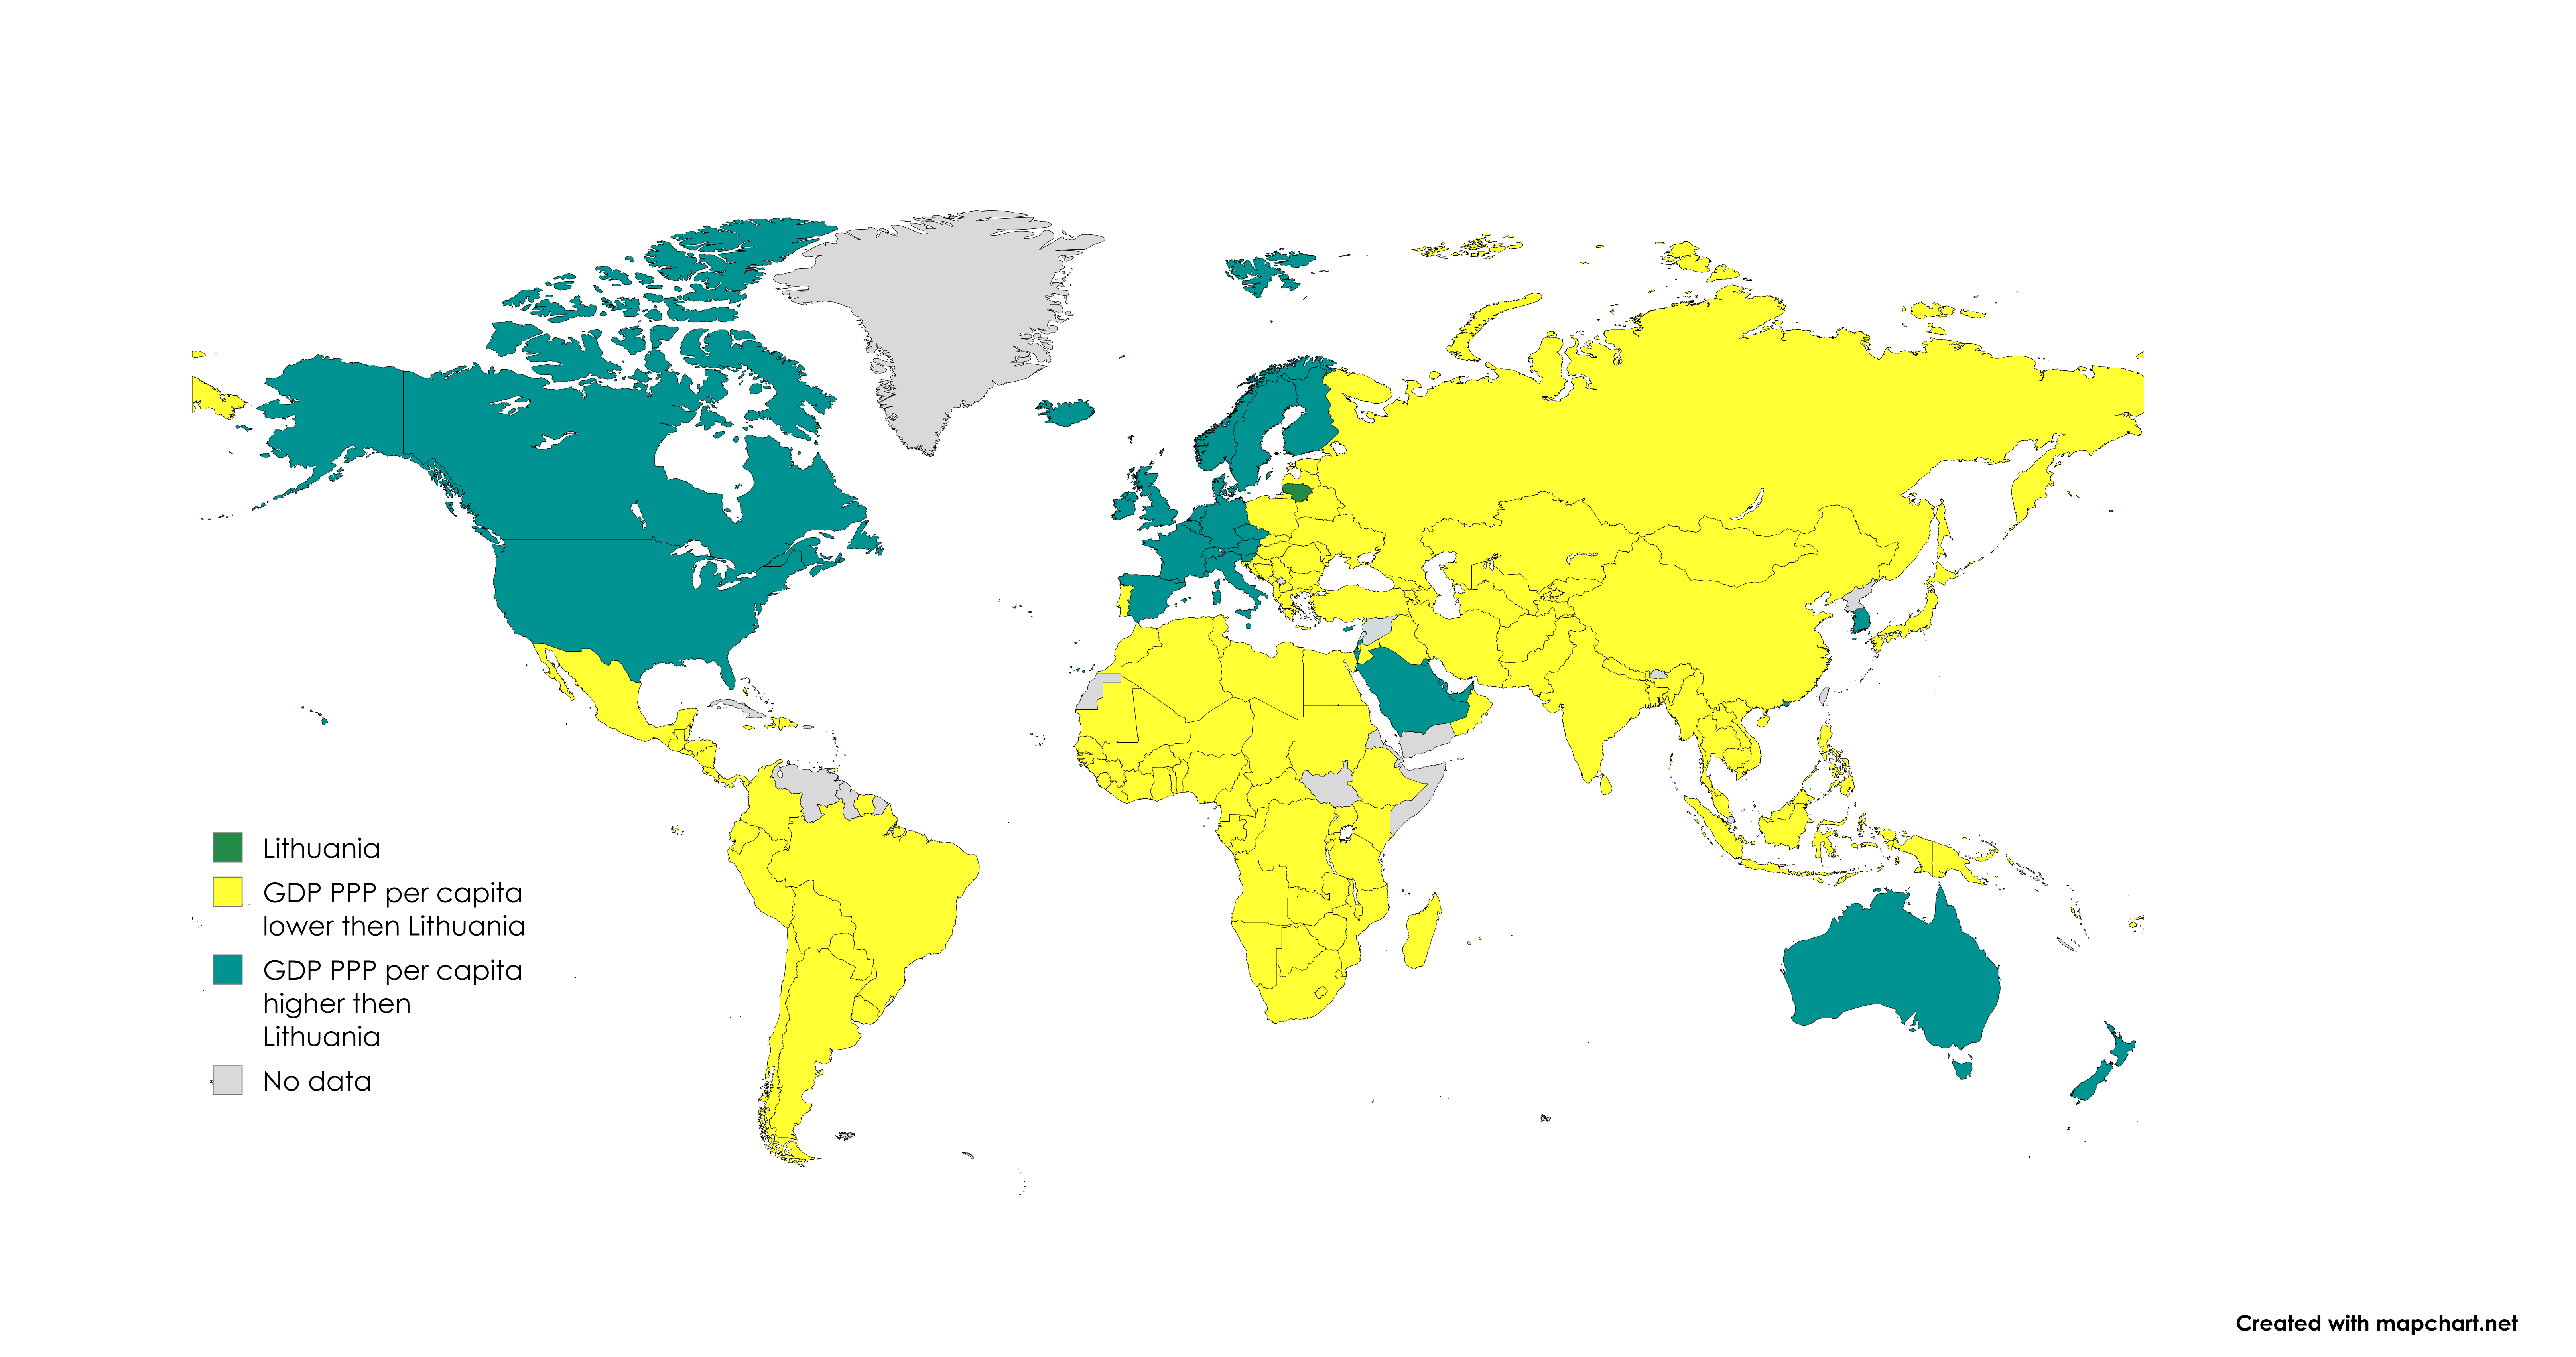
GDP (PPP) Per Capita Lithuania Map
The GDP (PPP) per capita Lithuania map provides a visual representation of the economic performance of Lithuania, expres...
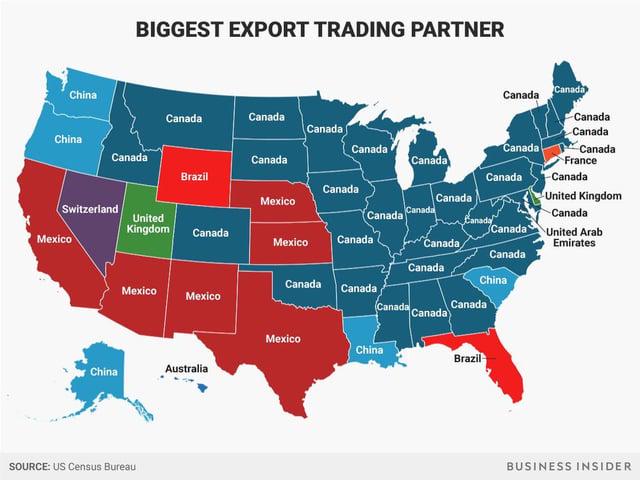
States Biggest Foreign Export Market Map
This map visualizes the biggest foreign export markets for each U.S. state, providing a clear picture of where American ...
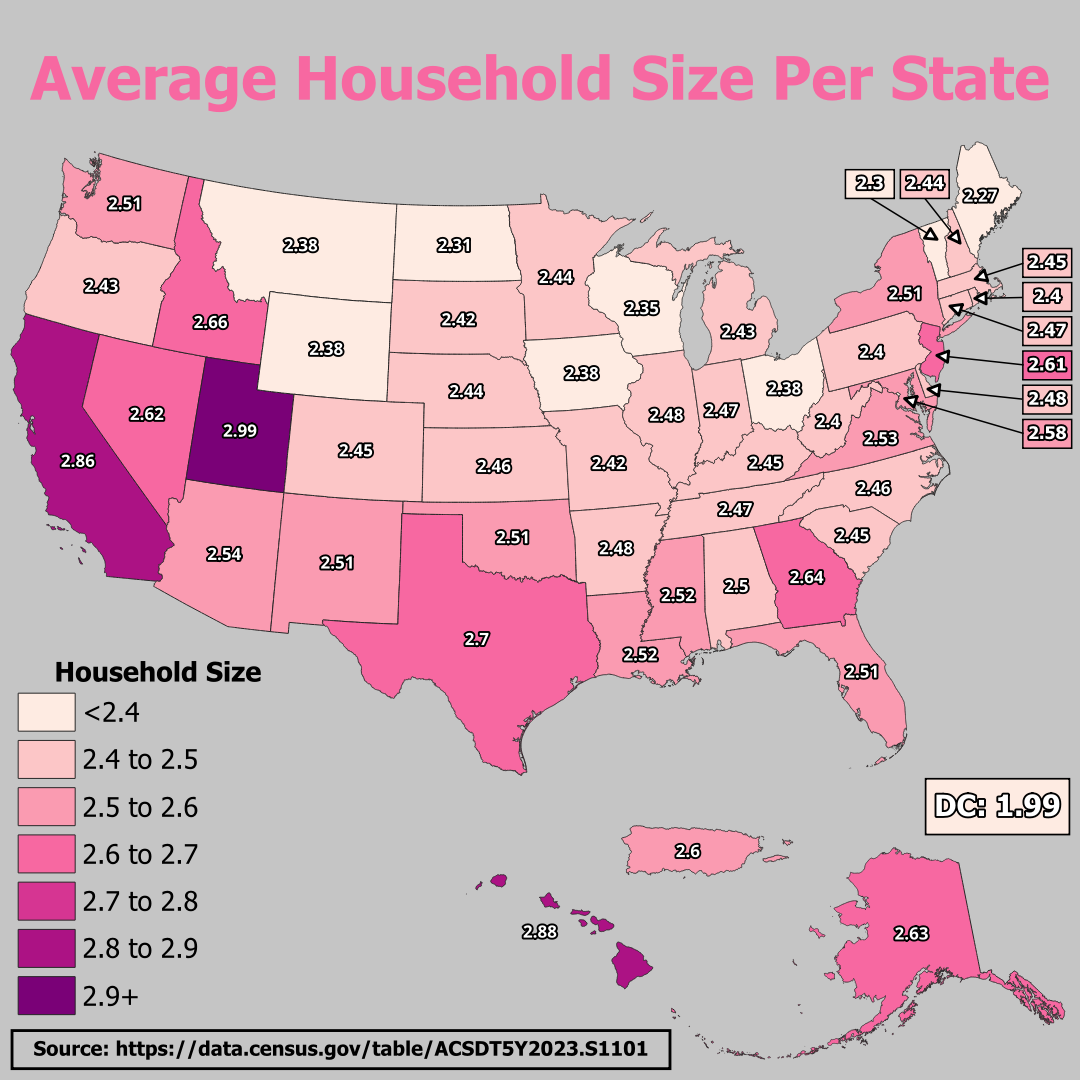
Average Household Size Per State Map
The "Average Household Size Per State" map provides a clear and comprehensive visualization of the varying household siz...
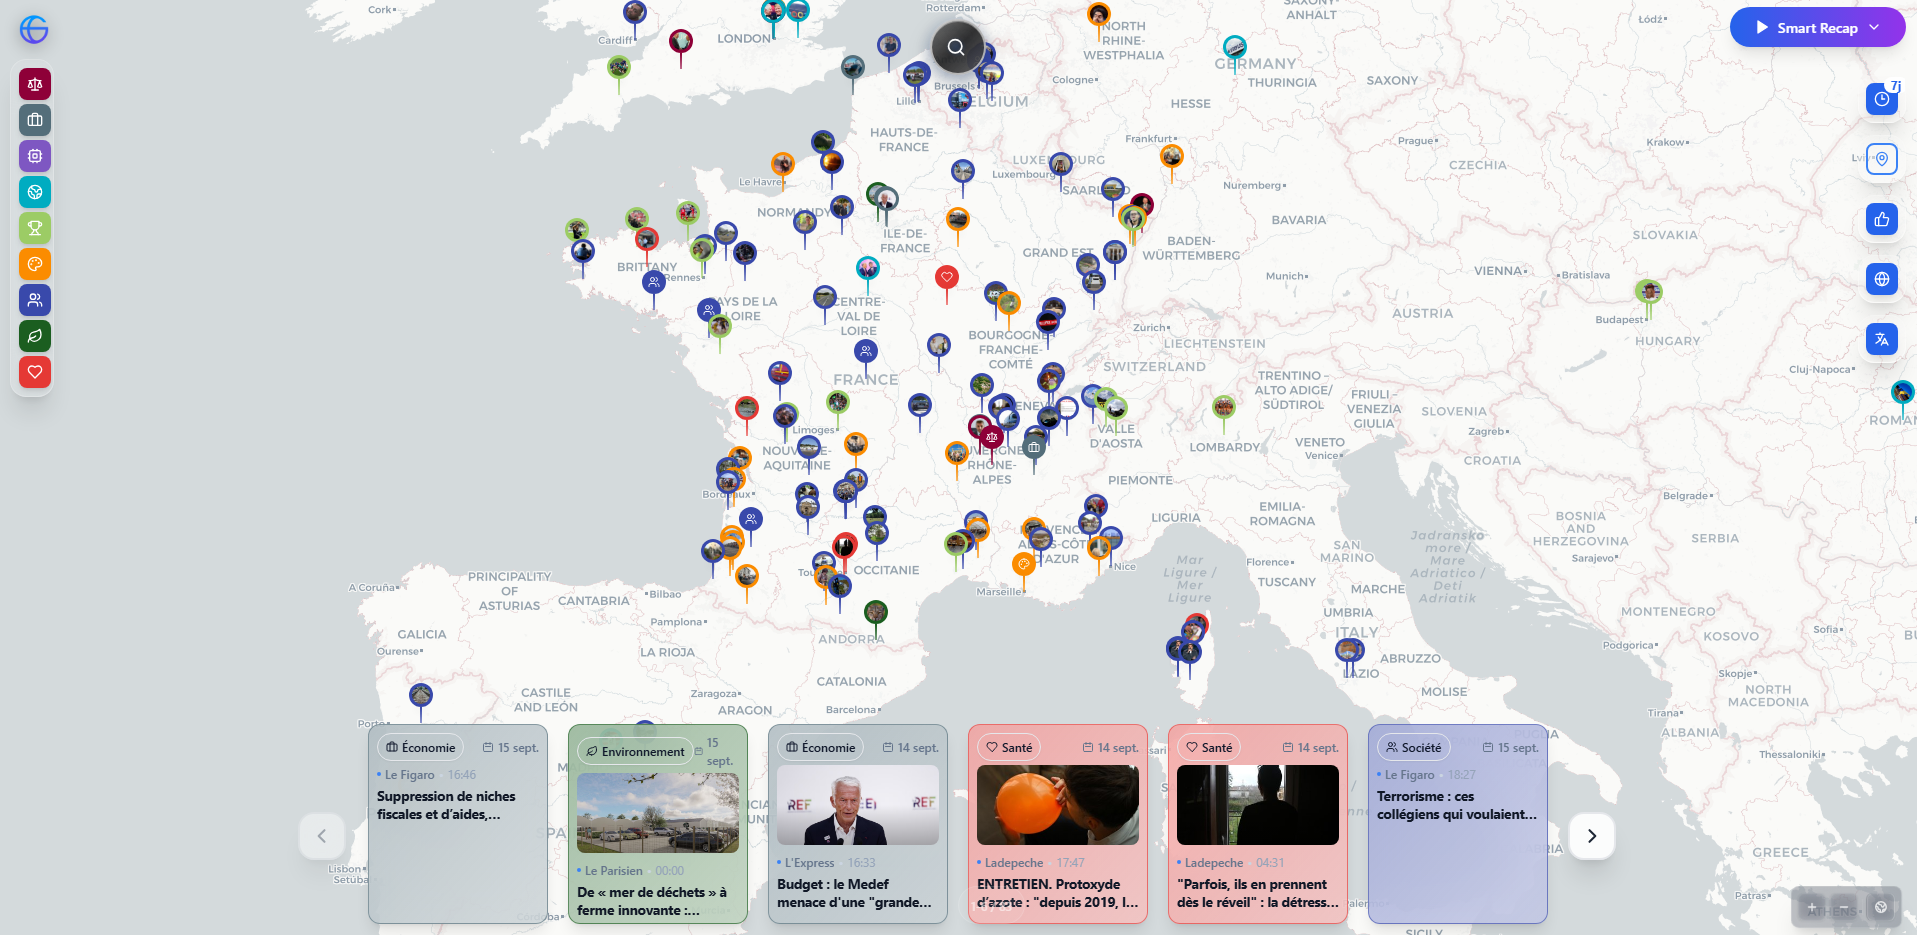
Global News Events Map by Region
An interesting phenomenon to consider is how geography influences the nature of news coverage. In urbanized areas, local...
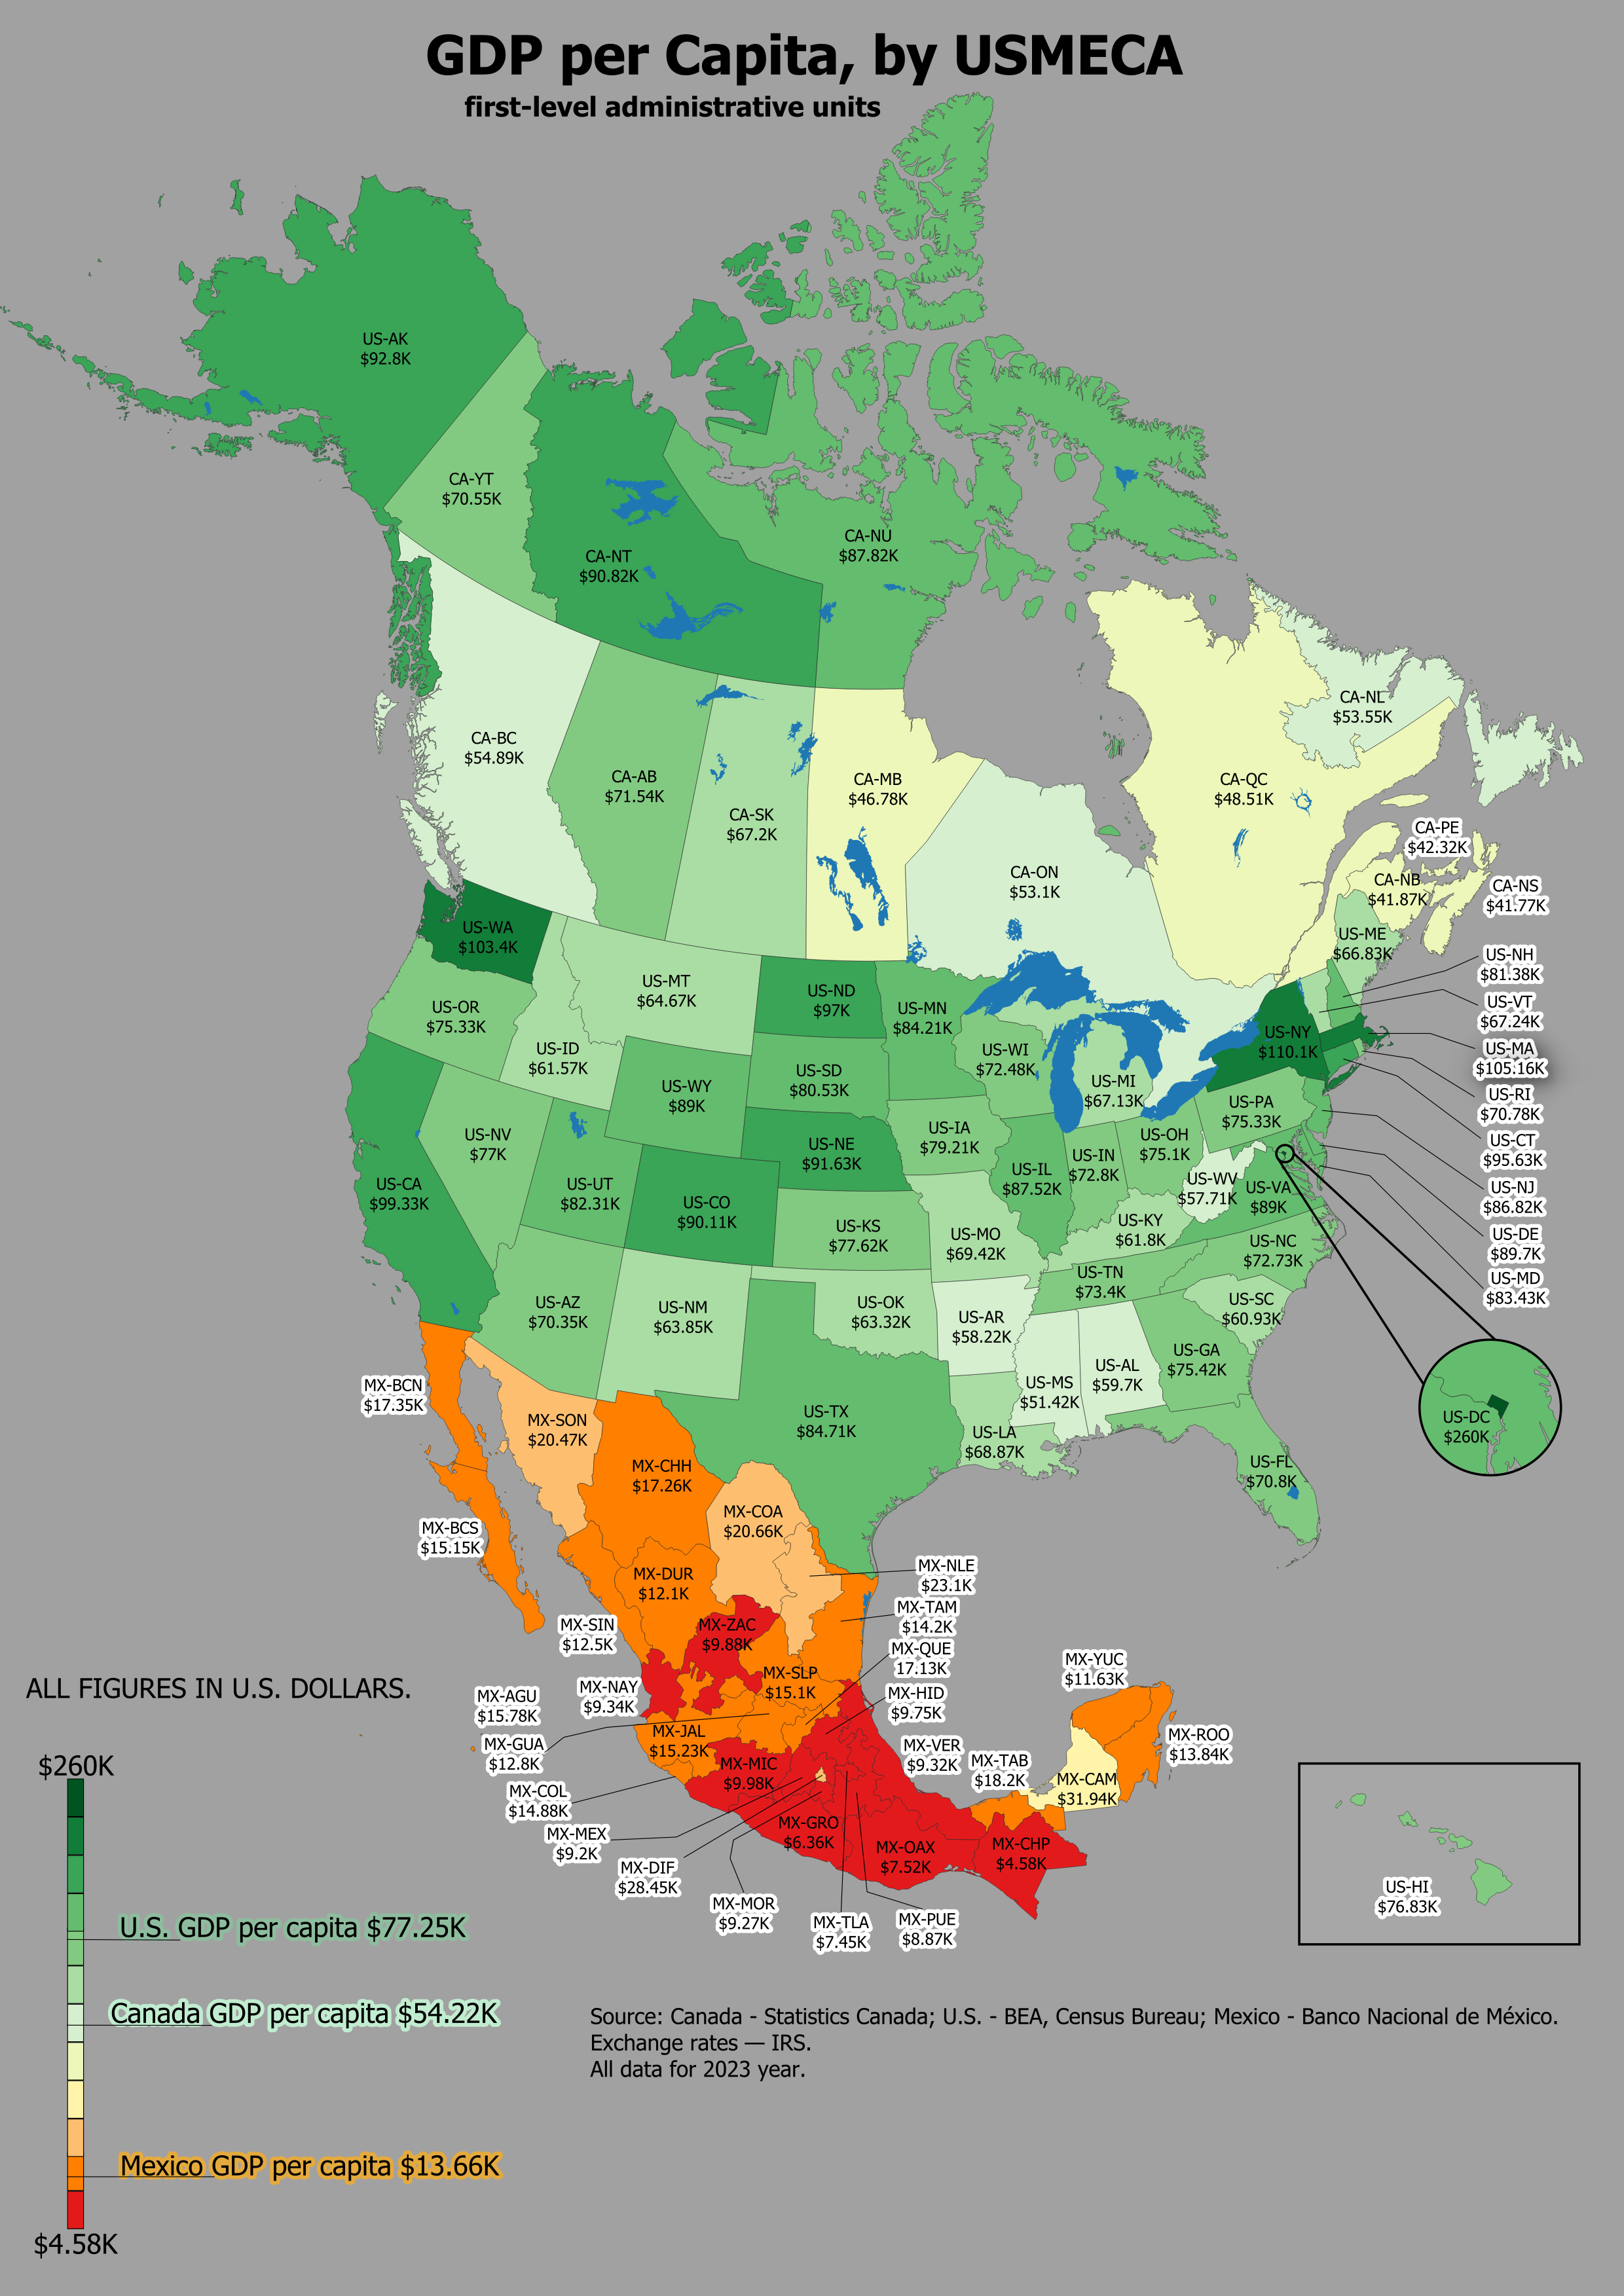
GDP Per Capita by USMECA Map
The visualization titled 'GDP per Capita, by USMECA first-level administrative units, 2023' highlights the economic perf...
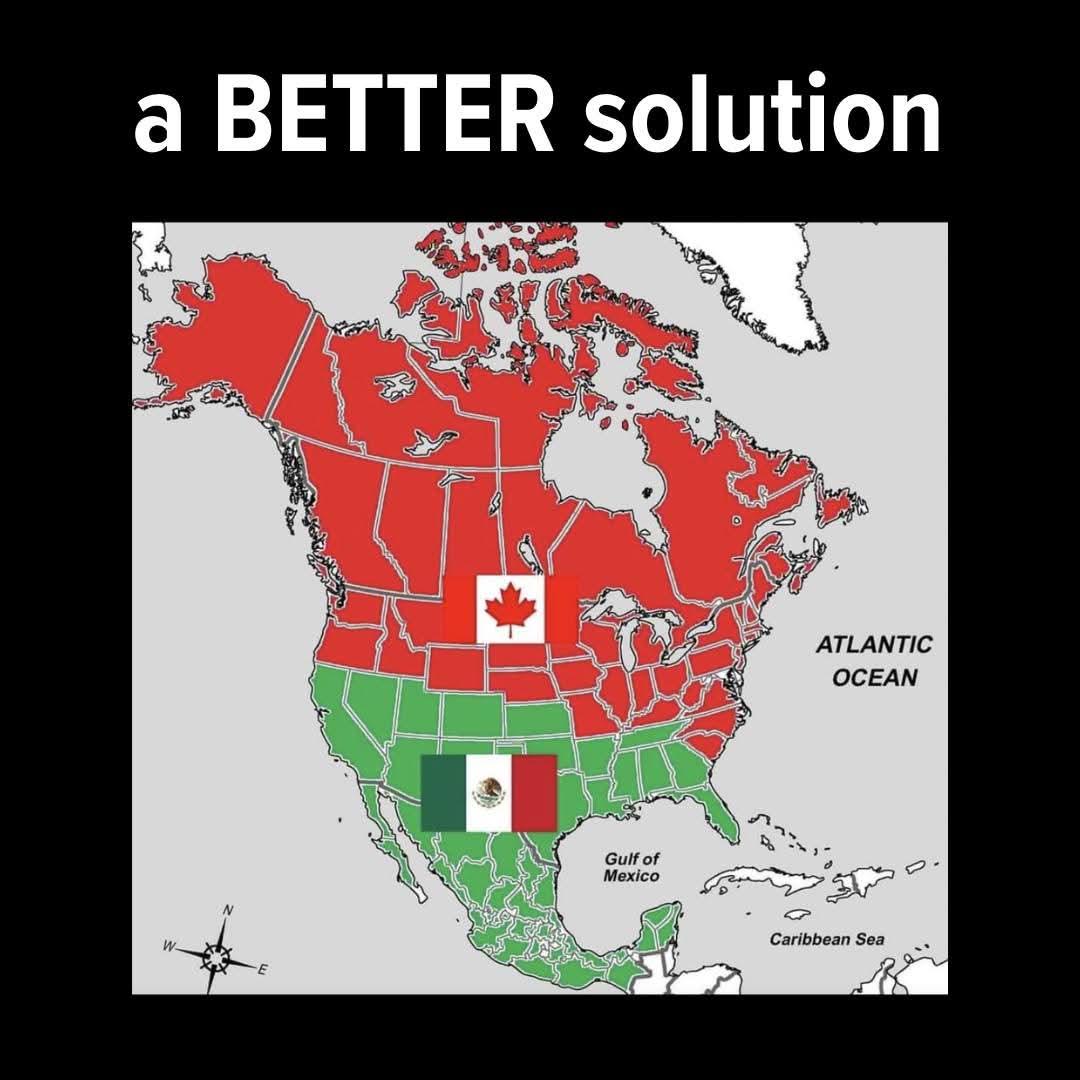
Quirky Alternative Maps of Geography
This visualization presents a collection of quirky and alternative maps that highlight unique perspectives on geographic...
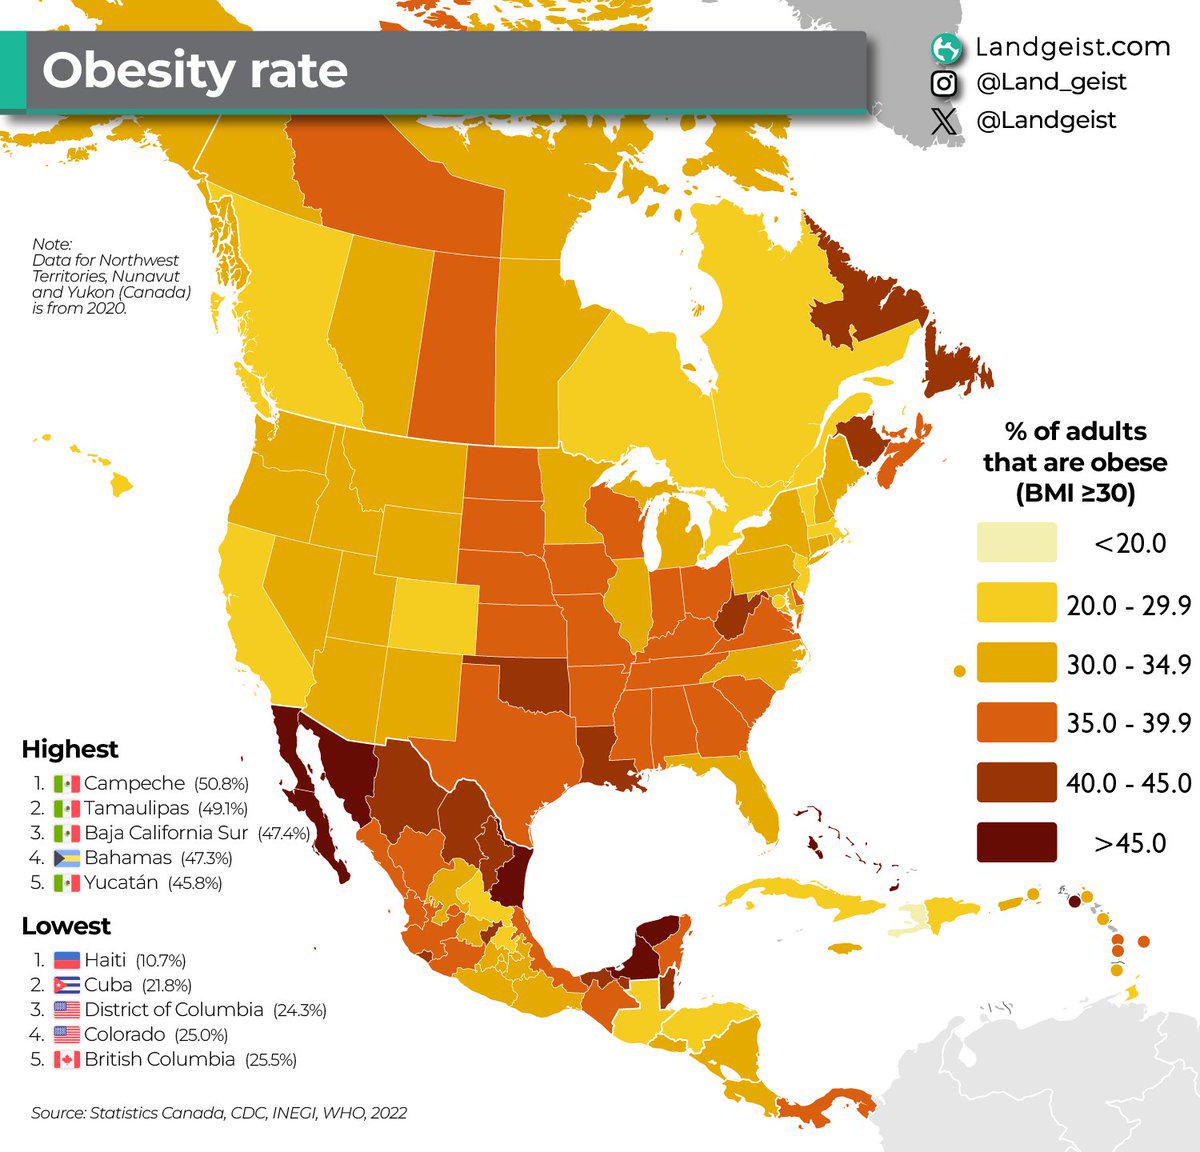
Obesity Rate Map in Northern & Central America
The "Obesity Rate in Northern & Central America [2022 data]" map provides a comprehensive visual representation of the o...
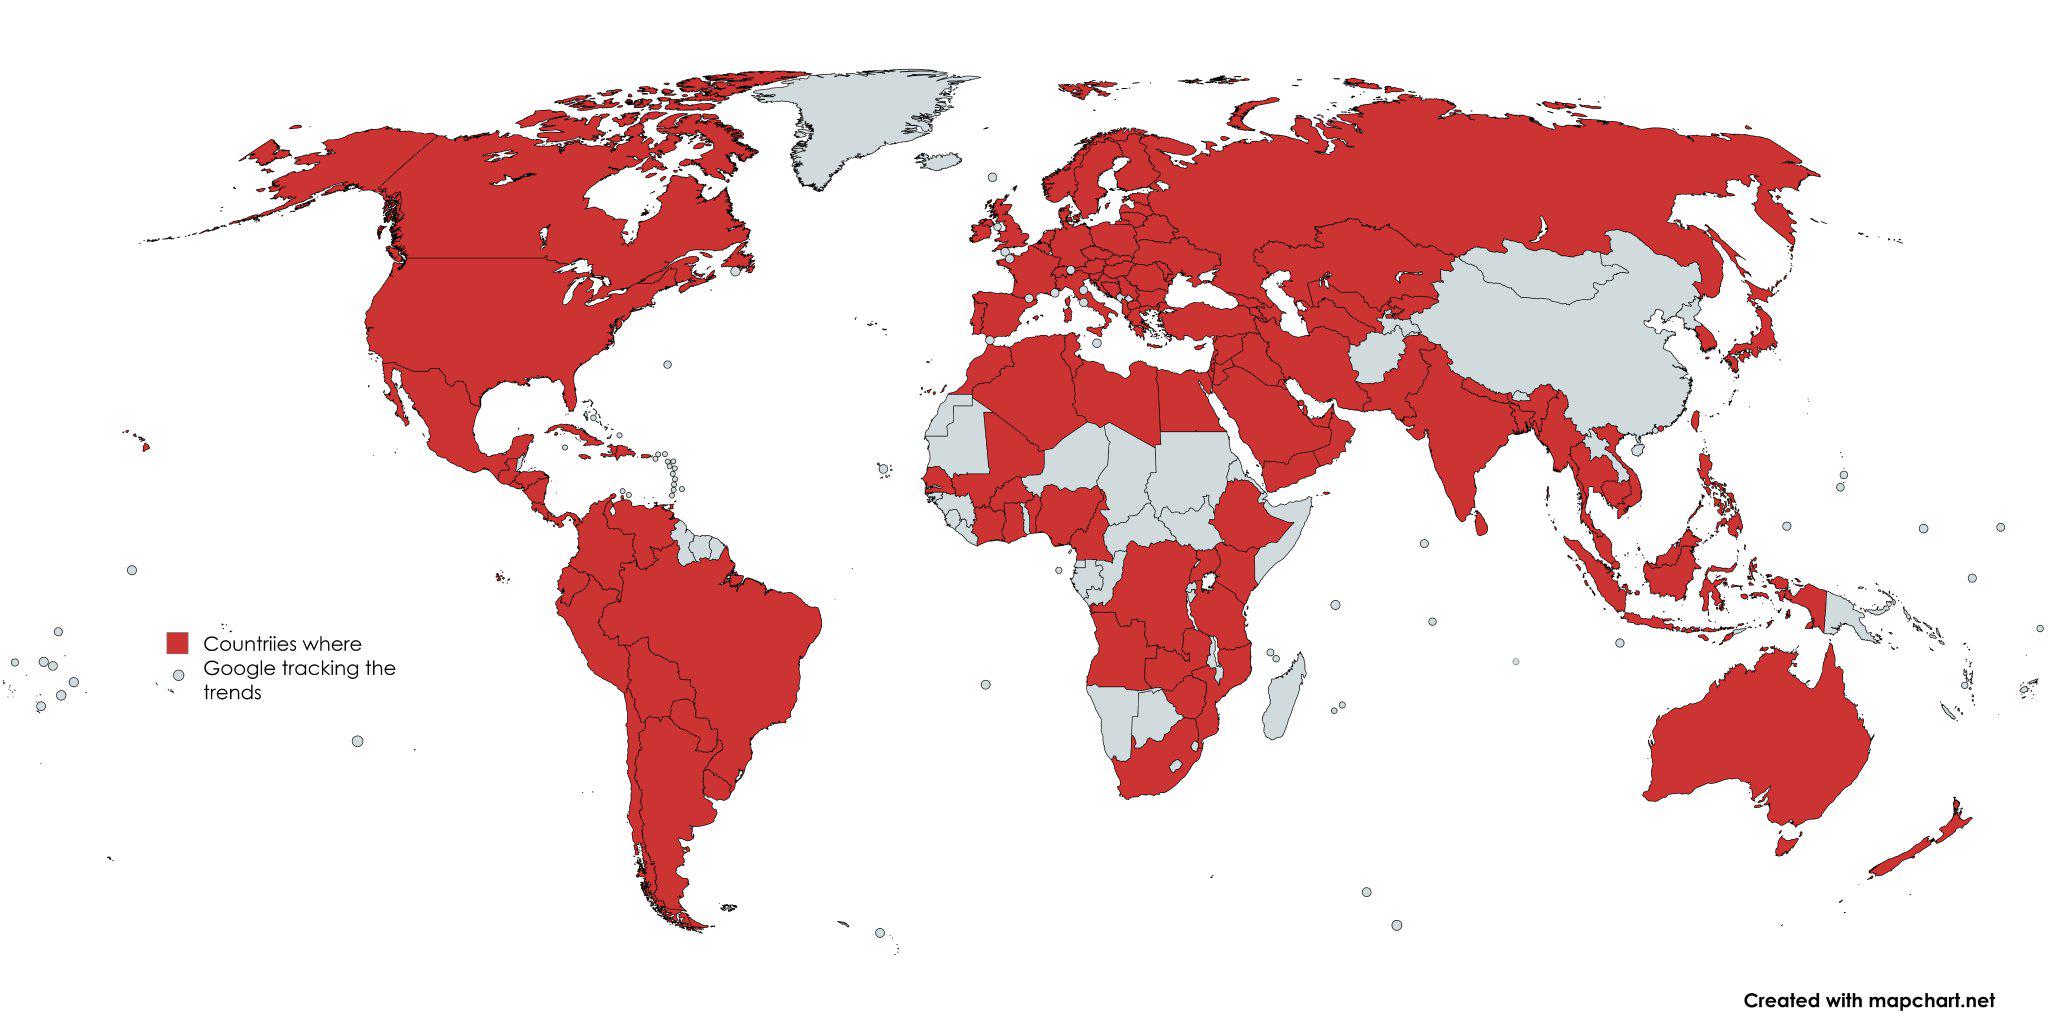
Google Trends Tracking by Country Map
Interestingly, Google Trends also highlights seasonal interests. In countries with distinct seasons, searches for winter...