Average Household Size Per State Map

David Chen
Data Visualization Specialist
David Chen is an expert in transforming complex geographic datasets into compelling visual narratives. He combines his background in computer science ...
Geographic Analysis
What This Map Shows
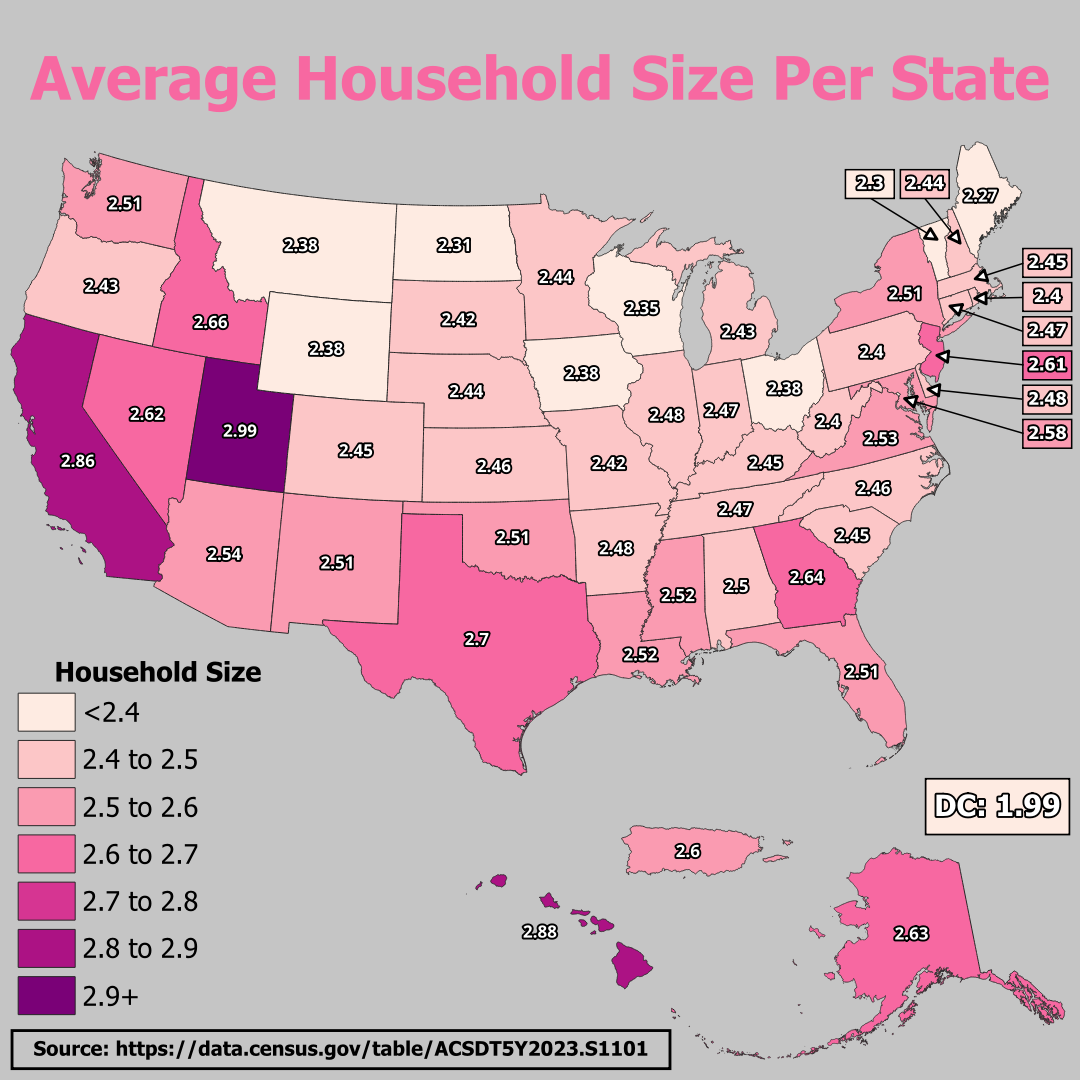
The "Average Household Size Per State" map provides a clear and comprehensive visualization of the varying household sizes across the United States. By breaking down average household sizes on a state-by-state basis, the map enables viewers to quickly grasp how demographic and cultural factors can influence living arrangements. Household size is a vital statistic that reflects not only population density but also social and economic trends within each state.
Deep Dive into Household Size
Household size is a crucial metric that offers insights into family dynamics, economic conditions, and social structures. The data reveals how many people typically reside in a single housing unit, encompassing families, roommates, and individuals living alone. In 2020, the U.S. Census Bureau reported that the average household size was about 2.52 people per household. However, this figure masks significant variations across different states, influenced by factors such as urbanization, cultural norms, and economic conditions.
Interestingly, states with larger average household sizes often have deeper family ties or cultural traditions that favor multi-generational living. For instance, states like Utah and Idaho show higher household sizes, with averages around 3.0 and 2.9 respectively. This can be attributed to cultural values that prioritize family and community cohesion. Conversely, states like New York and California, with average household sizes closer to 2.5 or even lower, often reflect urban lifestyles where smaller living spaces are more common, and individualism prevails.
Have you ever wondered why some regions have more significant numbers of single-person households? In metropolitan areas, particularly on the East and West Coasts, economic factors and housing availability lead to higher numbers of individuals living alone. The rising housing costs in cities like San Francisco and New York City often compel younger adults to share apartments with roommates, impacting the average household size.
Additionally, economic conditions play a pivotal role in shaping household sizes. States with robust job markets, such as Texas and Florida, tend to attract young professionals who may live alone or in smaller groups, resulting in lower average household sizes. In contrast, states with struggling economies may see larger households as families unite for economic support.
Regional Analysis
When examining the map, it's evident that regional differences in household size are pronounced. The Western U.S., particularly states like Utah and Montana, shows a trend toward larger households, likely due to cultural norms that emphasize family living. Meanwhile, the Northeast exhibits smaller average household sizes, with states like Massachusetts and New Jersey showing averages closer to 2.4.
In the South, states like Alabama and Tennessee often report household sizes around 2.6, reflecting a blend of urban and rural living environments. The Midwest presents a mixed bag; for instance, Nebraska shows an average household size of 2.7, which may reflect its agricultural roots and family-oriented culture, while Illinois, especially in urban centers, sinks closer to 2.5.
Interestingly, Hawaii presents a unique case with an average household size of about 3.0. This anomaly can be attributed to the high cost of living, encouraging extended families to cohabit in larger households to share expenses.
Significance and Impact
Understanding average household sizes is critical for various reasons. From a policymaking perspective, it helps in urban planning and resource allocation. For instance, areas with larger households may require more schools, parks, and community resources, while urban areas with smaller households may focus more on public transportation and housing development.
Moreover, trends in household sizes can signal broader societal changes. As more individuals choose to live alone or in smaller groups, we may see shifts in consumer behavior, housing markets, and even social services. For example, the rise of single-person households can increase demand for smaller living spaces, leading to innovative housing solutions like micro-apartments.
Looking forward, experts predict that household sizes may continue to decrease due to factors such as rising housing costs, changing gender roles, and the growing acceptance of diverse family structures. As we navigate these changes, understanding the dynamics of household size becomes increasingly important for predicting social trends and shaping future communities.
Visualization Details
- Published
- August 16, 2025
- Views
- 108
Comments
Loading comments...