GDP Share by Continent Map

Marcus Rodriguez
Historical Geography Expert
Marcus Rodriguez specializes in historical cartography and geographic data analysis. With a background in both history and geography, he brings unique...
Geographic Analysis
What This Map Shows
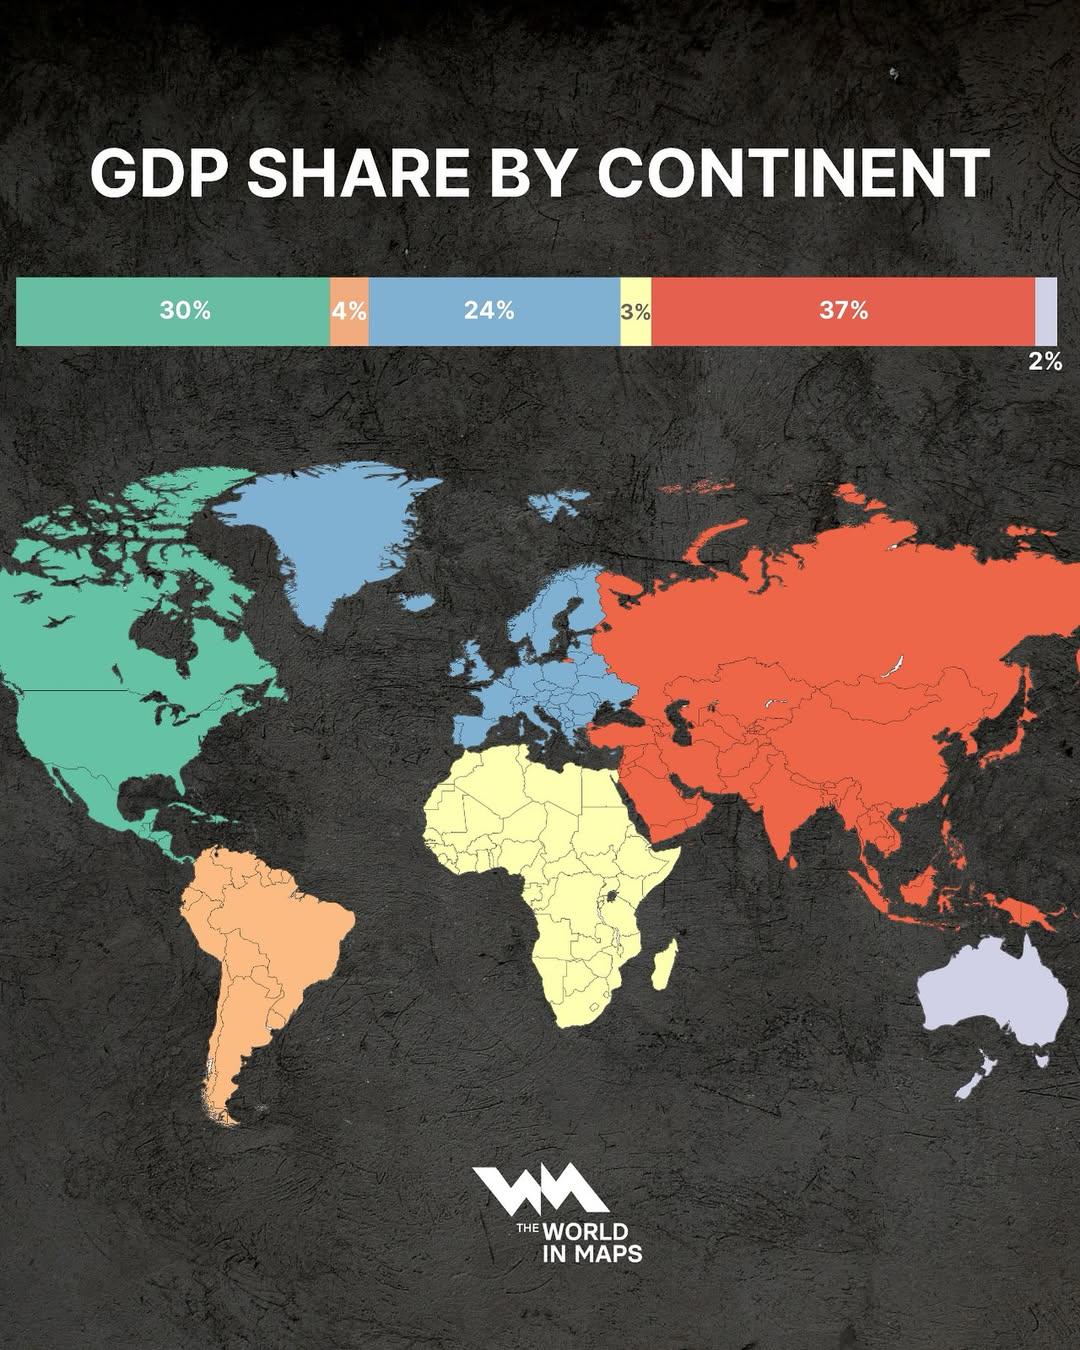
The "GDP Share by Continent Map" provides a clear visual representation of the economic output of different continents around the world. The map highlights the percentage contribution of each continent to the global Gross Domestic Product (GDP), offering insights into the economic power dynamics that shape our world today. This visualization is essential for understanding how wealth is distributed across the globe and the economic significance of each continent.
Deep Dive into Global GDP
Gross Domestic Product (GDP) is a crucial indicator of economic health, representing the total value of all goods and services produced over a specific time period within a nation or continent. It serves as a barometer for economic performance, influences policy decisions, and affects international relations. Interestingly, GDP can also reflect the socio-economic development levels of countries and regions.
As of recent data, global GDP is approximately 94 trillion USD, with significant contributions from various continents. North America, for instance, holds a substantial share of the global GDP, largely driven by the United States, which alone accounts for around 24% of the world’s total GDP. This makes North America a powerhouse in the global economy, showcasing its diverse industries from technology and finance to agriculture and manufacturing.
In contrast, Asia, the most populous continent, contributes a staggering amount to global GDP as well, estimated at about 34%. This figure is remarkable, especially considering the rapid economic growth seen in countries like China and India. China has emerged as the second-largest economy in the world, with significant advancements in manufacturing, technology, and services, which dramatically boosts the continent's overall GDP.
Africa, while rich in natural resources and potential, represents a smaller fraction of global GDP, around 3-4%. This disparity opens up discussions about the challenges and opportunities within the continent, such as the need for infrastructure development, investment, and sustainable practices to enhance economic growth.
What’s fascinating is the role of Europe in this economic landscape. The European Union, a collective market of 27 countries, contributes approximately 22% to the global GDP. The diverse economies within the EU—from Germany’s manufacturing strength to France’s luxury goods—illustrate a complex tapestry of economic interdependence and cooperation.
Regional Analysis
When examining the map, it’s essential to break down the contributions of each continent. For example, when we look at Asia, we see not only the significant contributions from China and India but also the economic powerhouses of Japan and South Korea. Together, these nations create a robust economic framework that influences global markets.
In Europe, the economic strength varies widely. Countries like Germany and the United Kingdom lead in GDP contributions, while smaller nations like Greece and Portugal contribute less but play critical roles in regional stability and trade.
North America, predominantly influenced by the United States and Canada, showcases a strong technology sector, which is a primary driver of its GDP. In contrast, Latin America, which includes countries like Brazil and Argentina, has a diverse economic landscape but still lags behind in overall GDP share compared to its North American counterpart.
Interestingly, Oceania, while having a smaller share of the global GDP, includes Australia, which has a high GDP per capita. This highlights the economic potential of smaller nations that can achieve significant wealth with fewer resources.
Significance and Impact
Understanding GDP share by continent is crucial for policymakers, investors, and economists. It not only informs economic strategies but also sheds light on developmental priorities. For instance, regions with lower GDP contributions may require targeted investments to stimulate growth and improve living standards.
As we look towards the future, current trends suggest that emerging markets in Africa and Asia could see substantial GDP growth, driven by technological advancements, urbanization, and a burgeoning middle class. This shift could lead to a more balanced global economic landscape, where developing nations play a more prominent role.
Moreover, the implications of GDP distribution extend beyond economics. They influence geopolitical dynamics and international relations, impacting trade agreements, alliances, and even conflicts. As global challenges such as climate change and economic inequality become more pressing, understanding the economic contributions of each continent will be vital in crafting collaborative approaches to these issues.
In conclusion, the "GDP Share by Continent Map" not only provides a snapshot of economic contributions but also invites deeper reflection on the interconnectedness of our global economy and the shared challenges we face in building a sustainable future.
Visualization Details
- Published
- August 19, 2025
- Views
- 72
Comments
Loading comments...