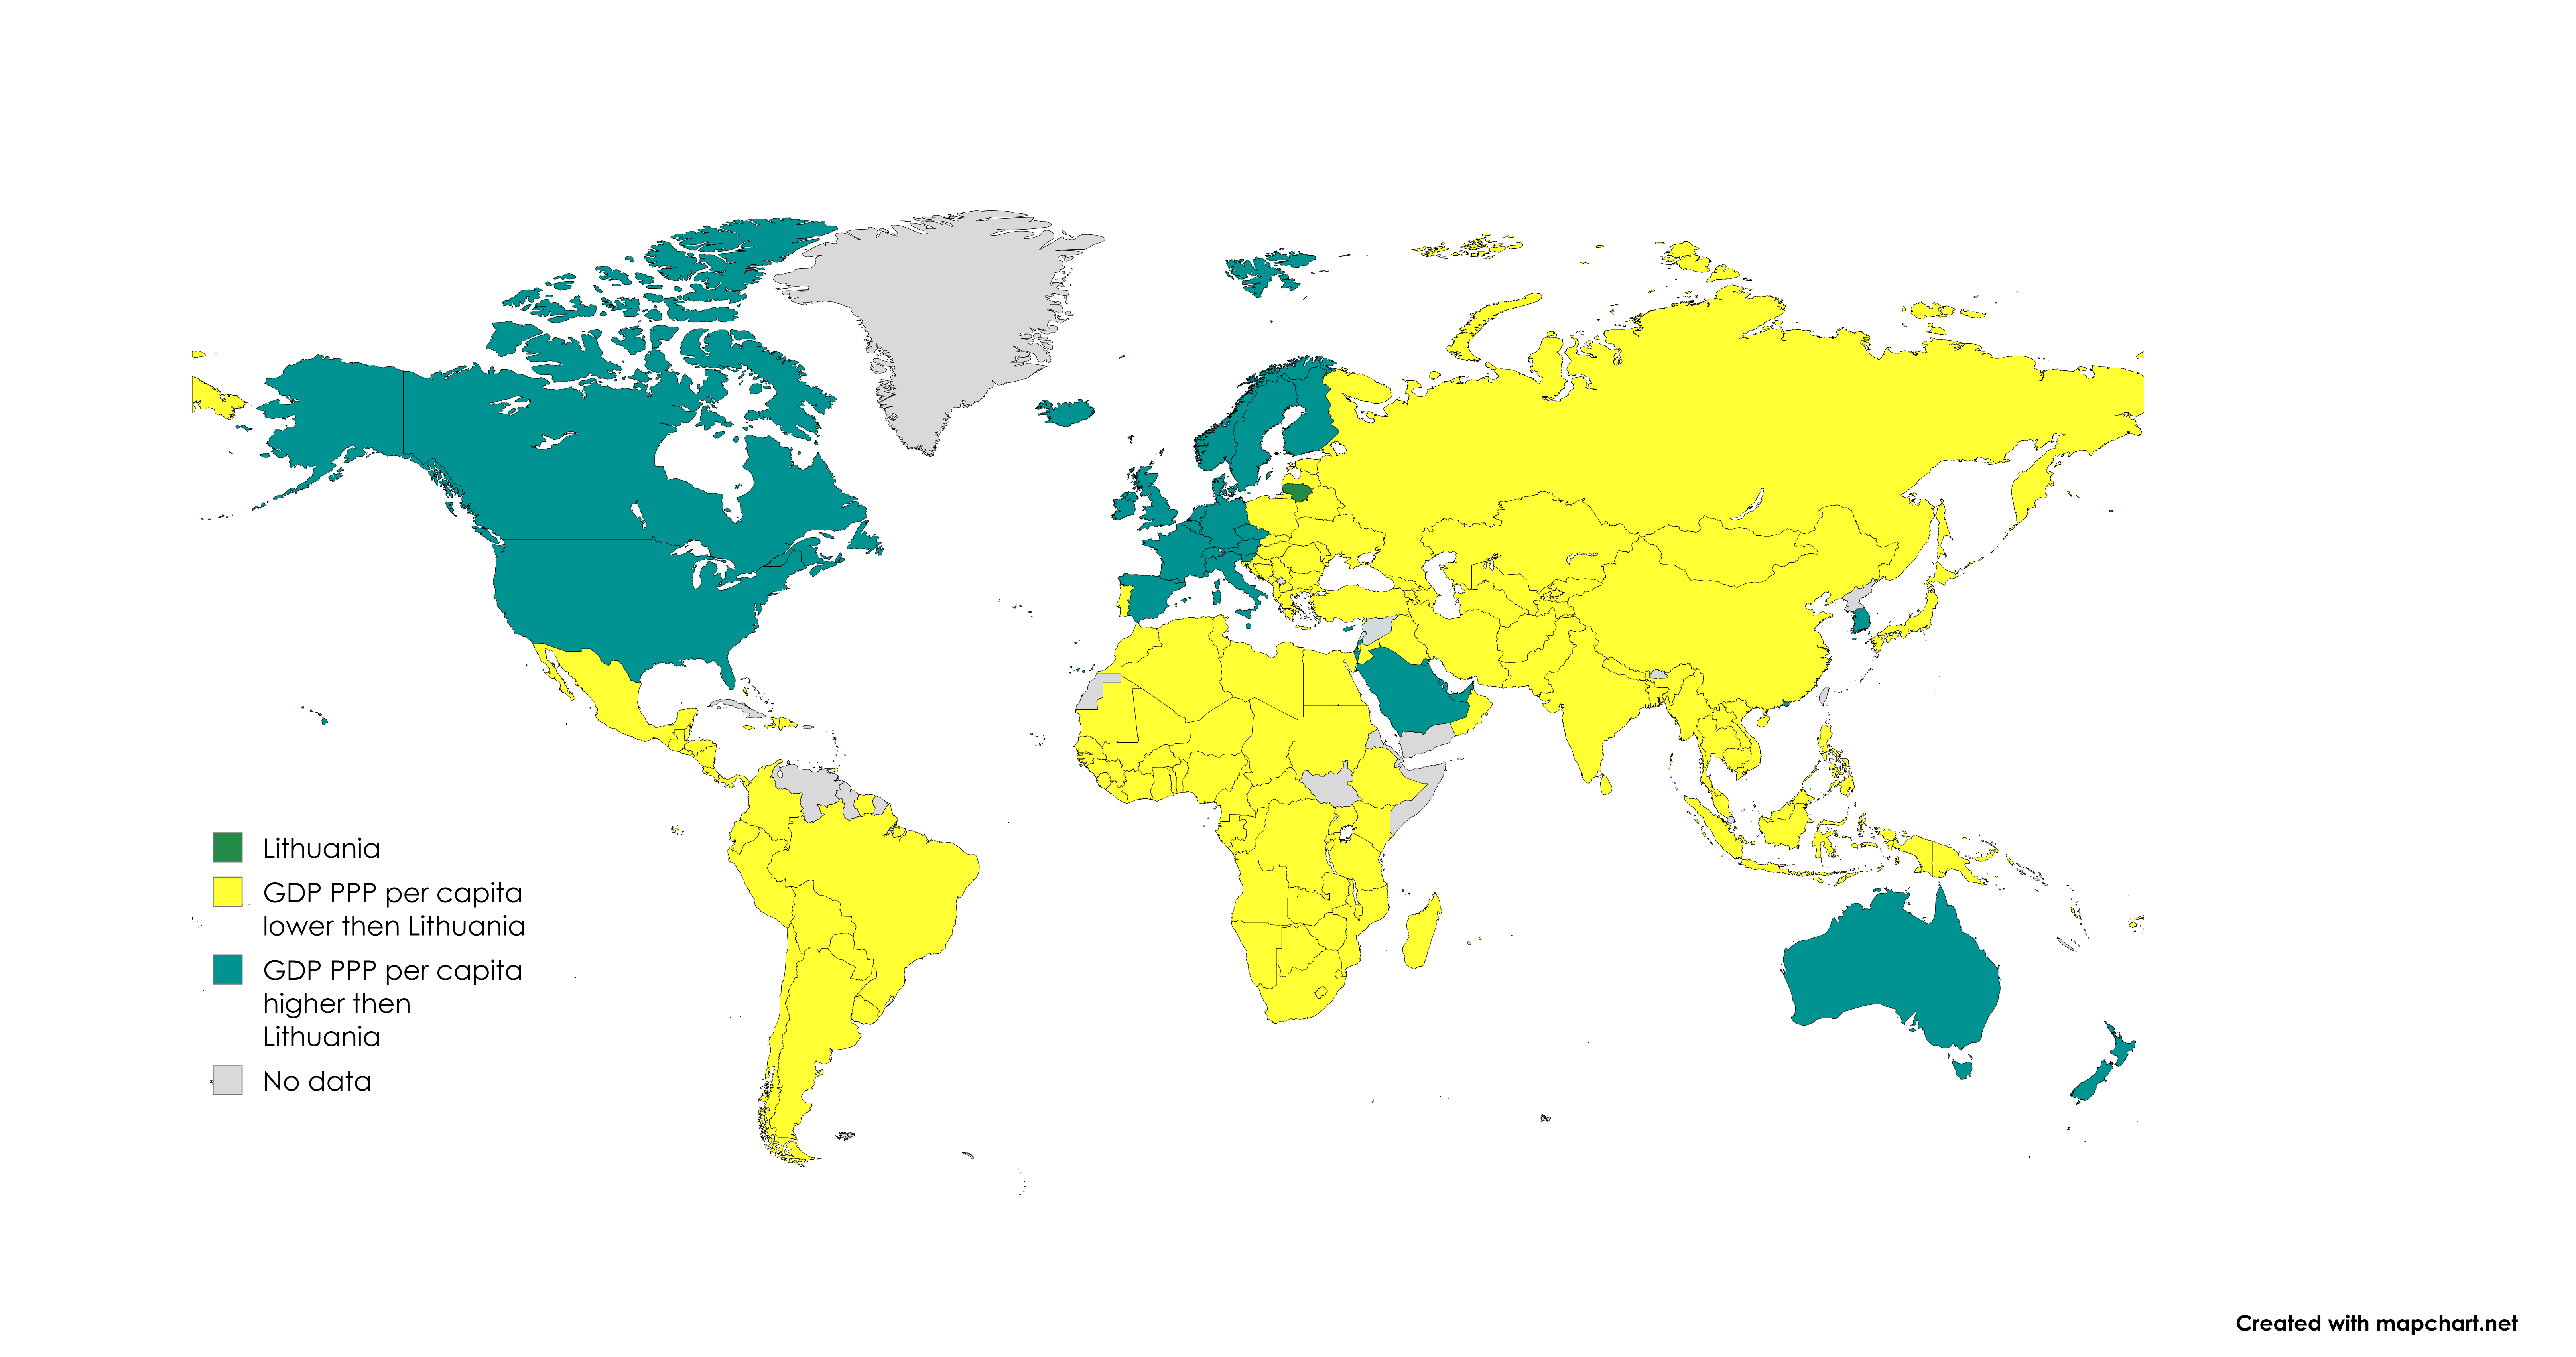
GDP (PPP) Per Capita Lithuania Map

Alex Cartwright
Senior Cartographer & GIS Specialist
Alex Cartwright is a renowned cartographer and geographic information systems specialist with over 15 years of experience in spatial analysis and data...
Geographic Analysis
What This Map Shows
The GDP (PPP) per capita Lithuania map provides a visual representation of the economic performance of Lithuania, expressed in terms of purchasing power parity (PPP). This metric adjusts for price level differences across countries, giving a more accurate reflection of the average income per person in Lithuania compared to other nations. As you look at this map, you’ll notice varying shades that indicate different GDP (PPP) per capita levels across the country, providing insight into the economic landscape of Lithuania.
Deep Dive into GDP (PPP) Per Capita
Gross Domestic Product (GDP) per capita is a crucial indicator of a country’s economic health and living standards. When we talk about GDP (PPP), we're focusing on how much people can actually spend in their local economies rather than just the raw economic output divided by population. This adjustment is particularly significant for Lithuania, a country that has experienced considerable economic transformation since gaining independence from the Soviet Union in 1990.
Interestingly, Lithuania has been one of the standout performers in the Baltic region when it comes to economic growth. The country’s GDP has been on a consistent upward trajectory, particularly since joining the European Union in 2004. In 2021, Lithuania's GDP (PPP) per capita was approximately $47,000, showcasing its position as one of the wealthier nations in Eastern Europe.
What’s fascinating is that Lithuania's economic growth has been driven by a mix of factors, including a robust technology sector, a growing service industry, and increased foreign investment. Vilnius, the capital, has become a hub for startups and tech companies, significantly boosting its local economy. Furthermore, the country has made substantial investments in education and infrastructure, which have also contributed to this upward trend.
However, it's essential to consider that GDP (PPP) per capita is just one piece of the puzzle. While it provides a snapshot of economic performance, it doesn’t capture income inequality or regional disparities within the country. For instance, urban areas, particularly Vilnius and Kaunas, tend to have much higher GDP (PPP) per capita figures compared to rural regions, where economic development has lagged behind.
Regional Analysis
Examining the map closely allows us to see distinct regional variations in GDP (PPP) per capita across Lithuania. For instance, Vilnius stands out with the highest figures, reflecting its status as the economic and cultural heart of the country. Here, the concentration of businesses, higher wages, and a vibrant job market contribute to a greater overall wealth per capita.
In contrast, areas like the northeastern region of Utena tend to have lower GDP (PPP) per capita. This can be attributed to several factors, including a reliance on agriculture and lower levels of industrialization. Interestingly, while these regions are often seen as less economically prosperous, they possess unique opportunities such as tourism and natural resources that could be harnessed for growth.
Moreover, the coastal city of Klaipeda, being a significant port, also shows a competitive GDP (PPP) per capita due to its strategic importance in trade and logistics. The port facilities not only facilitate international commerce but also create numerous job opportunities, thereby boosting the local economy.
Significance and Impact
Understanding GDP (PPP) per capita in Lithuania is vital for several reasons. First and foremost, it serves as a barometer of the country’s economic health and a tool for policymakers to address potential disparities in wealth. As Lithuania continues to develop, tracking these figures can help identify areas that require more targeted economic support.
Moreover, the implications of GDP (PPP) per capita go beyond mere numbers. They impact social services, infrastructure development, and overall quality of life for residents. For instance, higher GDP figures can lead to better health care and education systems, while lower figures may signal the need for intervention to uplift struggling communities.
Looking to the future, Lithuania's economic prospects appear promising, especially with its commitment to innovation and sustainability. As more businesses emerge and the country solidifies its position in the European market, one can expect the GDP (PPP) per capita to continue to rise, albeit with an eye on ensuring that growth is inclusive and equitable across all regions.
In conclusion, the GDP (PPP) per capita map of Lithuania is more than just a visualization of economic data; it reflects the ongoing story of a nation striving for prosperity and balance amidst the challenges of growth. It invites us to consider not just how much wealth is generated, but how it is distributed and experienced by the people of Lithuania.
Visualization Details
- Published
- August 22, 2025
- Views
- 104
Comments
Loading comments...