Map of Years of Work to Buy 1 Bitcoin

David Chen
Data Visualization Specialist
David Chen is an expert in transforming complex geographic datasets into compelling visual narratives. He combines his background in computer science ...
Geographic Analysis
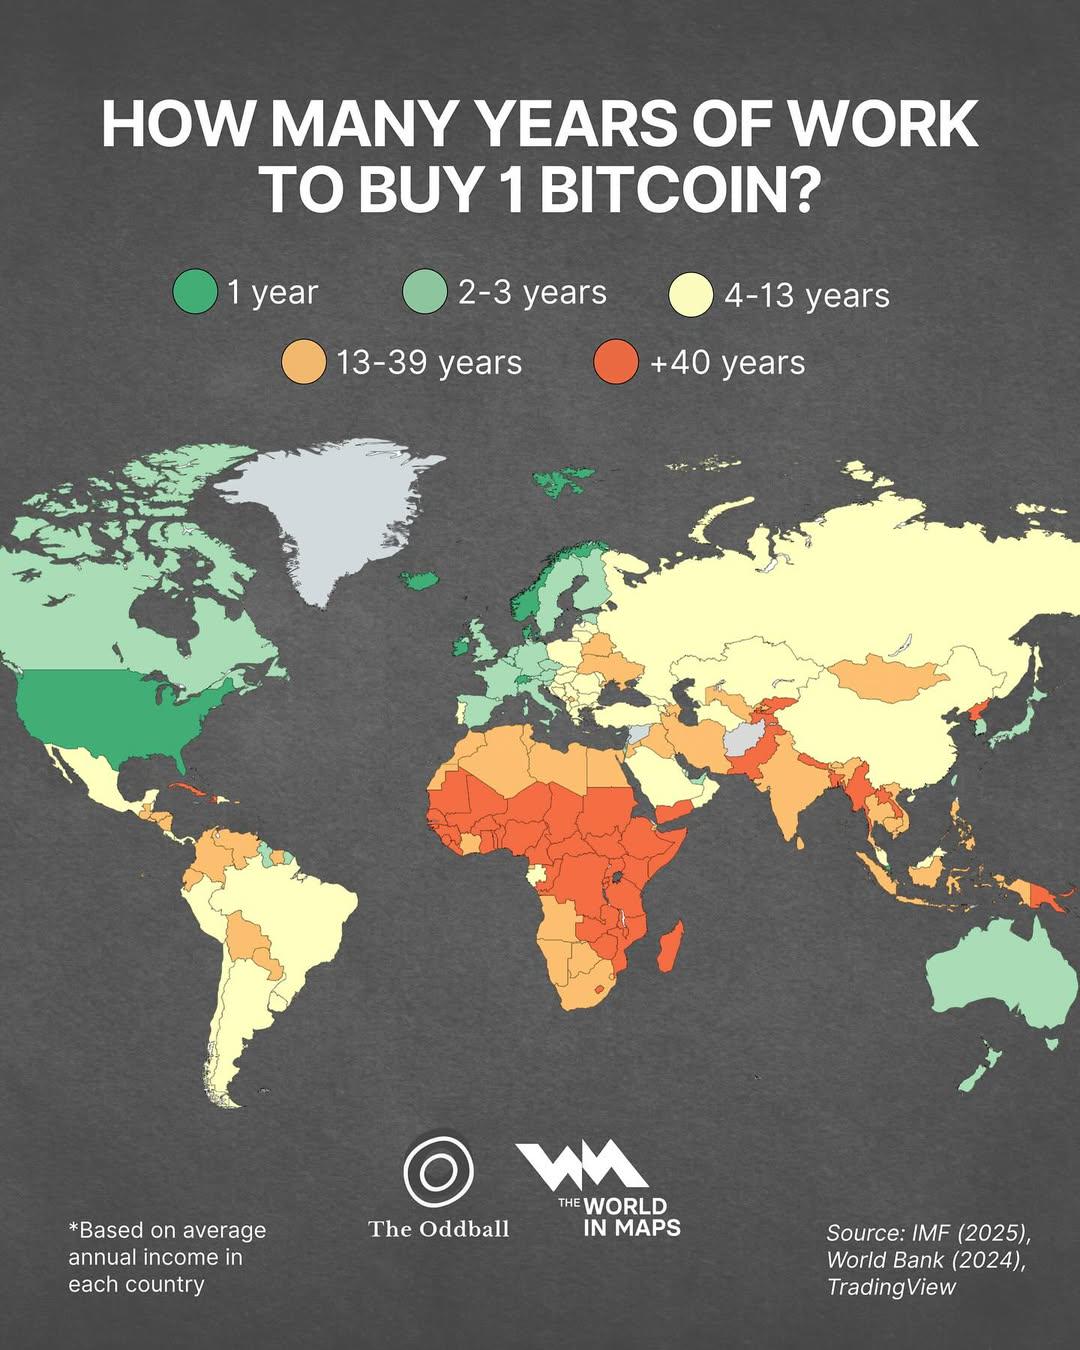
What This Map Shows
This map visualizes the number of years an average worker would need to work to afford one Bitcoin, highlighting significant disparities across various countries. It reflects the local economic conditions, average incomes, and the current price of Bitcoin, which has become a benchmark for many in the world of cryptocurrency.
As Bitcoin continues to gain popularity, understanding its affordability relative to income is crucial. This map is not just a reflection of economic data; it’s a lens through which we can examine the broader implications of cryptocurrency adoption and financial accessibility.
Deep Dive into Cryptocurrency Affordability
Cryptocurrency, particularly Bitcoin, has emerged as a revolutionary financial asset, often viewed as a digital gold. The core concept of Bitcoin revolves around decentralization, allowing individuals to transact without intermediaries, which challenges traditional banking systems. However, the price volatility and the rising value of this cryptocurrency pose questions about affordability for average workers worldwide.
According to recent statistics, the average price of one Bitcoin has fluctuated significantly, reaching highs of over $60,000 in 2021 before seeing corrections. This volatility directly impacts how many years of work are required to purchase a single Bitcoin, as the average annual salary varies dramatically between countries.
In high-income countries like the United States, where the average salary hovers around $50,000, it might take just over one year of work to buy a Bitcoin at a price of $60,000. However, in lower-income nations, the scenario is vastly different. For instance, in countries where the average annual income is below $10,000, it could take over six years of work to afford just one Bitcoin, creating a staggering disparity.
Interestingly, the technology adoption rate also plays a critical role in this equation. Countries with higher internet penetration and technology use tend to have a more significant interest in cryptocurrencies. This can create a paradox where while the rich can afford to invest in Bitcoin, those in poorer regions may find themselves excluded from the potential benefits of this digital currency.
Regional Analysis
When examining the map closely, it becomes evident that regions such as North America and Western Europe have a significantly shorter time frame to acquire Bitcoin compared to regions in Africa and Southeast Asia. For example, in countries like Germany and Canada, it might take less than one year of work, while in Nigeria or the Philippines, the years required can soar to five or more.
In Latin America, we see a mixed bag; countries like Argentina, facing economic turmoil and inflation, have a curious relationship with Bitcoin, often turning to it as a hedge against local currency devaluation. Here, the average worker might spend three years or more to buy a Bitcoin, reflecting both the economic challenges they face and the increasing adoption of cryptocurrencies as a potential solution.
Interestingly, the disparities can also be linked to governmental regulations and the level of financial literacy. Countries that actively promote blockchain technology and cryptocurrencies tend to see a more favorable environment for investments, leading to a reduced number of years required to purchase Bitcoin.
Significance and Impact
Understanding how many years of work it takes to buy a Bitcoin is more than just an economic statistic; it highlights the accessibility of financial resources across the globe. It raises important questions about equity in the financial system. As cryptocurrencies continue to evolve, those unable to afford participation in this new economy may find themselves increasingly marginalized.
Moreover, this issue connects to broader themes of economic inequality and access to emerging technologies. As we look towards the future, the growing interest in decentralized finance (DeFi) and other cryptocurrencies may help bridge the gap for those in lower-income regions, but significant barriers remain.
As the world of finance becomes more digitized, understanding these disparities will be crucial for policymakers, investors, and everyday workers alike. The current trends suggest a rapid increase in cryptocurrency adoption, but without addressing the affordability issue, many may still be left behind in this financial revolution.
In conclusion, the map not only provides a snapshot of economic conditions but also serves as a reminder of the pressing need to create a more inclusive financial system as we navigate the complexities of a digital economy.
Visualization Details
- Published
- September 10, 2025
- Views
- 88
Comments
Loading comments...