Median Full-Time Salary by State Map

David Chen
Data Visualization Specialist
David Chen is an expert in transforming complex geographic datasets into compelling visual narratives. He combines his background in computer science ...
Geographic Analysis
What This Map Shows
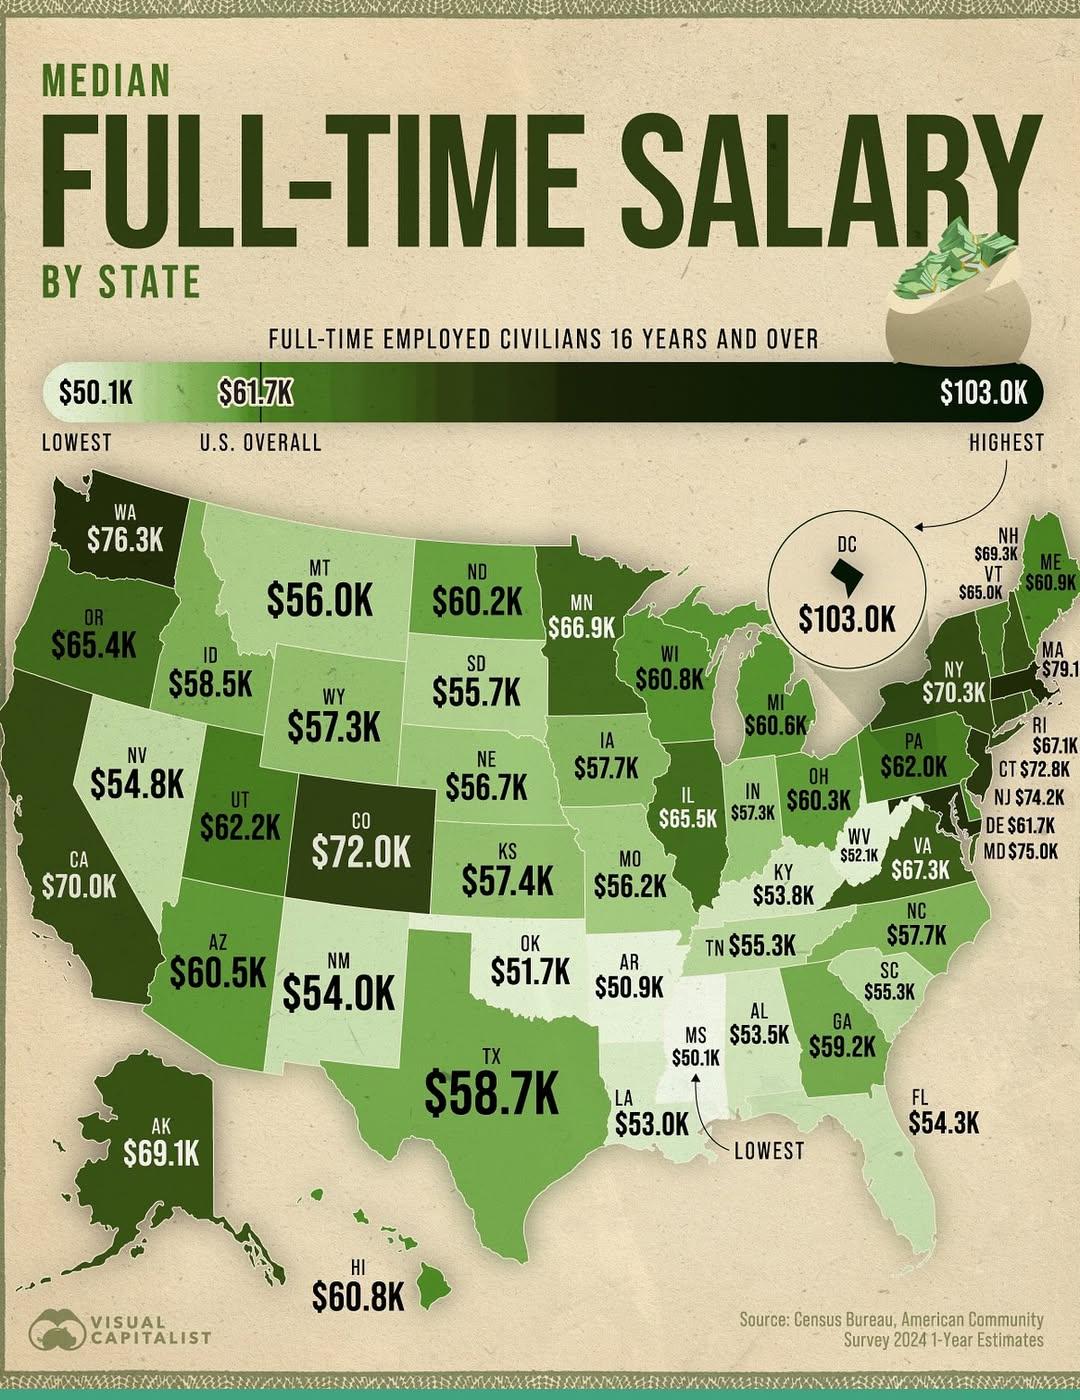
This map presents a comprehensive view of the median full-time salary across the United States, highlighting the significant disparities that exist between states. It visualizes the economic landscape of the country, allowing us to easily compare how median salaries vary from one state to another. Understanding these differences can shed light on various socio-economic factors at play, including cost of living, job availability, and industry presence.
Deep Dive into Median Salaries
When we talk about median full-time salaries, we're diving into an essential aspect of the economic structure of the United States. The median salary is a critical indicator, as it reflects the middle point of earnings, providing a more accurate picture than the average, which can be skewed by extremely high or low incomes.
Interestingly, salaries can vary widely across different regions, influenced by factors such as local economic conditions, industry presence, and educational attainment levels. For instance, states with a high concentration of technology companies, like California, often report higher median salaries compared to states with a more agricultural or service-based economy, like Arkansas.
Several industries drive these salary differences. In states like New York and California, the finance, tech, and entertainment sectors dominate, often leading to higher salaries. Conversely, states that rely heavily on manufacturing or agriculture may see lower median salaries due to the nature of these industries. According to recent statistics, the median salary in states like Massachusetts and Washington often exceeds $70,000, while states such as Mississippi and West Virginia can see figures closer to $40,000.
Furthermore, education plays a pivotal role in salary determination. States that invest in higher education—such as Virginia with its numerous universities—tend to have a more skilled workforce and, consequently, higher median salaries. The correlation between educational attainment and income is well-documented; individuals with advanced degrees typically earn significantly more than those without.
Regional Analysis
Examining the median full-time salary map by region reveals intriguing patterns. The Northeast, often characterized by a high cost of living, features states like New York and Massachusetts at the top of the salary chart. New York, for instance, boasts a median salary that reflects its status as a global financial hub, while Massachusetts benefits from its prestigious universities and a booming tech sector.
Moving towards the Midwest, states like Illinois and Minnesota show competitive salaries, largely due to their diverse economies that encompass both agriculture and manufacturing. Interestingly, however, some states in the Midwest, like Indiana, lag behind, illustrating how economic diversification can influence salary averages.
In the South, states like Texas and Florida are notable for their rapidly growing economies, attracting businesses and skilled workers alike, resulting in higher median salaries. Conversely, states such as Alabama and Louisiana often struggle with lower salaries, reflecting economic challenges that include higher poverty rates.
The West Coast presents a fascinating juxtaposition. California leads with high median salaries, but the cost of living is also sky-high, meaning that even with higher salaries, many struggle to afford housing. This dynamic raises questions about the sustainability of such salary levels in the face of rising living costs.
Significance and Impact
The topic of median full-time salaries is not just about numbers; it profoundly impacts various aspects of life in the U.S. For one, it directly correlates with quality of life indicators, such as access to healthcare, education, and housing. High median salaries can often mean better public services and infrastructure, contributing to overall economic health.
Moreover, understanding salary trends can inform policymakers and economic planners. With the ongoing shifts in job markets, especially post-pandemic, many states are re-evaluating their economic strategies to attract talent and businesses. For example, remote work has allowed many individuals to live in states with lower costs while earning salaries from companies based in high-cost areas, creating new dynamics in salary expectations.
Looking to the future, trends suggest that as technology continues to evolve and industries transform, we may see significant shifts in salary distributions across the U.S. The rise of remote work, in particular, could equalize some of the disparities we currently observe, as individuals can choose to live in more affordable areas without sacrificing salary.
Thus, this map is not just a snapshot of current earnings; it’s a window into the evolving economic landscape of the United States, reflecting the complex interplay of geography, industry, and human capital.
Visualization Details
- Published
- October 18, 2025
- Views
- 42
Comments
Loading comments...