Government Debt to GDP Map

David Chen
Data Visualization Specialist
David Chen is an expert in transforming complex geographic datasets into compelling visual narratives. He combines his background in computer science ...
Geographic Analysis
What This Map Shows
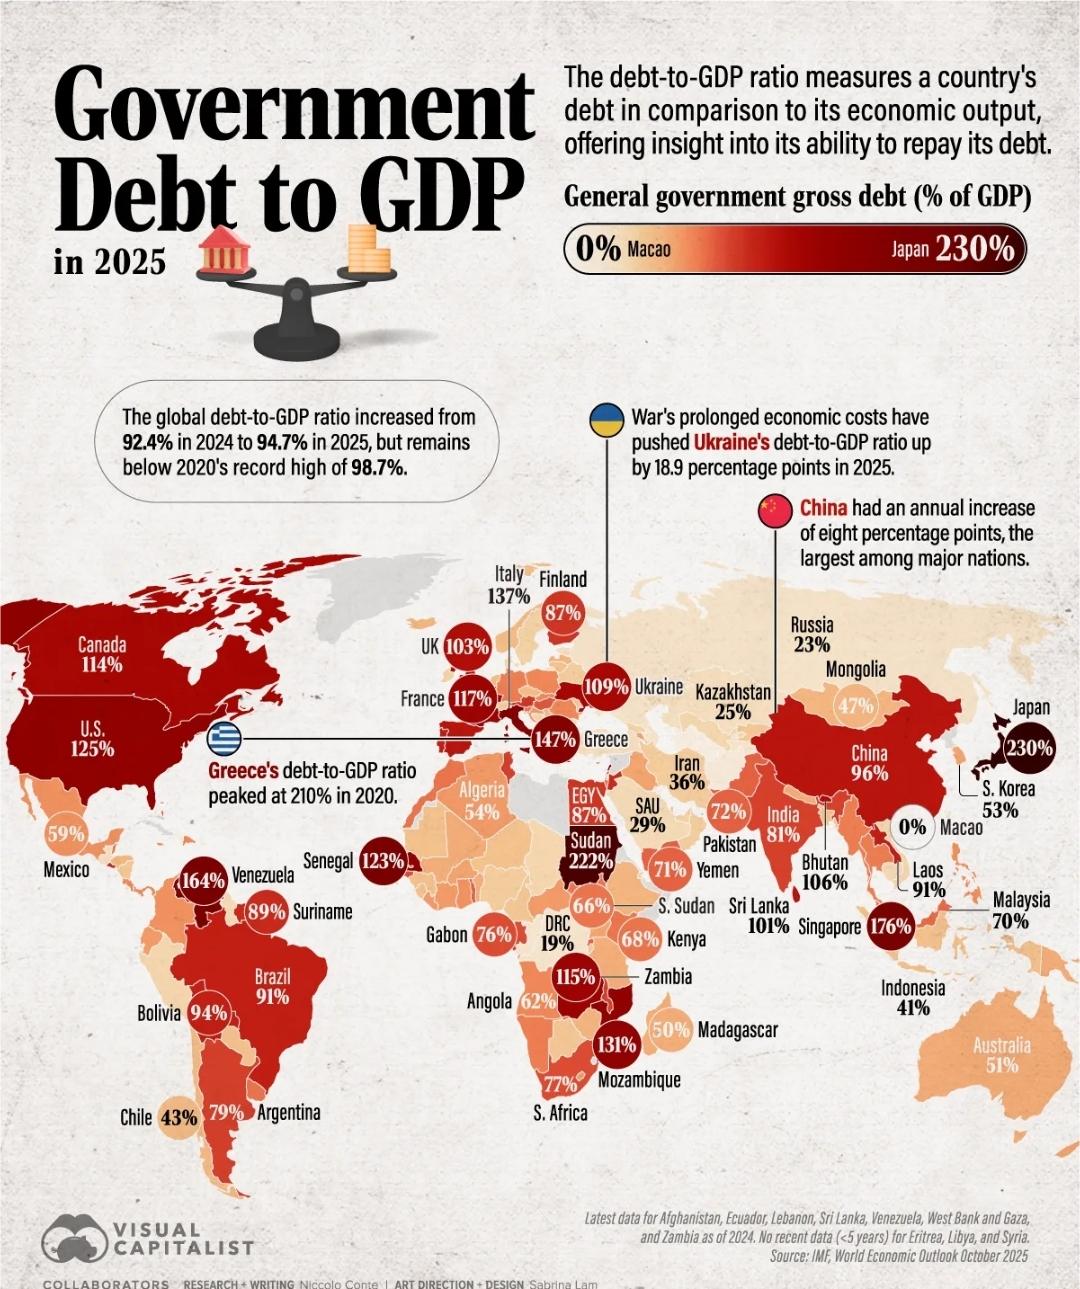
The "Government Debt to GDP Map" visualizes the ratio of a country's public debt to its Gross Domestic Product (GDP). This key economic indicator helps us understand how much a nation owes in relation to what it produces. The map typically colors countries based on their debt-to-GDP ratios, allowing for a quick visual comparison across the globe. This metric is crucial because it provides insights into a country's financial health and economic management.
Deep Dive into Government Debt to GDP
Government debt to GDP is a vital statistic that allows analysts, policymakers, and citizens alike to gauge a country’s fiscal stability. A high debt-to-GDP ratio might signal that a country is over-leveraged, meaning it could struggle to meet its debt obligations. Conversely, a lower ratio may suggest a healthier economy with more room for growth.
Interestingly, the concept of national debt isn't new. Countries have borrowed money for centuries, often during times of war or economic downturn. However, the implications of high debt have become more pronounced in today's global economy. The interest rates on government debt can fluctuate significantly based on perceived risk, which is influenced by a country’s debt levels and economic outlook. For example, countries with high perceived risk may face higher borrowing costs, leading to an unsustainable debt cycle.
What’s fascinating is that the relationship between government debt and GDP can vary widely. For instance, Japan has one of the highest debt-to-GDP ratios in the world, exceeding 250%, yet it maintains a stable economy. This is largely due to the fact that much of its debt is held domestically and financed by low-interest loans. In contrast, countries like Greece faced severe financial crises due to high debt levels combined with external borrowing pressures.
Moreover, the effects of government debt can ripple through economies. High debt levels can lead to increased taxes, reduced public spending, and slower economic growth. Countries in the Eurozone, for instance, have had to implement stringent austerity measures in response to high debt levels, impacting social services and public investment.
As we analyze various countries, it’s essential to consider the context behind the numbers. Countries with substantial natural resources, like Norway, can often sustain higher debt levels without negative repercussions, thanks to their revenue streams. In contrast, many developing nations struggle with debt levels that hinder their growth potential and development.
Regional Analysis
When examining the map, we can see distinct regional patterns in government debt. In Europe, many countries grapple with high debt levels. For instance, Italy and Greece often rank among the highest in the EU, reflecting long-standing economic challenges and the impacts of the financial crisis. Interestingly, the Nordic countries, while generally having lower debt-to-GDP ratios, also feature robust social welfare systems that require significant public investment.
In North America, the United States has a substantial debt-to-GDP ratio, often hovering around 100%. This situation raises ongoing debates about fiscal policy and the sustainability of current spending levels. However, the U.S. economy remains resilient, supported by its status as a global economic powerhouse and the dollar's role as the world's reserve currency.
Turning to Asia, countries like China have been increasing their debt levels significantly, often used for infrastructure development. However, this growth in debt brings about concerns regarding potential economic slowdowns and the health of the global economy. Meanwhile, South Korea maintains a relatively low debt-to-GDP ratio, showcasing a different economic approach and fiscal discipline.
In Africa, the situation varies considerably. Countries like South Africa are facing mounting debt challenges linked to slower growth and external pressures. On the other hand, nations like Rwanda have demonstrated effective management of debt relative to their GDP, leveraging it for developmental goals.
Significance and Impact
Understanding government debt to GDP is crucial in today’s interconnected world, especially as nations navigate the complex economic landscape following the pandemic. High debt levels can lead to inflationary pressures, influencing not just national economies but also global markets. As countries work to stimulate growth, the balance between borrowing and sustainable economic practices becomes even more critical.
Looking ahead, trends indicate that many countries may continue to experience rising debt levels due to ongoing investments in infrastructure, healthcare, and social services. However, as we have seen historically, the ability to manage this debt effectively will determine whether it leads to growth or economic instability. Have you noticed how policymakers are increasingly discussing fiscal responsibility in light of these trends? This dynamic will undoubtedly shape economic discussions for years to come.
Visualization Details
- Published
- October 28, 2025
- Views
- 10
Comments
Loading comments...