economic indicators Maps
10 geographic visualizations tagged with "economic indicators"
Global GDP Per Capita Map
This map provides a visual representation of Gross Domestic Product (GDP) per capita across countries worldwide. GDP per...
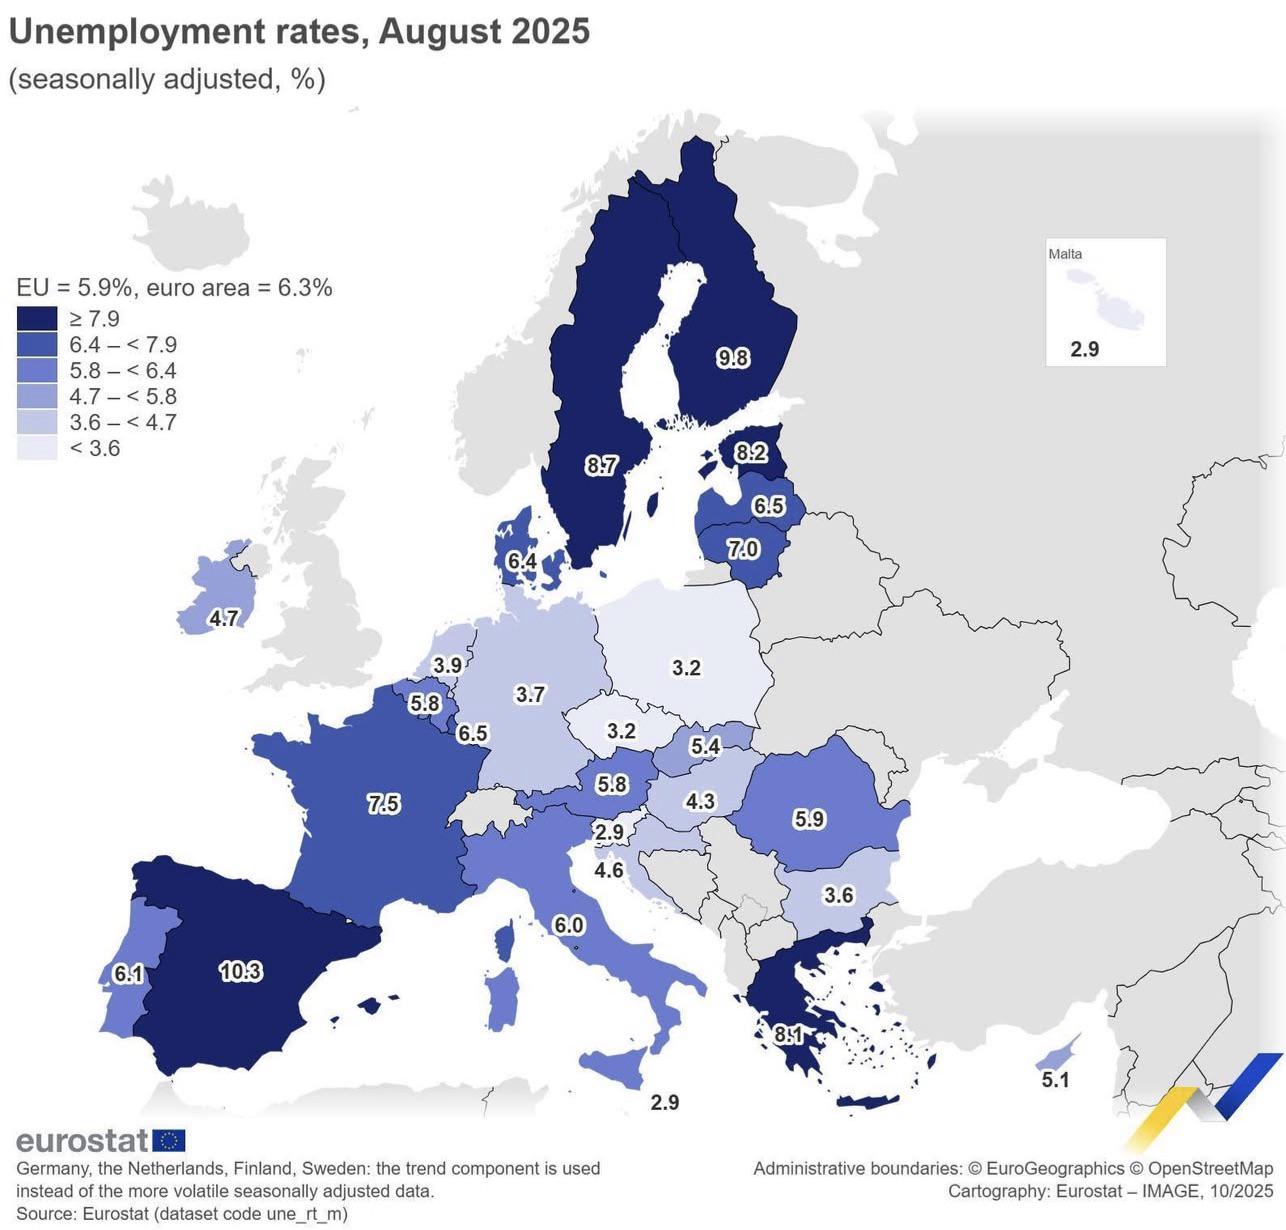
Unemployment Rates in the EU Map
The "Unemployment Rates in the EU, August 2025" map provides a comprehensive visualization of the unemployment landscape...
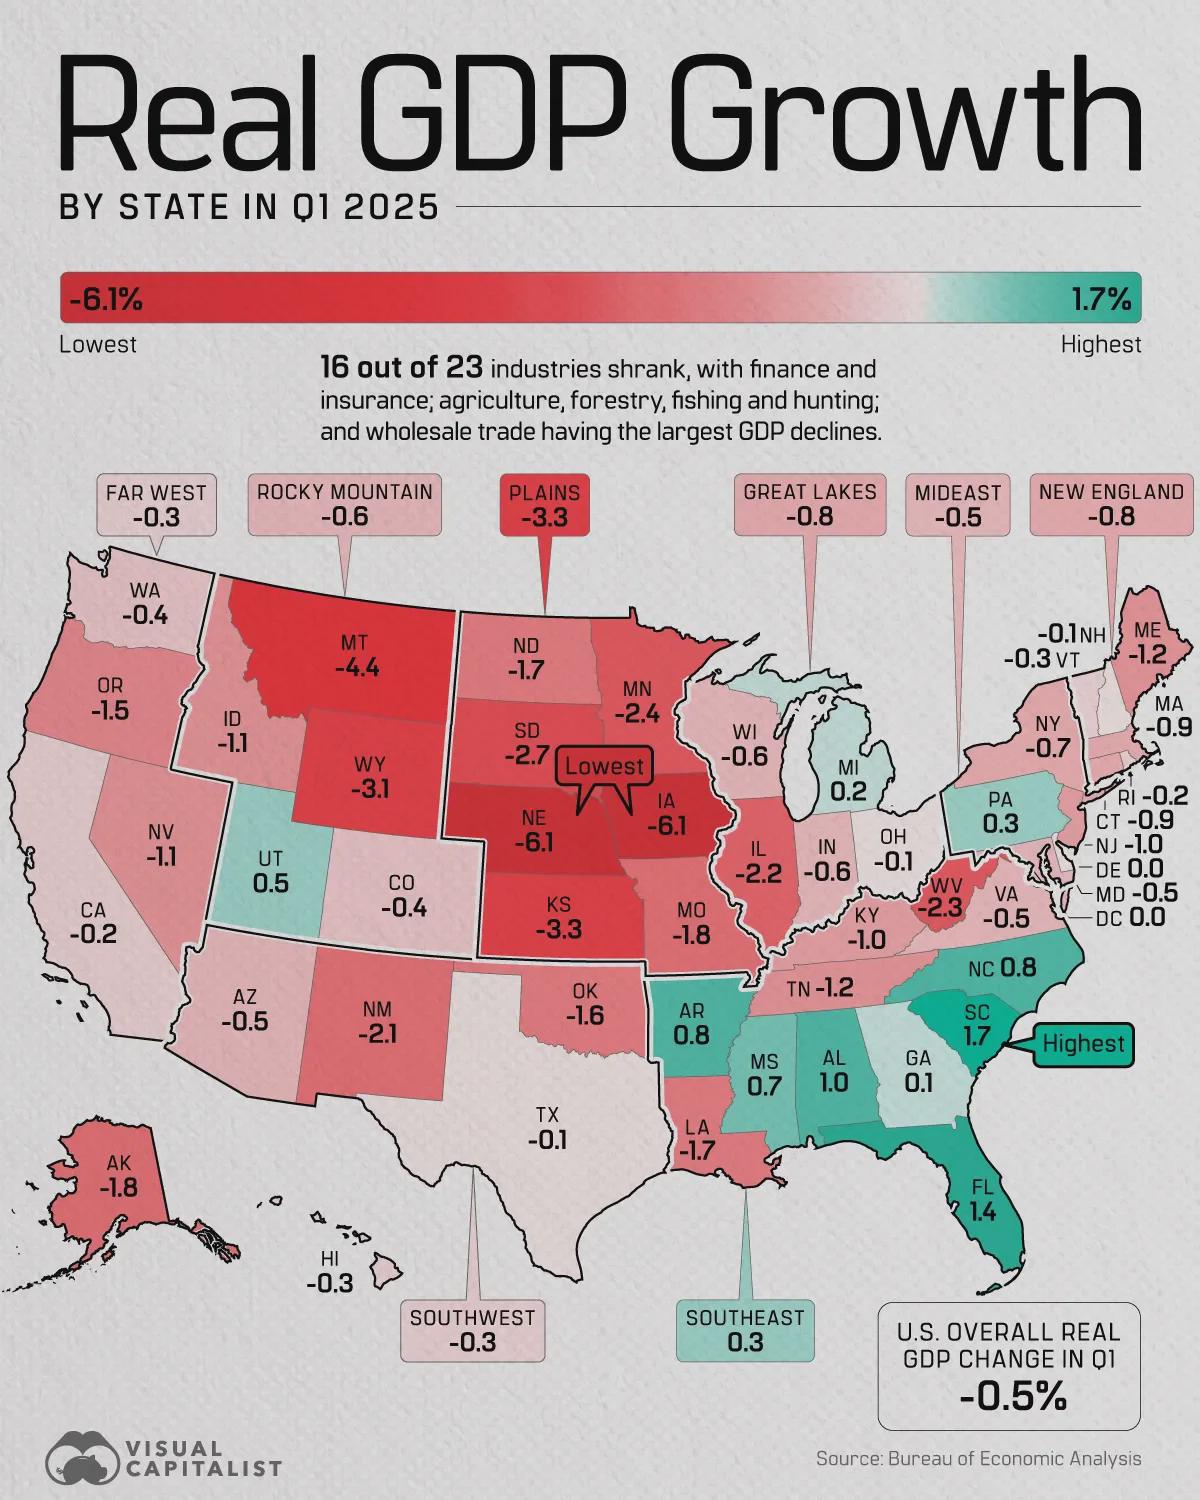
United States Real GDP Growth by State Map
The "United States Real GDP Growth by State in Q1 2025" map visually represents the economic performance of each state i...
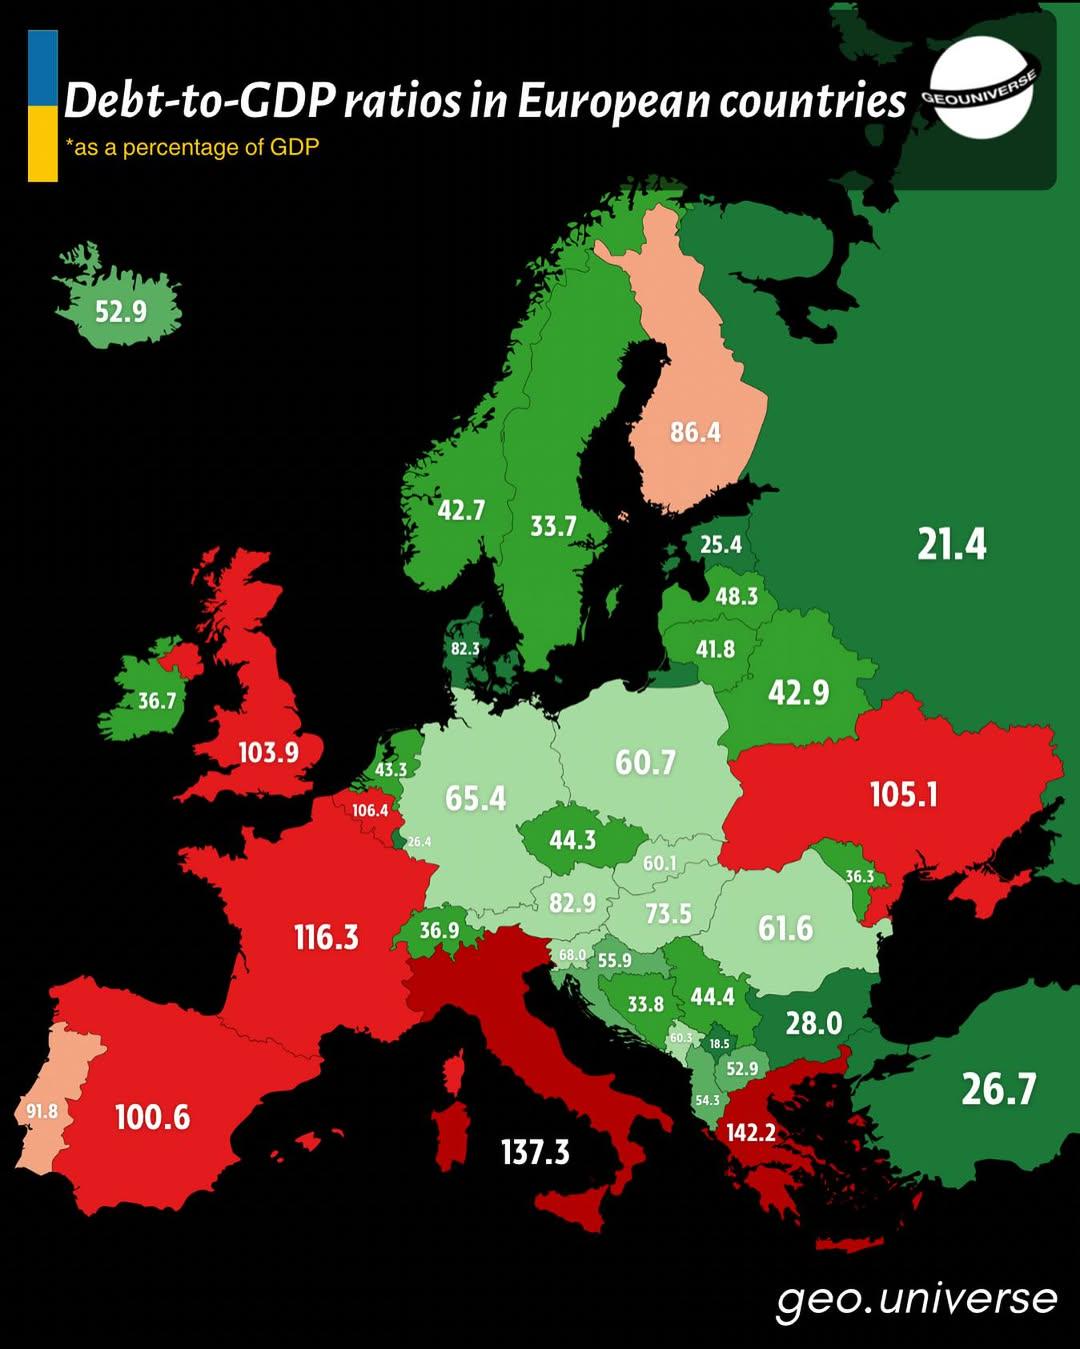
Debt-to-GDP Ratios in Europe Map
The "Debt-to-GDP Ratios in Europe (2025)" map provides a comprehensive overview of the economic health of European natio...
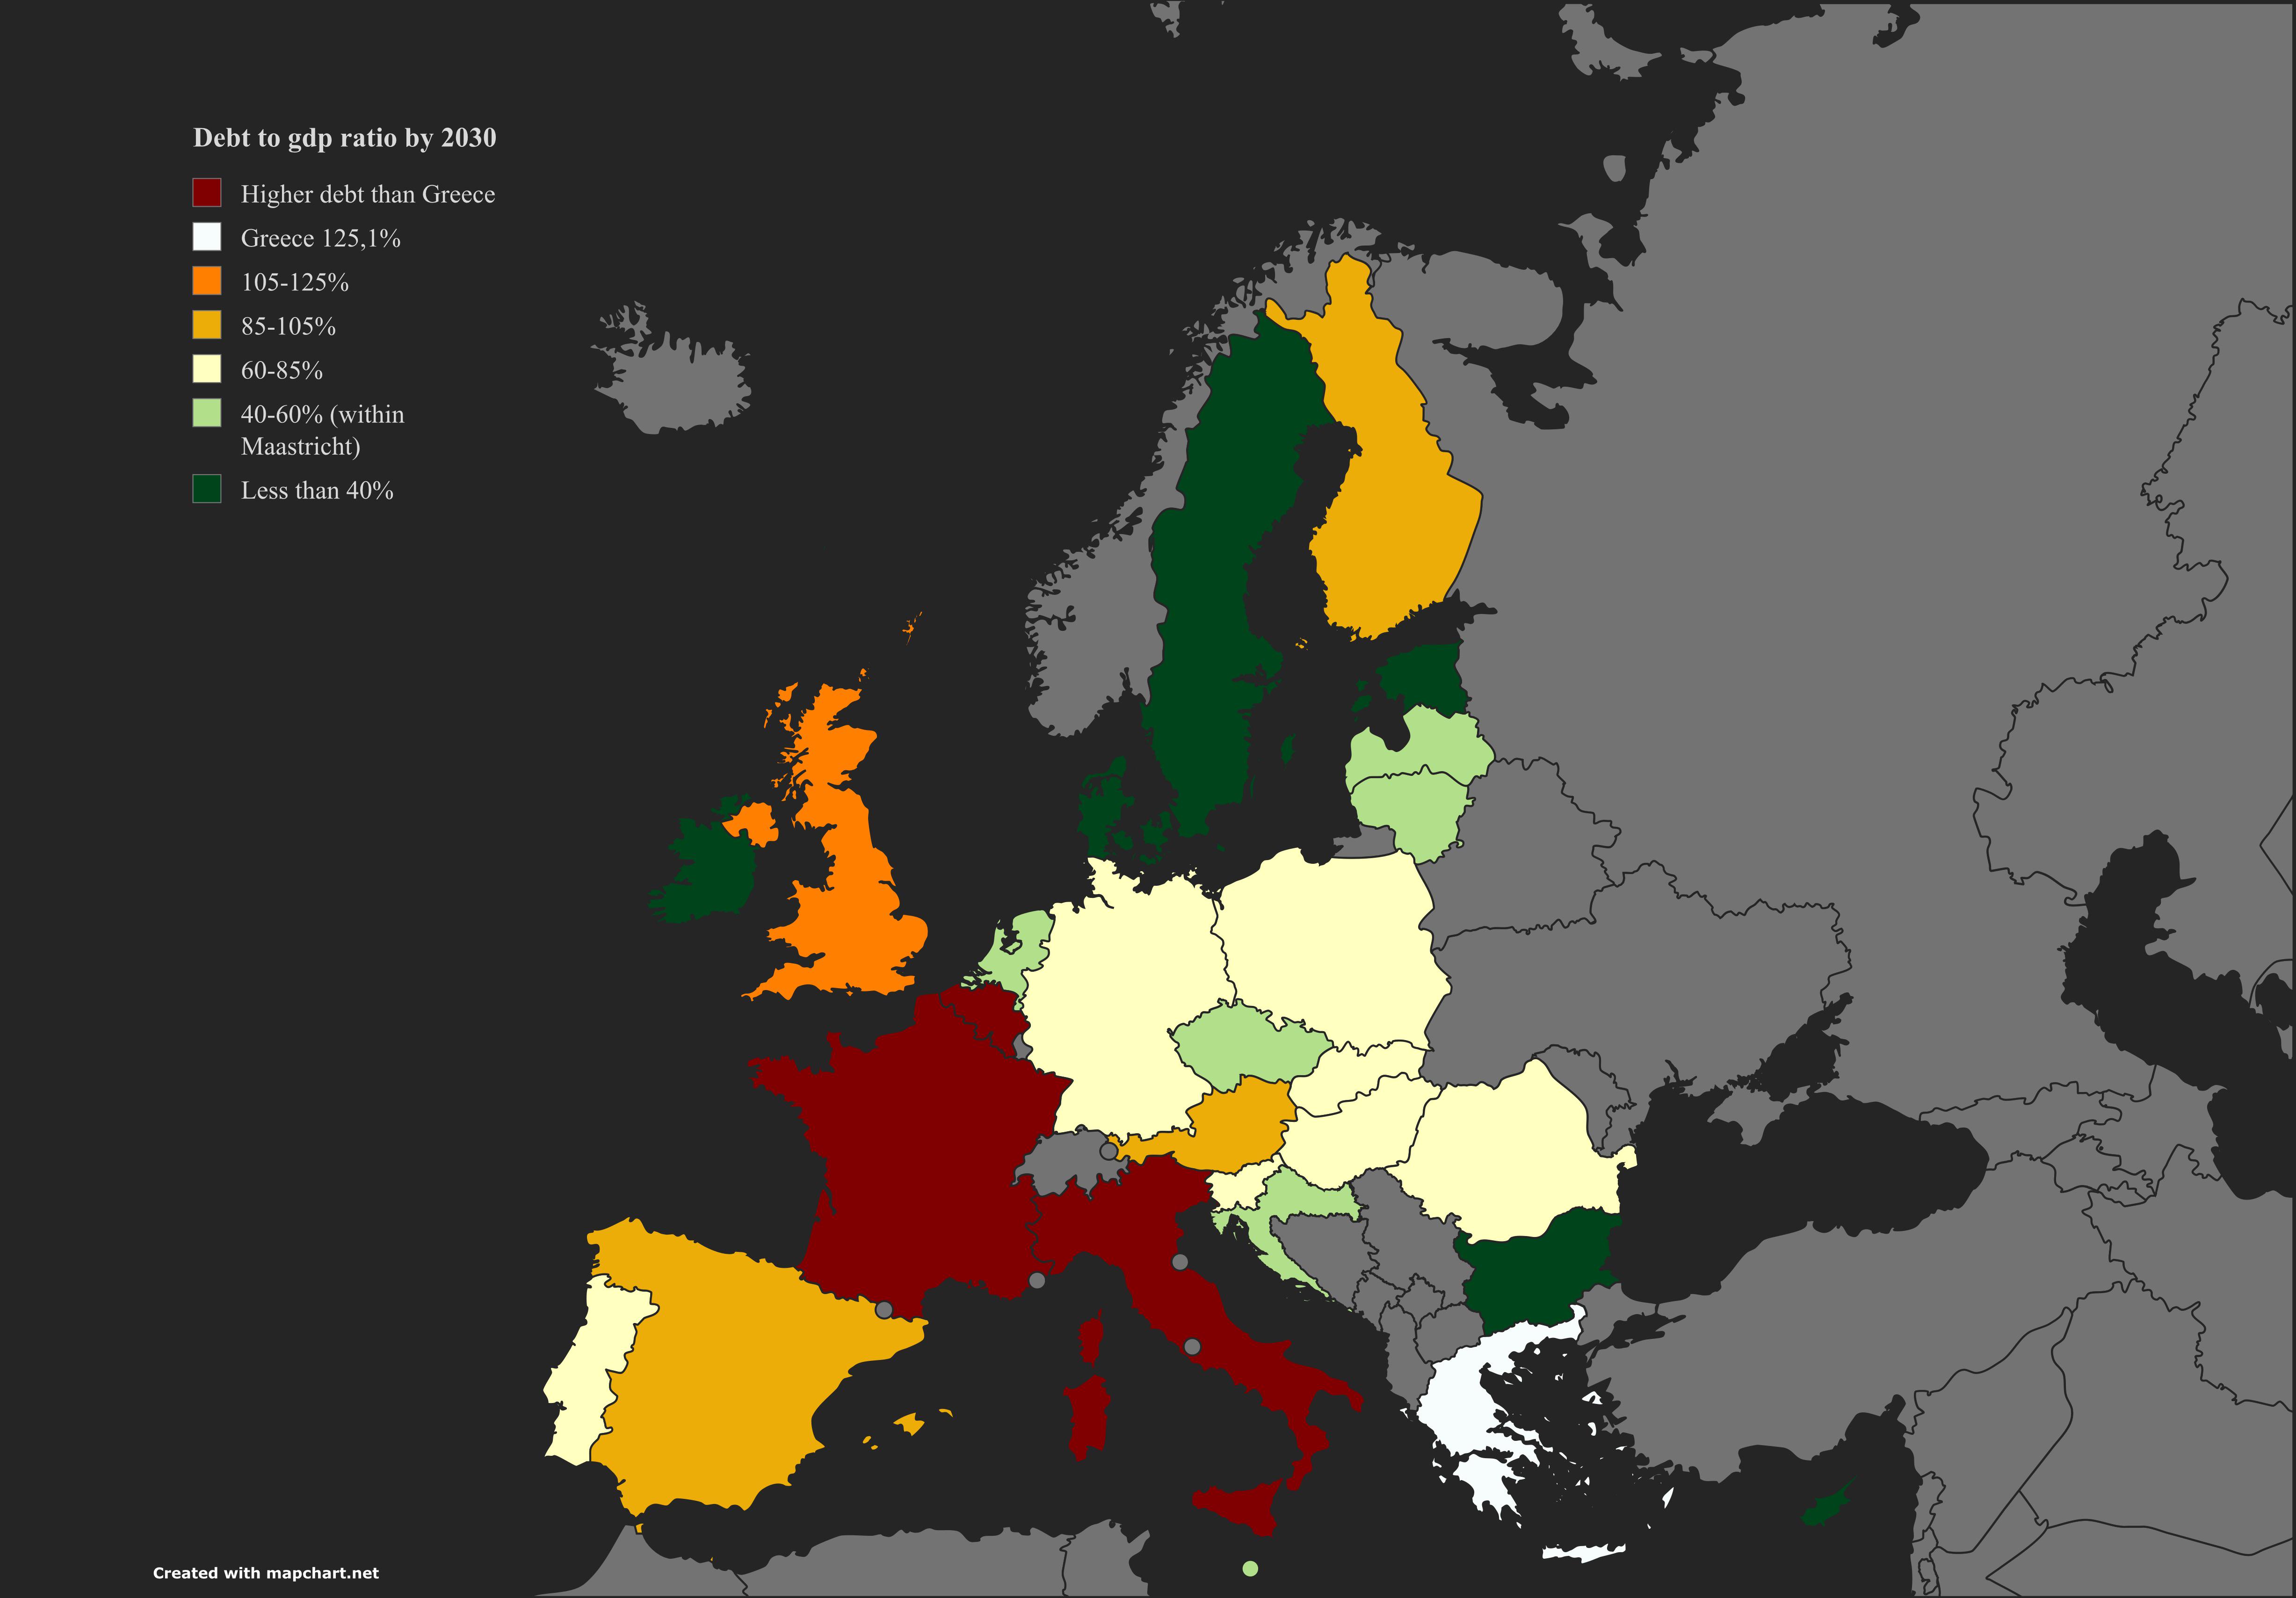
Debt to GDP Ratio by 2030 Map
The visualization titled "Debt to GDP Ratio by 2030 in the EU and the UK according to the IMF" provides a comprehensive ...
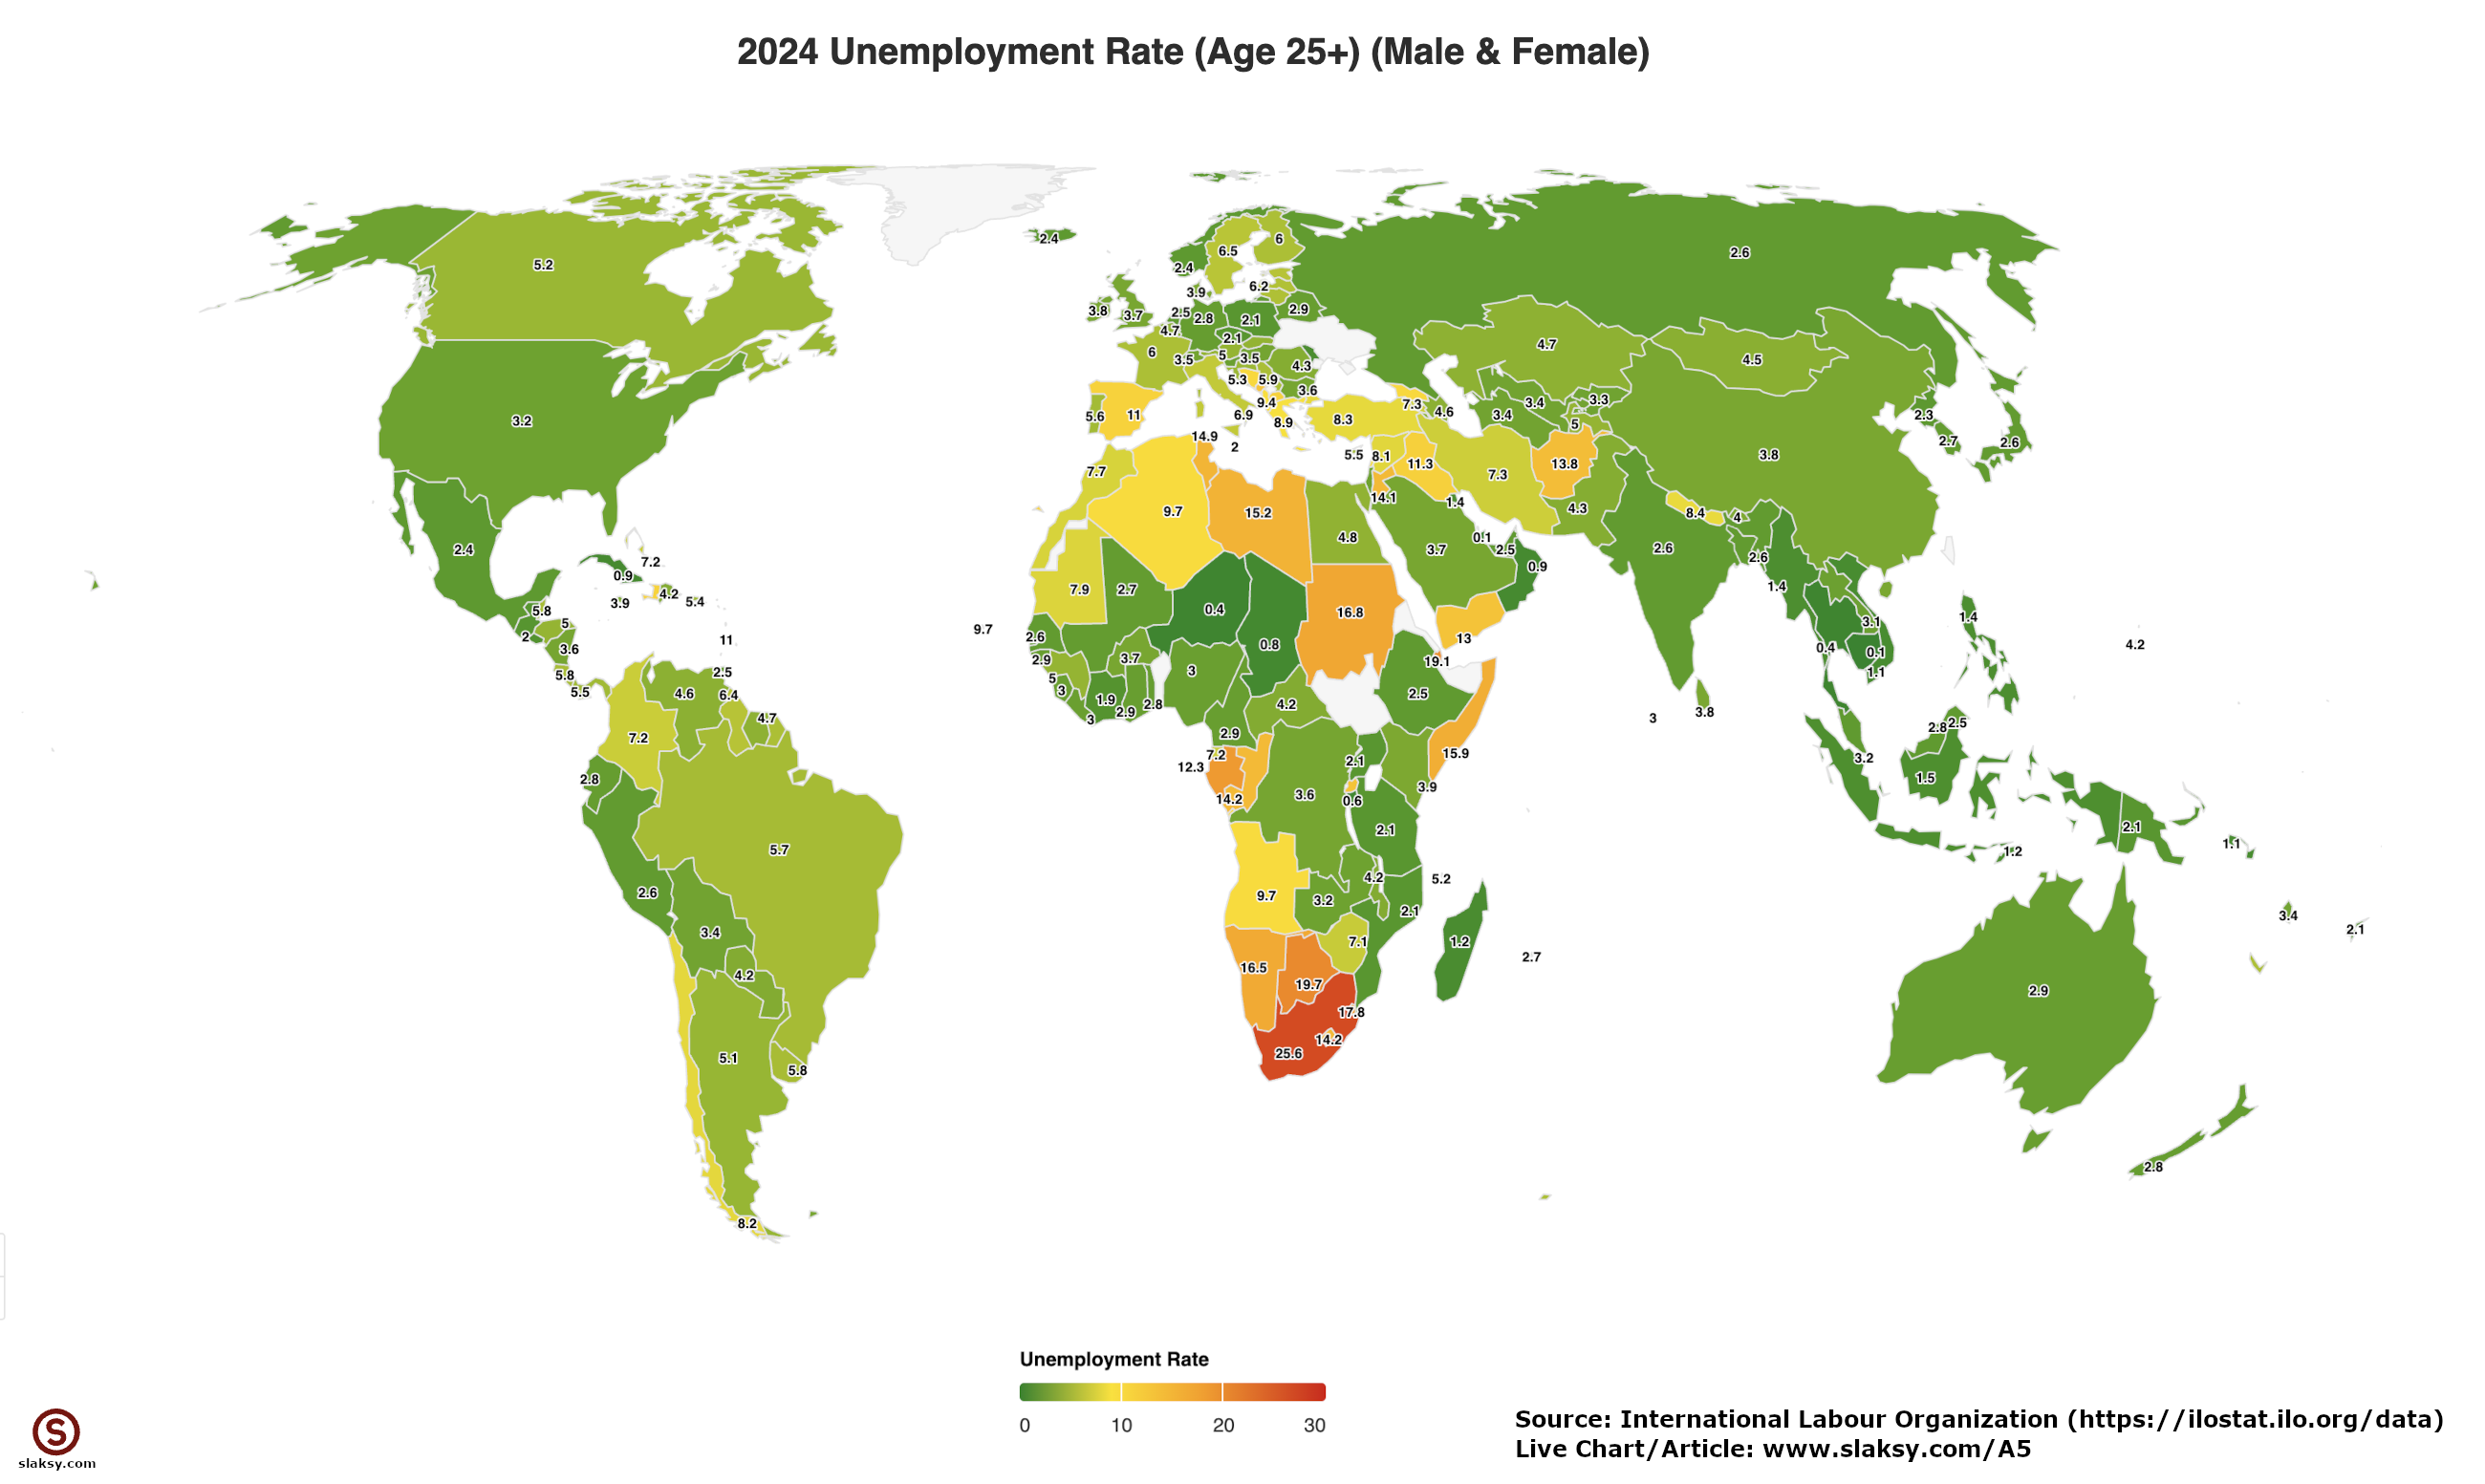
Global Map of 2024 Unemployment Rates
The "Global Map of 2024 Unemployment Rates" provides a comprehensive overview of the unemployment landscape across diffe...

GDP Per Capita by Italian Regions Map
Interestingly, regions like Lombardy, home to Milan, the financial capital of Italy, showcase a robust economy driven by...
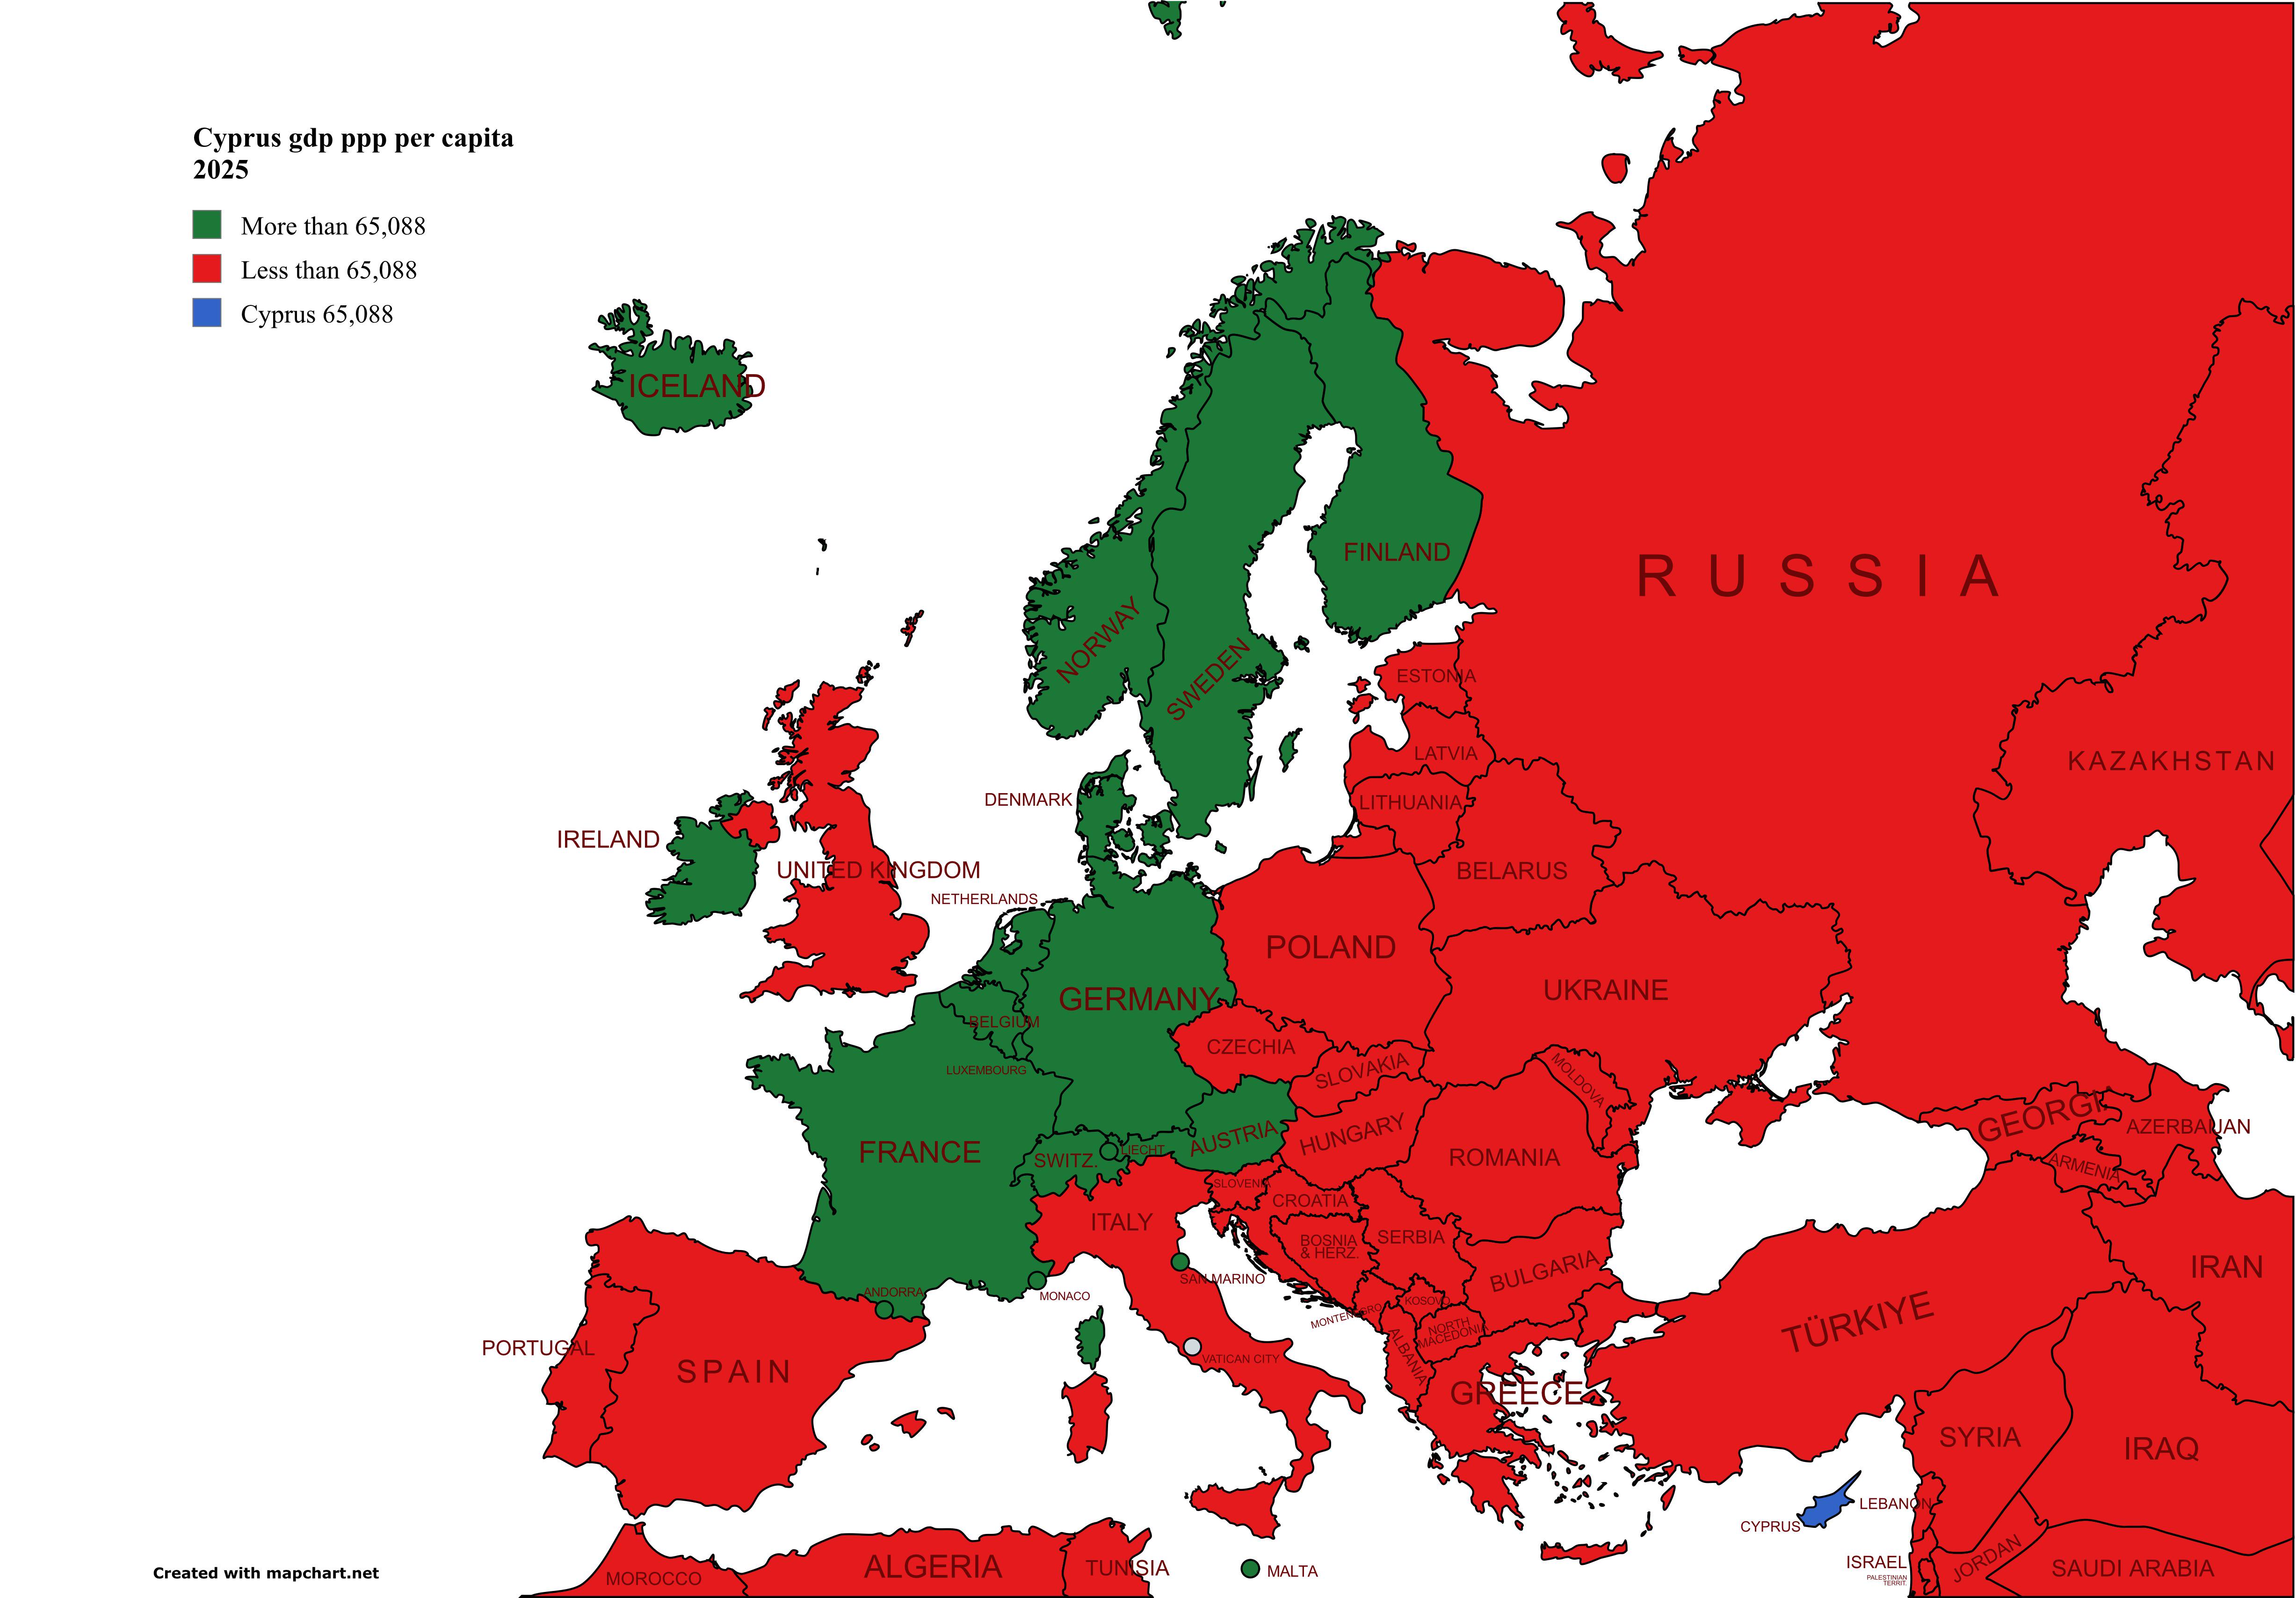
GDP Per Capita by Country Map
The visualization titled "European and Neighboring Countries Compared to Cyprus by GDP (PPP) per Capita – IMF 2025" prov...
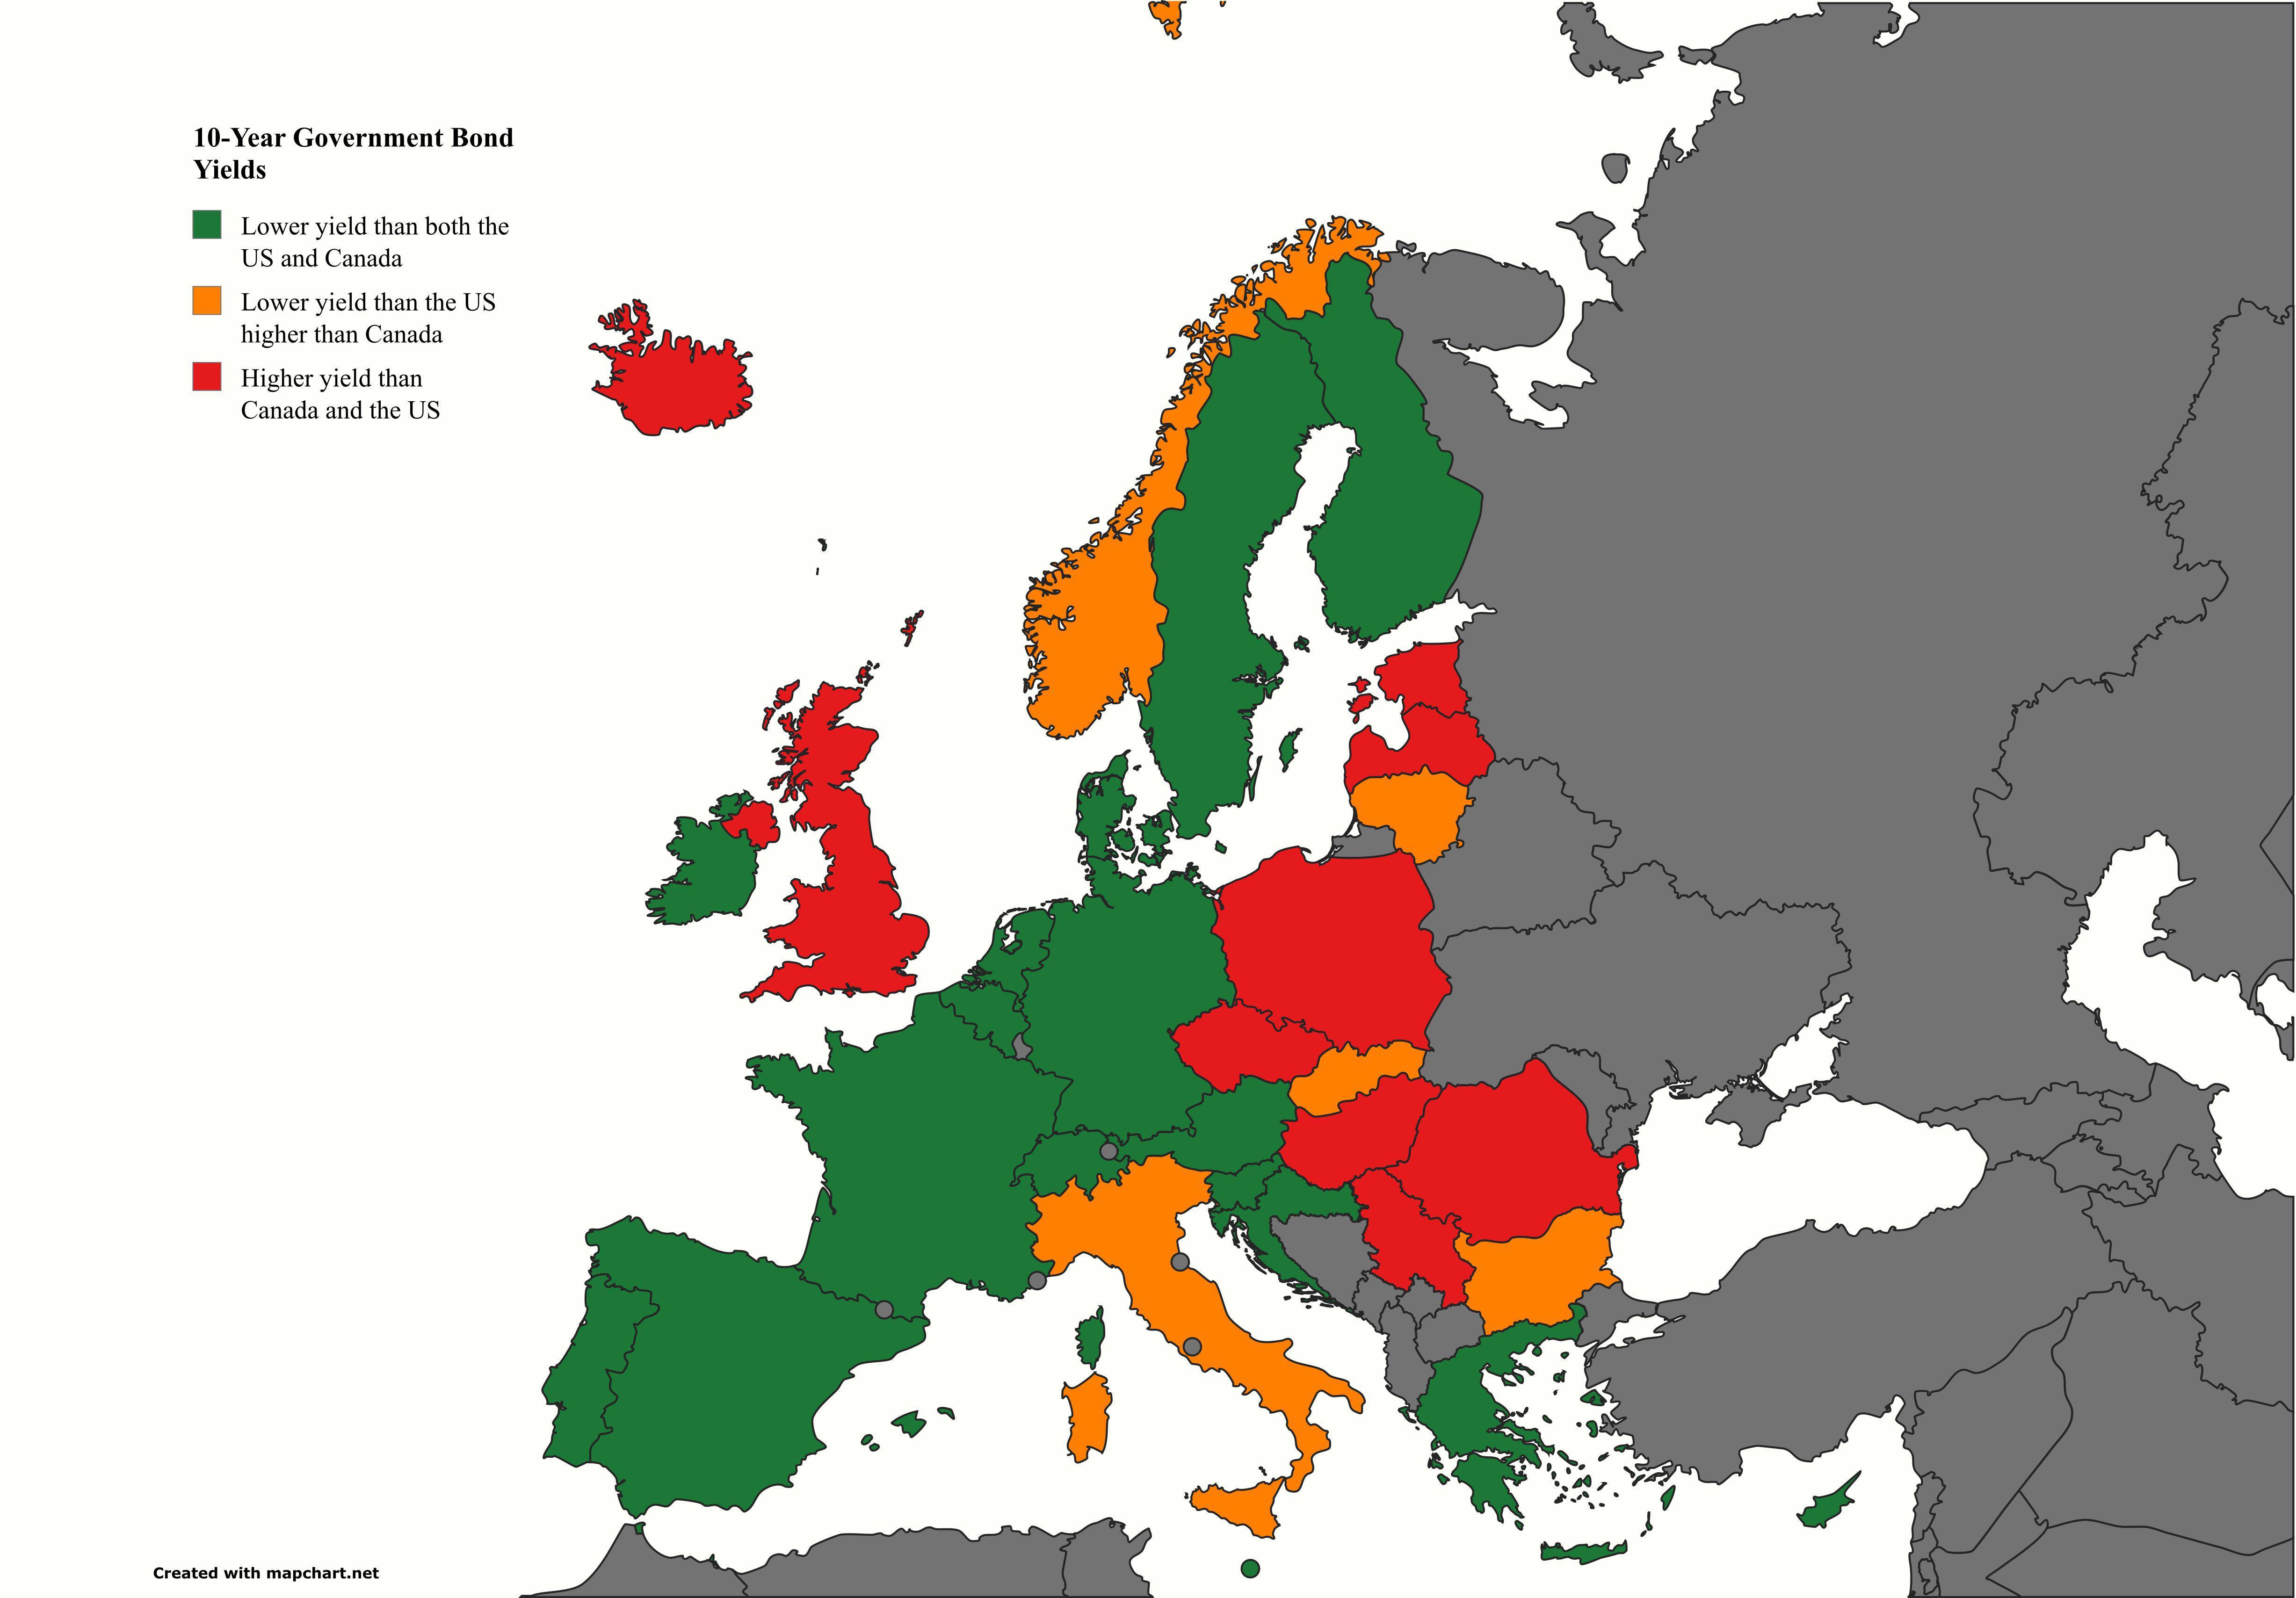
Europe and North America's 10-Year Yields Map
This map presents a comparative visualization of the 10-year government bond yields across Europe, the United States, an...
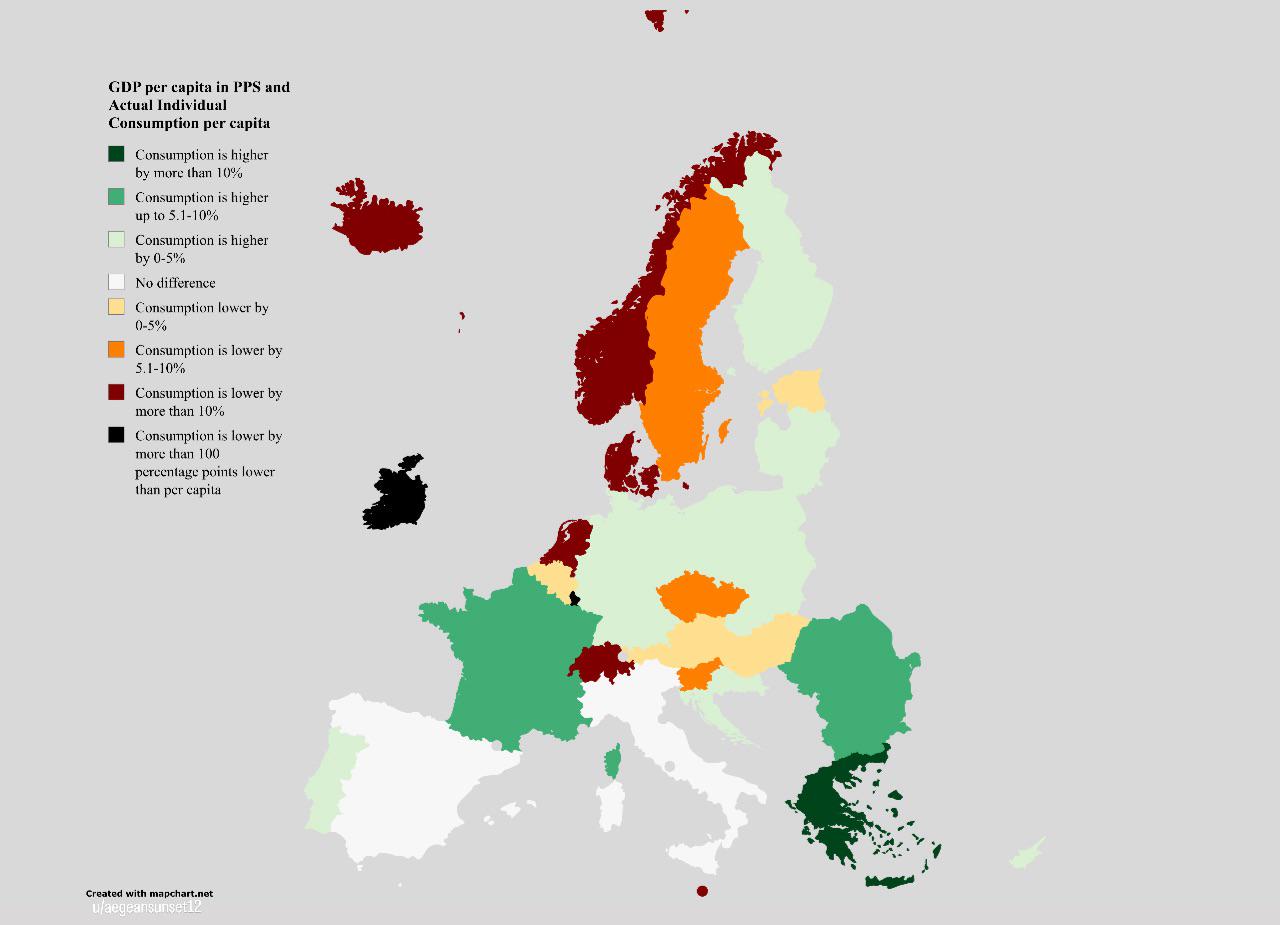
GDP vs. Consumption Map in the EU
The visualization titled "Paper Wealth vs. Plate Wealth: GDP vs. Consumption in the EU" provides an insightful compariso...