GDP Per Capita by Country Map 1990

Marcus Rodriguez
Historical Geography Expert
Marcus Rodriguez specializes in historical cartography and geographic data analysis. With a background in both history and geography, he brings unique...
Geographic Analysis
What This Map Shows
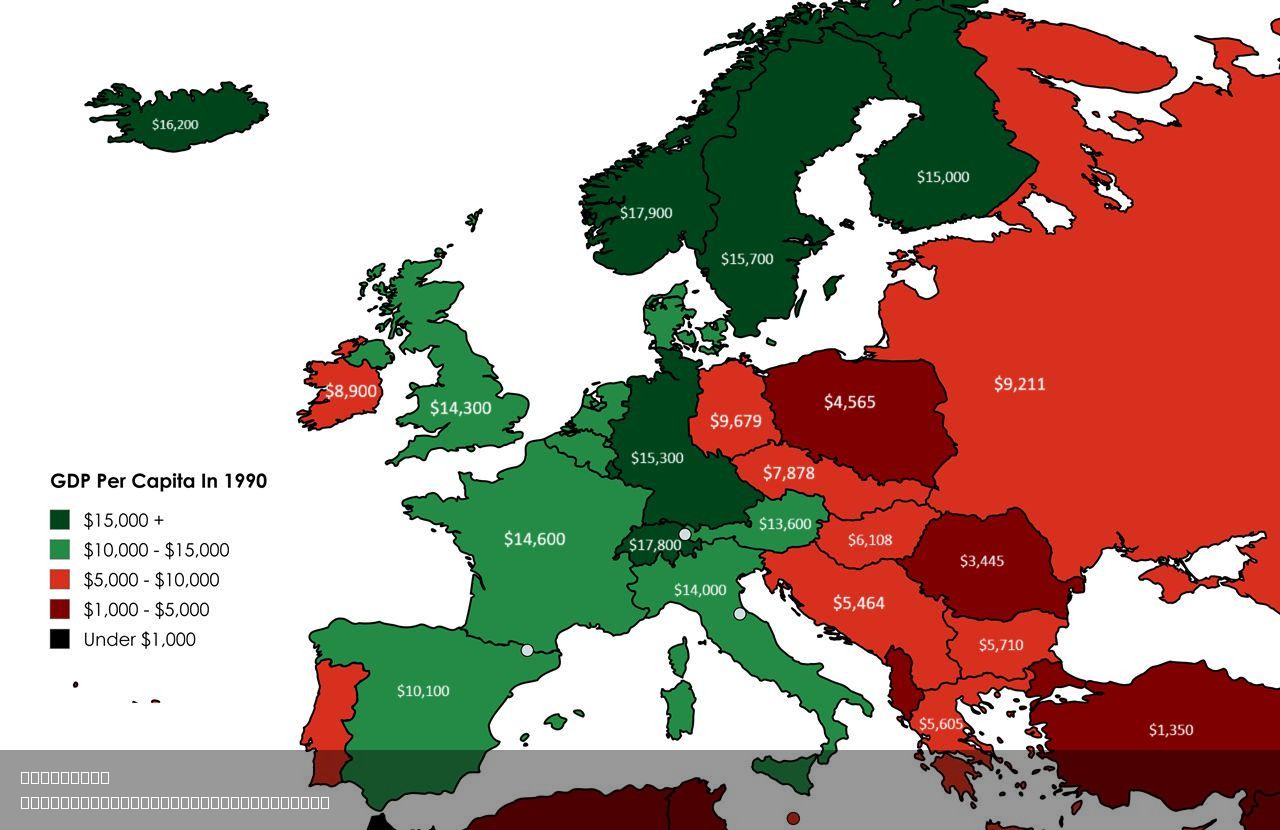
The map titled "European GDP Per Capita in 1990" provides a visual representation of the economic output per person across various European countries during that year. This visualization highlights the disparities in wealth and economic health among nations, allowing viewers to quickly grasp which countries fared better economically at the onset of the 1990s. Notably, GDP per capita serves as a crucial indicator of economic performance, reflecting not just the overall wealth but also the standard of living for residents.
Deep Dive into GDP Per Capita
GDP per capita is calculated by dividing a country's gross domestic product by its population, resulting in a figure that indicates the average economic output per individual. In the context of Europe in 1990, this metric reveals a fascinating snapshot of the continent's economic diversity. The early 1990s were a pivotal time for many European countries, particularly in light of the geopolitical changes that followed the collapse of the Soviet Union and the end of the Cold War.
Interestingly, GDP per capita can be influenced by various factors, including natural resources, industrial development, government policies, and historical contexts. For instance, Western European nations such as Luxembourg, Switzerland, and Norway boasted notably high GDP per capita figures, often exceeding $30,000. This was largely due to their well-established economies, robust industries, and high levels of investment in education and infrastructure.
On the other hand, Eastern European countries, particularly those transitioning from centrally planned economies to market-oriented systems, showed lower GDP per capita figures. Nations like Poland and Hungary, while on the path to economic reform, had GDP per capita figures around $5,000 to $10,000. This stark contrast raises questions about the economic trajectories of these nations and the challenges they faced in adapting to a rapidly changing global economy.
The variation in GDP per capita also encapsulates the historical economic policies that shaped these countries. For instance, Scandinavian nations, known for their comprehensive welfare systems, managed to maintain high GDP figures while also prioritizing social equity. Conversely, the economic struggles of post-Soviet states highlighted the difficulties of transitioning from state control to free-market economies.
Regional Analysis
Examining the map, we can categorize Europe into distinct regions based on GDP per capita. In Western Europe, countries like Germany, France, and the Netherlands showed strong economic performance, with GDP per capita figures reflecting their industrial strengths and global trade ties. For instance, Germany's robust manufacturing sector contributed to a GDP per capita of around $24,000, positioning it as a powerhouse in the region.
In Southern Europe, nations such as Italy and Spain exhibited moderate GDP per capita figures, hovering around $18,000. This difference can be attributed to various factors, including economic dependence on tourism and agriculture, which are often more vulnerable to fluctuations in global markets.
In contrast, Eastern Europe presented a mixed picture. Countries like the Czech Republic and Hungary began showing signs of economic growth, with GDP per capita figures around $10,000 as they embraced reforms. However, countries such as Ukraine and Moldova lagged significantly behind, grappling with the remnants of a command economy and political instability, resulting in GDP per capita figures that were less than half of their Western counterparts.
Significance and Impact
Understanding GDP per capita in 1990 is crucial, as it helps contextualize the economic landscape of Europe at a transformative time. The disparities illustrated in this map are not merely historical curiosities; they resonate today, as many of these nations continue to evolve economically. Countries that faced significant challenges in the early 1990s have made notable strides, while others that thrived then must now navigate modern economic challenges.
What’s fascinating is how GDP per capita can influence policy decisions, social programs, and international relations. Nations with higher GDP per capita often have more resources to invest in education, healthcare, and infrastructure, fostering a cycle of growth and stability. Conversely, countries with lower figures may struggle to provide basic services, leading to social unrest and economic instability.
In terms of future projections, the trends we observe today, including increasing globalization and technological advancement, will undoubtedly shape the economic landscape of Europe in the coming decades. Nations must adapt to these changes, leveraging their unique strengths while addressing the disparities that persist from the past. The economic lessons learned from 1990 remain relevant, guiding policymakers and economists as they navigate the complexities of modern Europe.
Comments
Loading comments...