Global Economic Concentration Map

Alex Cartwright
Senior Cartographer & GIS Specialist
Alex Cartwright is a renowned cartographer and geographic information systems specialist with over 15 years of experience in spatial analysis and data...
Geographic Analysis
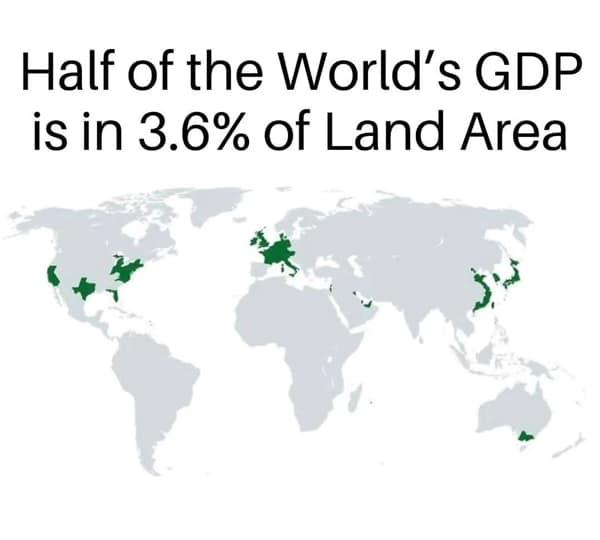
What This Map Shows
The "Global Economic Concentration Map" illustrates the distribution of economic activity across the globe, highlighting regions where wealth, industry, and commerce are concentrated. By analyzing GDP data, this map sheds light on economic hubs and disparities that exist between various countries and regions. Understanding the patterns displayed in this visualization is crucial for grasping the dynamics of global trade, investment, and economic development.
Deep Dive into Economic Concentration
Economic concentration refers to the way economic activities, resources, and wealth are distributed across different geographical areas. This visualization captures the essence of economic geography, revealing how certain areas, often urban centers, dominate in terms of economic output and financial power. For instance, cities like New York, Tokyo, and London serve as epicenters of global finance and trade, contributing disproportionately to their countries' GDP.
Interestingly, according to the International Monetary Fund (IMF), just ten countries account for over 70% of the world's GDP. This stark difference raises questions about resource allocation, economic inequality, and the opportunities available in less economically robust regions. Countries such as the United States, China, and Germany lead the pack, not only due to their population size but also thanks to their advanced infrastructure, technological innovation, and significant investments in education and workforce development.
Ever wondered why some regions thrive economically while others lag behind? Factors such as geography, political stability, access to markets, and natural resources play pivotal roles. For example, the concentration of skilled labor and technological firms in Silicon Valley has turned California into a global economic powerhouse. In contrast, parts of sub-Saharan Africa face challenges like inadequate infrastructure and political unrest that hinder economic growth.
Moreover, the map highlights the impact of globalization. As trade barriers have fallen and technology has advanced, economies have become increasingly interconnected. Cities that once operated independently are now linked through supply chains and corporate networks. This interconnectedness can be seen in the rise of megacities where population density and economic activities converge, creating vibrant economic landscapes but also significant challenges, such as urban sprawl and environmental degradation.
Regional Analysis
When we break down the map regionally, several patterns emerge. For instance, North America and Western Europe showcase high levels of economic concentration, with countries like the U.S., Canada, Germany, and France exhibiting some of the highest GDP per capita figures. These regions benefit from a robust service sector, advanced manufacturing capabilities, and strong infrastructure.
In contrast, regions such as South Asia and parts of Africa demonstrate lower levels of economic concentration. Despite having growing markets, these areas struggle with poverty and underemployment. For instance, India, with its booming tech industry, still faces significant economic disparities between urban and rural areas. Urban centers like Bangalore and Mumbai are experiencing rapid growth, while rural regions lag behind significantly.
Interestingly, emerging markets in East Asia, particularly Vietnam and Indonesia, are showing signs of increasing economic concentration. They are becoming attractive destinations for foreign investment, driven by a young workforce and improving infrastructure. This shift highlights the potential for economic growth in areas previously viewed as underdeveloped.
Significance and Impact
Understanding global economic concentration is vital for policymakers, businesses, and everyday citizens alike. The implications of economic concentration extend beyond mere statistics; they affect job creation, income distribution, and social equity. For instance, regions with concentrated wealth often have better access to education and healthcare, leading to a cycle of prosperity that can be difficult to break for less advantaged areas.
As globalization continues to evolve, future projections suggest that economic concentration may shift. With advancements in technology and changes in consumer behavior, we might see the rise of new economic centers that could challenge traditional powerhouses. Interestingly, the COVID-19 pandemic has also prompted many companies to reconsider their global strategies, potentially leading to a decoupling of some economies.
In conclusion, the "Global Economic Concentration Map" not only visualizes where economic power lies but also prompts us to think critically about the forces shaping our world. As we look to the future, understanding these dynamics will be crucial for fostering equitable growth and sustainable development globally.
Visualization Details
- Published
- September 19, 2025
- Views
- 42
Comments
Loading comments...