GDP Ranking Map of US States

Marcus Rodriguez
Historical Geography Expert
Marcus Rodriguez specializes in historical cartography and geographic data analysis. With a background in both history and geography, he brings unique...
Geographic Analysis
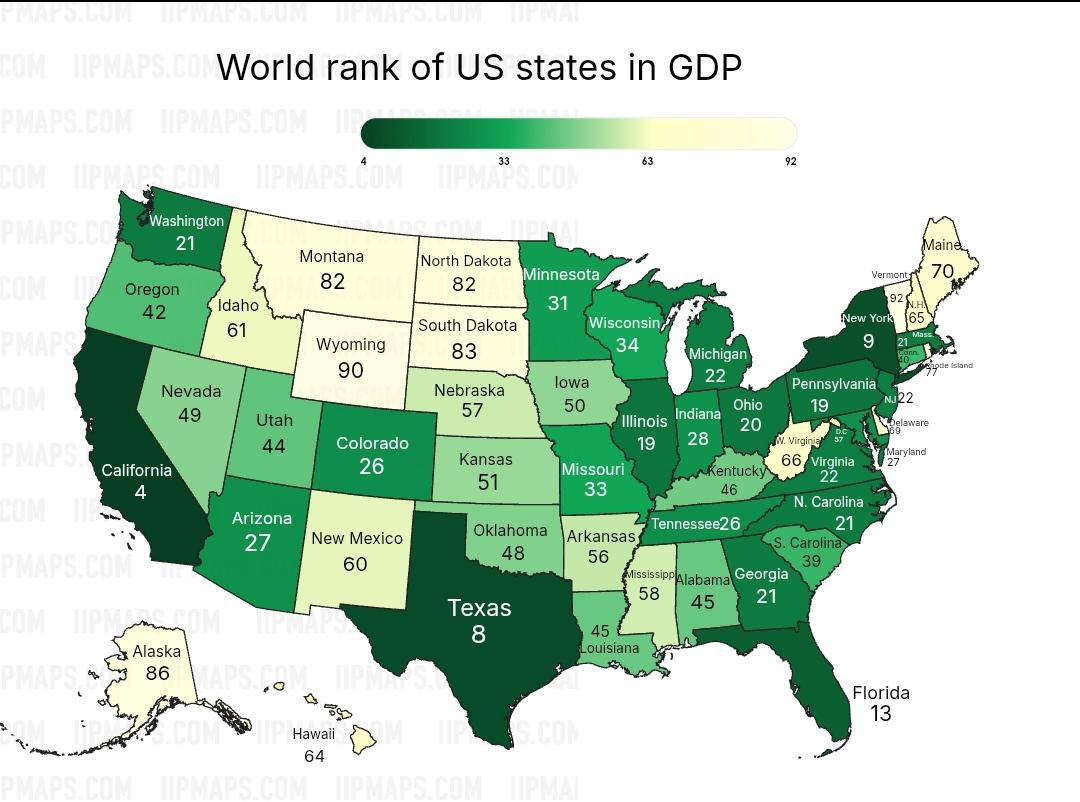
What This Map Shows
The GDP Ranking Map of US States visually represents the economic output of each state, showcasing their Gross Domestic Product (GDP) in relation to one another. This visualization is a powerful tool for understanding the economic landscape of the United States, revealing which states are leading the charge in terms of economic productivity and which ones are lagging behind. By examining this map, one can quickly discern how the economic power is distributed across the country, highlighting both the strengths and vulnerabilities of different regions.
Deep Dive into GDP
Gross Domestic Product (GDP) is an essential measure of a country's economic performance, representing the total value of all goods and services produced over a specific time period. In the context of US states, GDP not only reflects the economic activity within each state but also indicates the overall health of the national economy. Interestingly, GDP can be influenced by several factors, including natural resources, industrial capacity, population size, and technological advancement.
For instance, California stands out as the largest state economy in the US, boasting a GDP that rivals that of entire countries. In 2022, California’s GDP was approximately $3.6 trillion, making it the fifth-largest economy in the world. Its robust tech industry, particularly in Silicon Valley, significantly contributes to this figure, illustrating how innovation can drive economic growth. On the other hand, states like Wyoming and Vermont, with smaller populations and less industrialization, have GDPs that are considerably lower, yet they may excel in specific sectors such as agriculture or tourism.
Moreover, GDP can paint a vivid picture of economic inequality within the nation. States like New York and Texas not only have high GDPs but also host major financial and energy markets, respectively. However, states that rely heavily on agriculture or extraction industries may face challenges in diversifying their economies, which can impact their GDP growth. For example, West Virginia has a high reliance on coal mining, and as the demand for coal has declined, so has its GDP growth, illustrating the importance of economic diversification.
Regional Analysis
When analyzing the GDP ranking map, we can categorize the states into distinct regions: the Northeast, Midwest, South, and West. Each region presents unique economic characteristics that contribute to their GDP rankings.
- **Northeast**: This region is home to some of the wealthiest states, such as New York and Massachusetts. New York, with its immense financial services sector centered in New York City, significantly boosts its GDP. Massachusetts excels in education and technology, housing prestigious institutions like Harvard and MIT, which foster innovation and attract investments.
- **Midwest**: States like Illinois and Michigan show strong manufacturing bases, historically contributing to their economic output. Chicago, as a central hub for finance and commerce, plays a pivotal role in Illinois' GDP. However, some Midwestern states have faced economic downturns due to the decline of traditional manufacturing jobs, prompting a push for economic revitalization.
- **South**: Texas leads this region with a GDP that reflects its diversified economy, including technology, oil, and agriculture. Florida also shines with its tourism sector, drawing millions of visitors annually. Conversely, states like Mississippi and Arkansas struggle with lower GDPs, often due to challenges such as poverty and limited industrial growth.
- **West**: The West showcases a mix of high GDP states like California and lower-ranking ones like Idaho. California’s tech-driven economy stands in stark contrast to more rural states that may focus on agriculture or natural resources. Interestingly, the economic growth in the West has been significantly fueled by the technology sector, attracting a younger, more skilled workforce.
Significance and Impact
Understanding the GDP rankings of US states is crucial for several reasons. Firstly, it provides insight into economic health and growth potential, helping policymakers make informed decisions about resource allocation and investment. For businesses, this data can guide strategic planning and expansion, highlighting areas of opportunity or risk.
Furthermore, the disparities in GDP among states can inform discussions about economic inequality and the need for targeted support in struggling regions. As we face challenges like climate change and technological disruption, regions with lower GDPs may require additional resources to adapt and thrive in a rapidly changing economy.
Looking forward, it will be interesting to monitor how emerging industries, such as renewable energy and biotechnology, influence these rankings. States that invest in innovation and education may see substantial GDP growth, while those that remain reliant on traditional industries could face stagnation. Ever wondered how these shifts will reshape the map of economic power in the US? As we continue to navigate these changes, the GDP rankings will undoubtedly remain a vital indicator of our nation’s economic landscape.
Visualization Details
- Published
- August 19, 2025
- Views
- 108
- Tags
Comments
Loading comments...