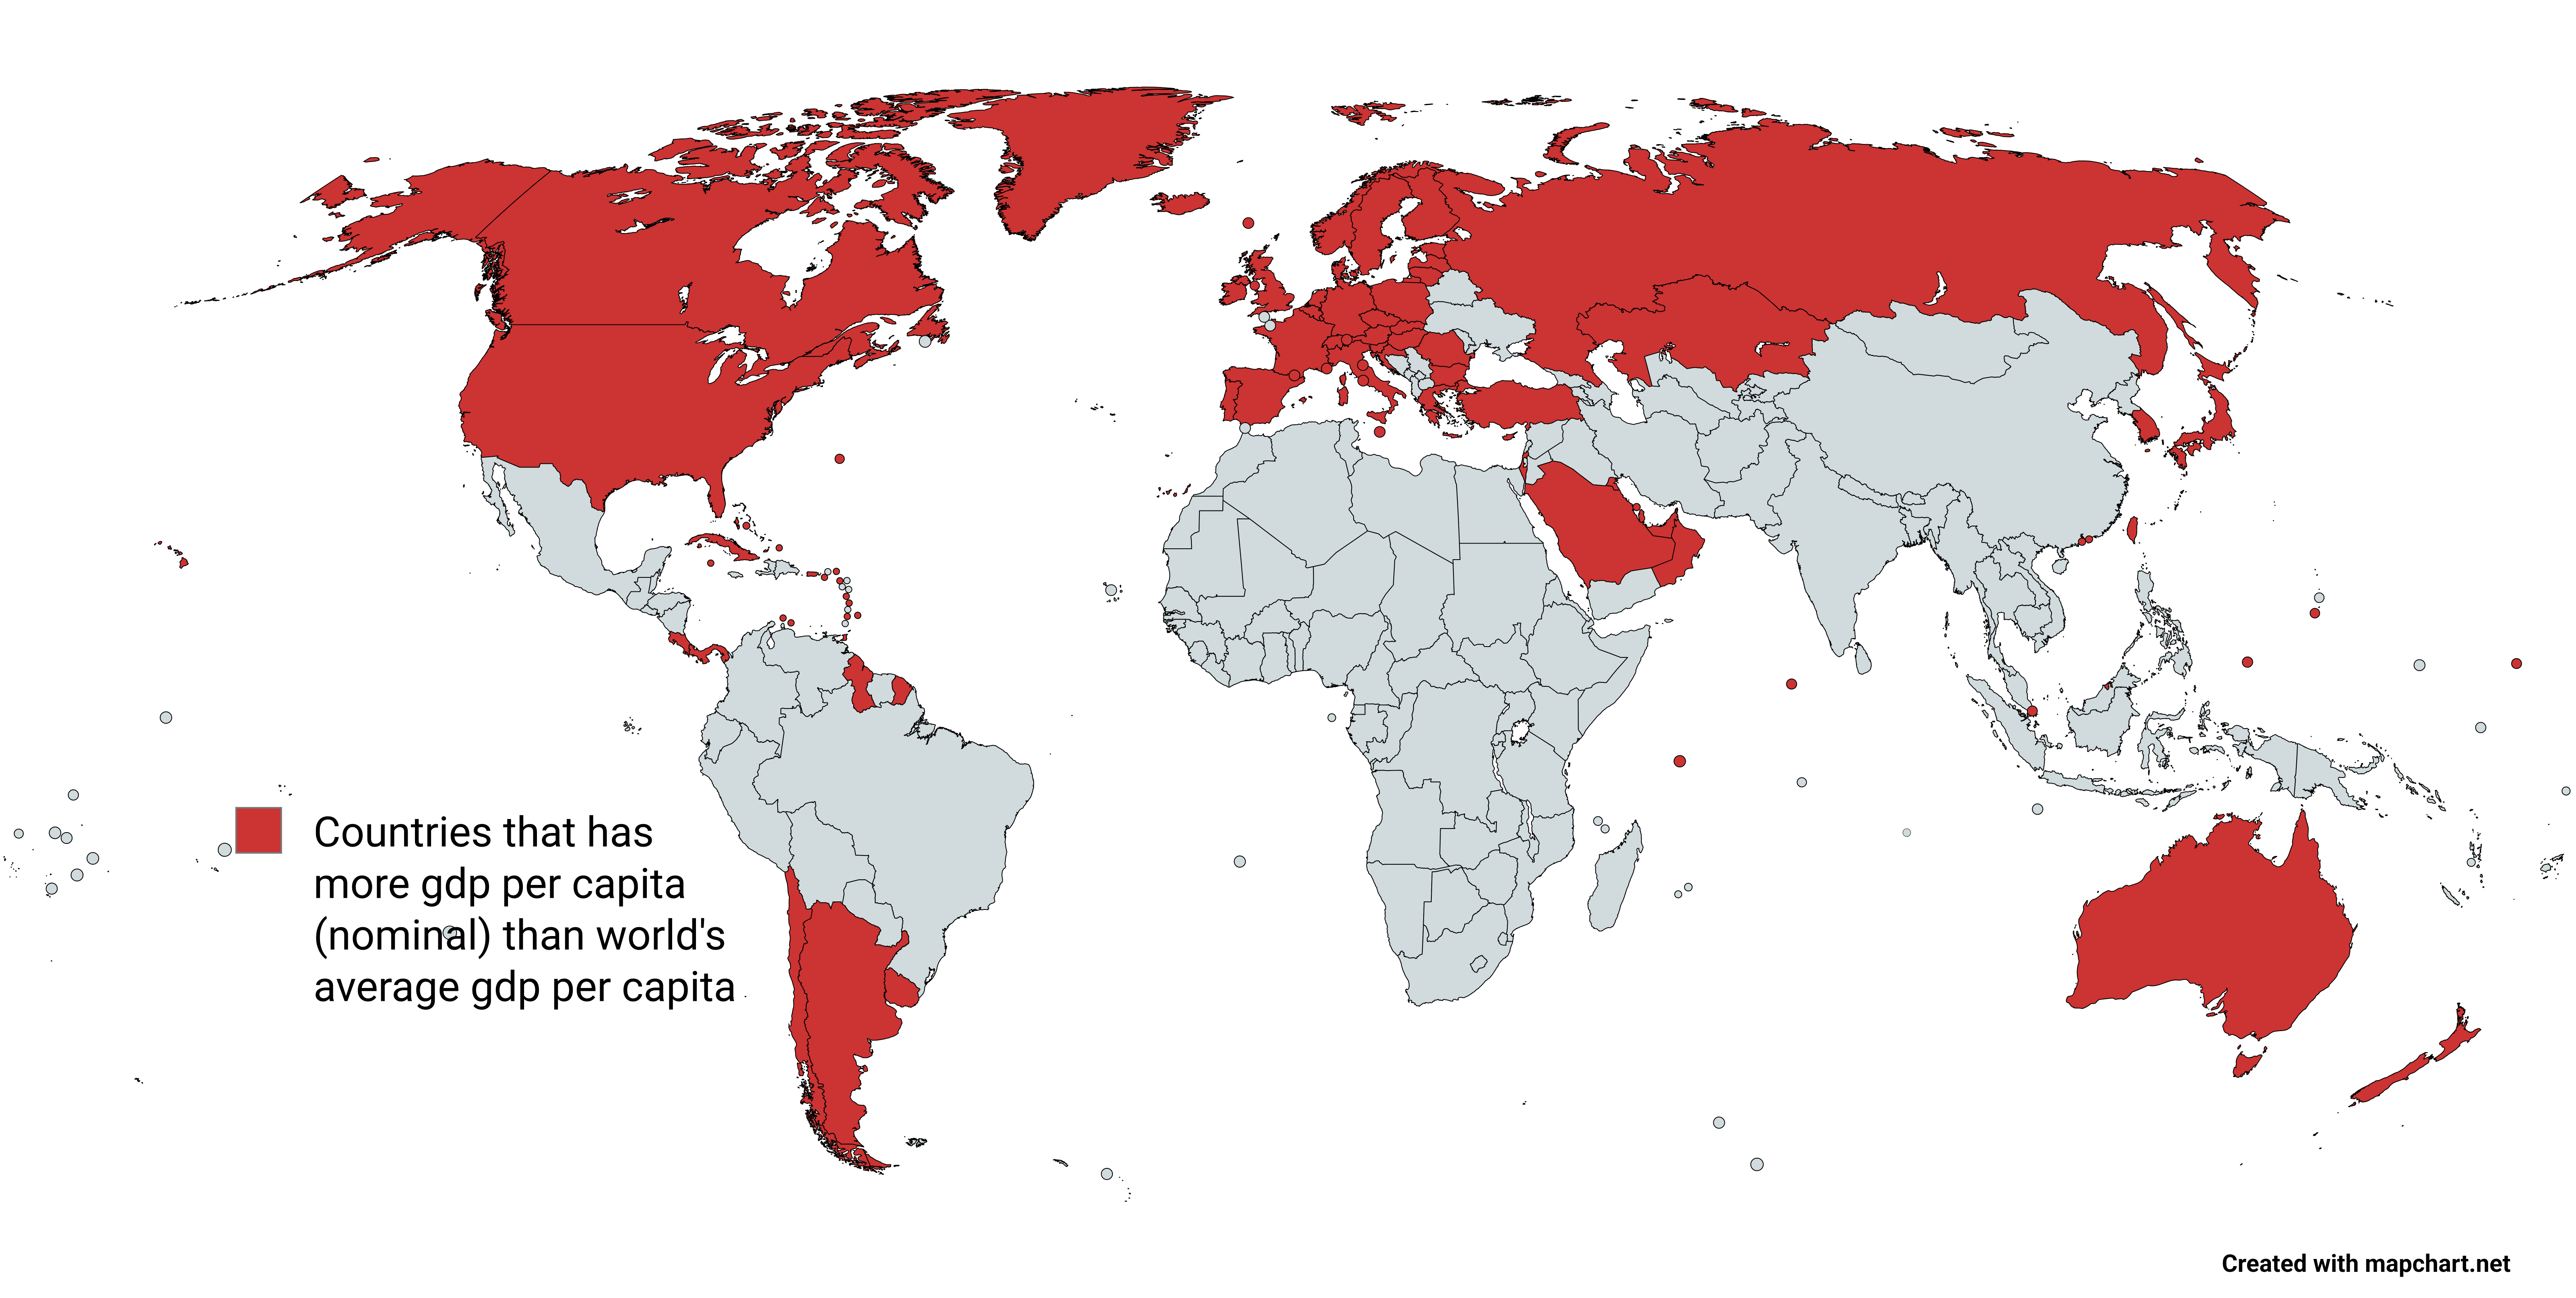
GDP Per Capita by Country Map


David Chen
Data Visualization Specialist
David Chen is an expert in transforming complex geographic datasets into compelling visual narratives. He combines his background in computer science ...
Geographic Analysis
What This Map Shows
This map provides a clear visual representation of the countries with a GDP per capita exceeding the world’s average, which is set at approximately $14,000. It highlights the economic disparities around the globe, showcasing nations that have successfully elevated their per capita income above this benchmark. By analyzing these countries, we can glean insights into their economic structures, growth strategies, and overall living standards.
Deep Dive into GDP Per Capita
GDP per capita is a crucial indicator of a country's economic health and the standard of living of its residents. It is calculated by dividing the country's gross domestic product by its population, offering a snapshot of the average income earned by citizens. Interestingly, a higher GDP per capita often correlates with better access to education, healthcare, and overall quality of life.
Countries that surpass the $14,000 mark tend to exhibit certain characteristics. For instance, many of these nations are industrialized or have robust service sectors, such as finance, technology, and tourism. Countries like the United States, Germany, and Australia feature prominently on this list, benefiting from advanced infrastructures, innovation, and stable political environments that attract investment.
However, it’s important to recognize that GDP per capita doesn’t tell the whole story. For example, countries like Qatar and Luxembourg boast incredibly high per capita figures due to their small populations and substantial natural resources. Qatar's economy, heavily reliant on oil and natural gas exports, results in a skewed GDP per capita that may not reflect the distribution of wealth among its citizens. In contrast, countries like Japan and Switzerland achieve high per capita income through a combination of technological advancement and a highly skilled workforce.
Interestingly, the map also highlights emerging economies that are rapidly climbing the ladder. Nations such as Chile and Poland have made impressive strides in increasing their GDP per capita, largely thanks to economic reforms and integration into global markets. These examples illustrate how economic policies and globalization can foster growth, enabling countries to provide better living standards for their populations.
Regional Analysis
When we dissect this map by region, intriguing patterns emerge. In North America, the United States and Canada dominate with high GDP per capita figures, driven by diverse economies and high living standards. Meanwhile, Mexico, although experiencing growth, lags behind significantly due to a combination of factors, including income inequality and varying economic development across regions.
In Europe, Western countries like Germany, France, and the Scandinavian nations consistently rank high in GDP per capita. These countries benefit from well-established social safety nets, strong education systems, and technological innovation. In contrast, Eastern European nations are increasingly closing the gap, with countries like Estonia and the Czech Republic showing significant growth and improvement in living standards.
In Asia, the story is more varied. Japan leads the region with a high GDP per capita, while countries like China and India are on the rise but still fall below the global average. The rapid industrialization and urbanization in these nations are contributing to economic growth, but challenges such as income disparity and environmental sustainability remain critical issues that need addressing.
Significance and Impact
Understanding GDP per capita is not just an academic exercise; it has real-world implications. Higher GDP per capita often correlates with better healthcare, education, and social stability. Countries with low GDPs face significant challenges, including poverty, limited access to resources, and political instability.
As we look toward the future, the global economy continues to evolve. The COVID-19 pandemic has disrupted many economies, leading to shifts in GDP figures worldwide. Interestingly, some countries have shown resilience and adaptability in their economic strategies, while others have struggled to recover. Projections indicate that as economies recover, we may see shifts in which countries appear on this map, emphasizing the importance of ongoing economic policies and global cooperation.
In conclusion, this map is more than just a visual representation; it encapsulates the economic realities of our world today. By analyzing GDP per capita, we can better understand the complexities of global economics and the various factors that contribute to a nation’s wealth.
Visualization Details
- Published
- August 15, 2025
- Views
- 126
Comments
Loading comments...