Italian Yearly Income Per Capita by Municipality Map

Alex Cartwright
Senior Cartographer & GIS Specialist
Alex Cartwright is a renowned cartographer and geographic information systems specialist with over 15 years of experience in spatial analysis and data...
Geographic Analysis
What This Map Shows
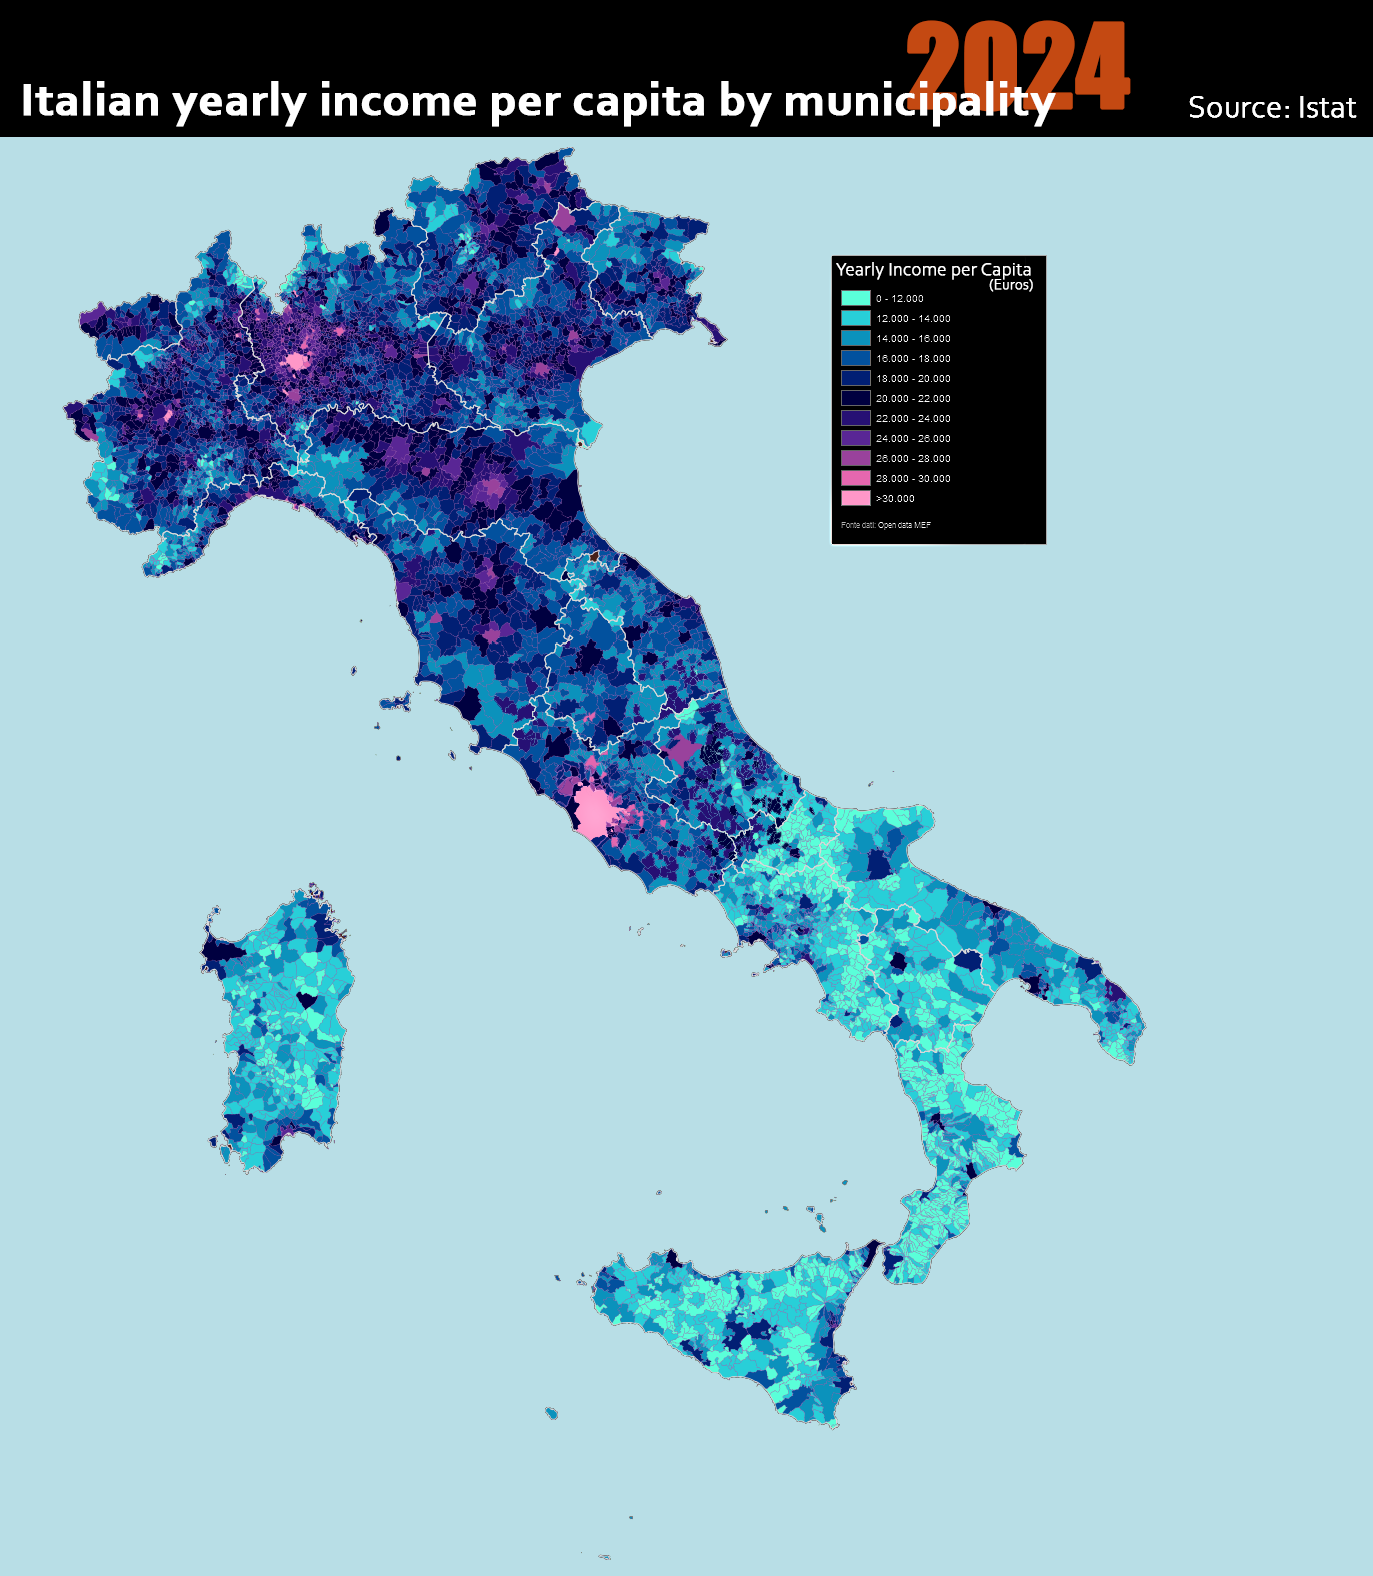
The "Italian Yearly Income per Capita by Municipality 2024" map provides an insightful look into the economic landscape of Italy, illustrating the average income per individual across various municipalities throughout the country. By utilizing a color-coded system, this visualization allows viewers to quickly identify areas of high and low income, highlighting economic disparities at a granular level. Understanding income distribution is crucial for grasping the broader socioeconomic trends affecting Italian society.
Deep Dive into Income Distribution in Italy
Income per capita is a valuable measure for assessing the economic health of a region. It represents the average income earned by each person in a given area and is often used to gauge the standard of living. In Italy, this metric varies significantly from one municipality to another, influenced by factors such as industrialization, tourism, local policies, and demographic trends.
Interestingly, northern regions of Italy generally report higher incomes than southern areas. For instance, municipalities in Lombardy, such as Milan, showcase some of the highest per capita incomes, attributed to their robust financial and industrial sectors. Conversely, areas in regions like Calabria or Sicily often report much lower income levels, reflecting both historical economic challenges and ongoing issues related to employment and investment.
Moreover, income inequality is a pressing concern in Italy. The Gini coefficient, which measures income distribution, has shown that while some municipalities thrive, others lag significantly behind. These disparities can lead to social tension and economic stagnation in lower-income areas. Have you noticed that economic opportunities often seem to cluster in urban centers? Cities like Rome and Florence not only attract tourists but also provide a diverse job market, which can elevate average incomes.
Another fascinating aspect is the impact of tourism. Regions heavily reliant on tourism, such as Venice or the Amalfi Coast, may exhibit inflated income levels during peak seasons. However, this income can be misleading; it often doesn’t translate into sustainable economic growth for local residents, as many jobs in this sector are seasonal and may not provide year-round stability.
Regional Analysis
Taking a closer look at the map, the income levels reveal stark contrasts between different regions of Italy. For example, the northern municipalities of Trentino-Alto Adige region, famed for its stunning landscapes and high quality of life, report high income per capita figures, reflecting both a thriving tourism sector and a strong industrial base. In contrast, the southern regions, such as Campania and Puglia, struggle economically, with average incomes significantly lower than the national average.
The map clearly illustrates the economic divide: while municipalities in Emilia-Romagna, known for its agricultural output and manufacturing prowess, show healthy income levels, areas in the south face persistent economic challenges. Interestingly, some southern municipalities have seen a rise in income due to revitalization efforts and investment in local industries, but these changes are gradual and often overshadowed by historical economic issues.
Significance and Impact
Why does understanding income per capita matter? For policymakers, this data is essential for crafting targeted economic strategies that address the needs of different areas. Regions with lower incomes may require more investment in infrastructure, education, and job creation initiatives. Furthermore, as Italy navigates through economic recovery post-pandemic, having a clear picture of income distribution can help in devising effective recovery plans that ensure equitable growth.
Moreover, as we look toward the future, income trends can serve as predictors for broader societal changes. For example, increased income levels in certain municipalities could lead to higher property values and changes in demographic profiles, as more affluent residents move in. Conversely, stagnant income in others might indicate growing social issues, such as emigration or declining population.
In conclusion, the "Italian Yearly Income per Capita by Municipality 2024" map is not just a visualization of numbers; it is a reflection of Italy's economic landscape and the challenges its regions face. As we continue to monitor these trends, it remains crucial to foster economic policies that promote growth and equity across all municipalities, ensuring that every Italian citizen can enjoy the benefits of a thriving economy.
Visualization Details
- Published
- October 2, 2025
- Views
- 54
Comments
Loading comments...