
Marcus Rodriguez
Historical Geography Expert
Marcus Rodriguez specializes in historical cartography and geographic data analysis. With a background in both history and geography, he brings unique...
Geographic Analysis
What This Map Shows
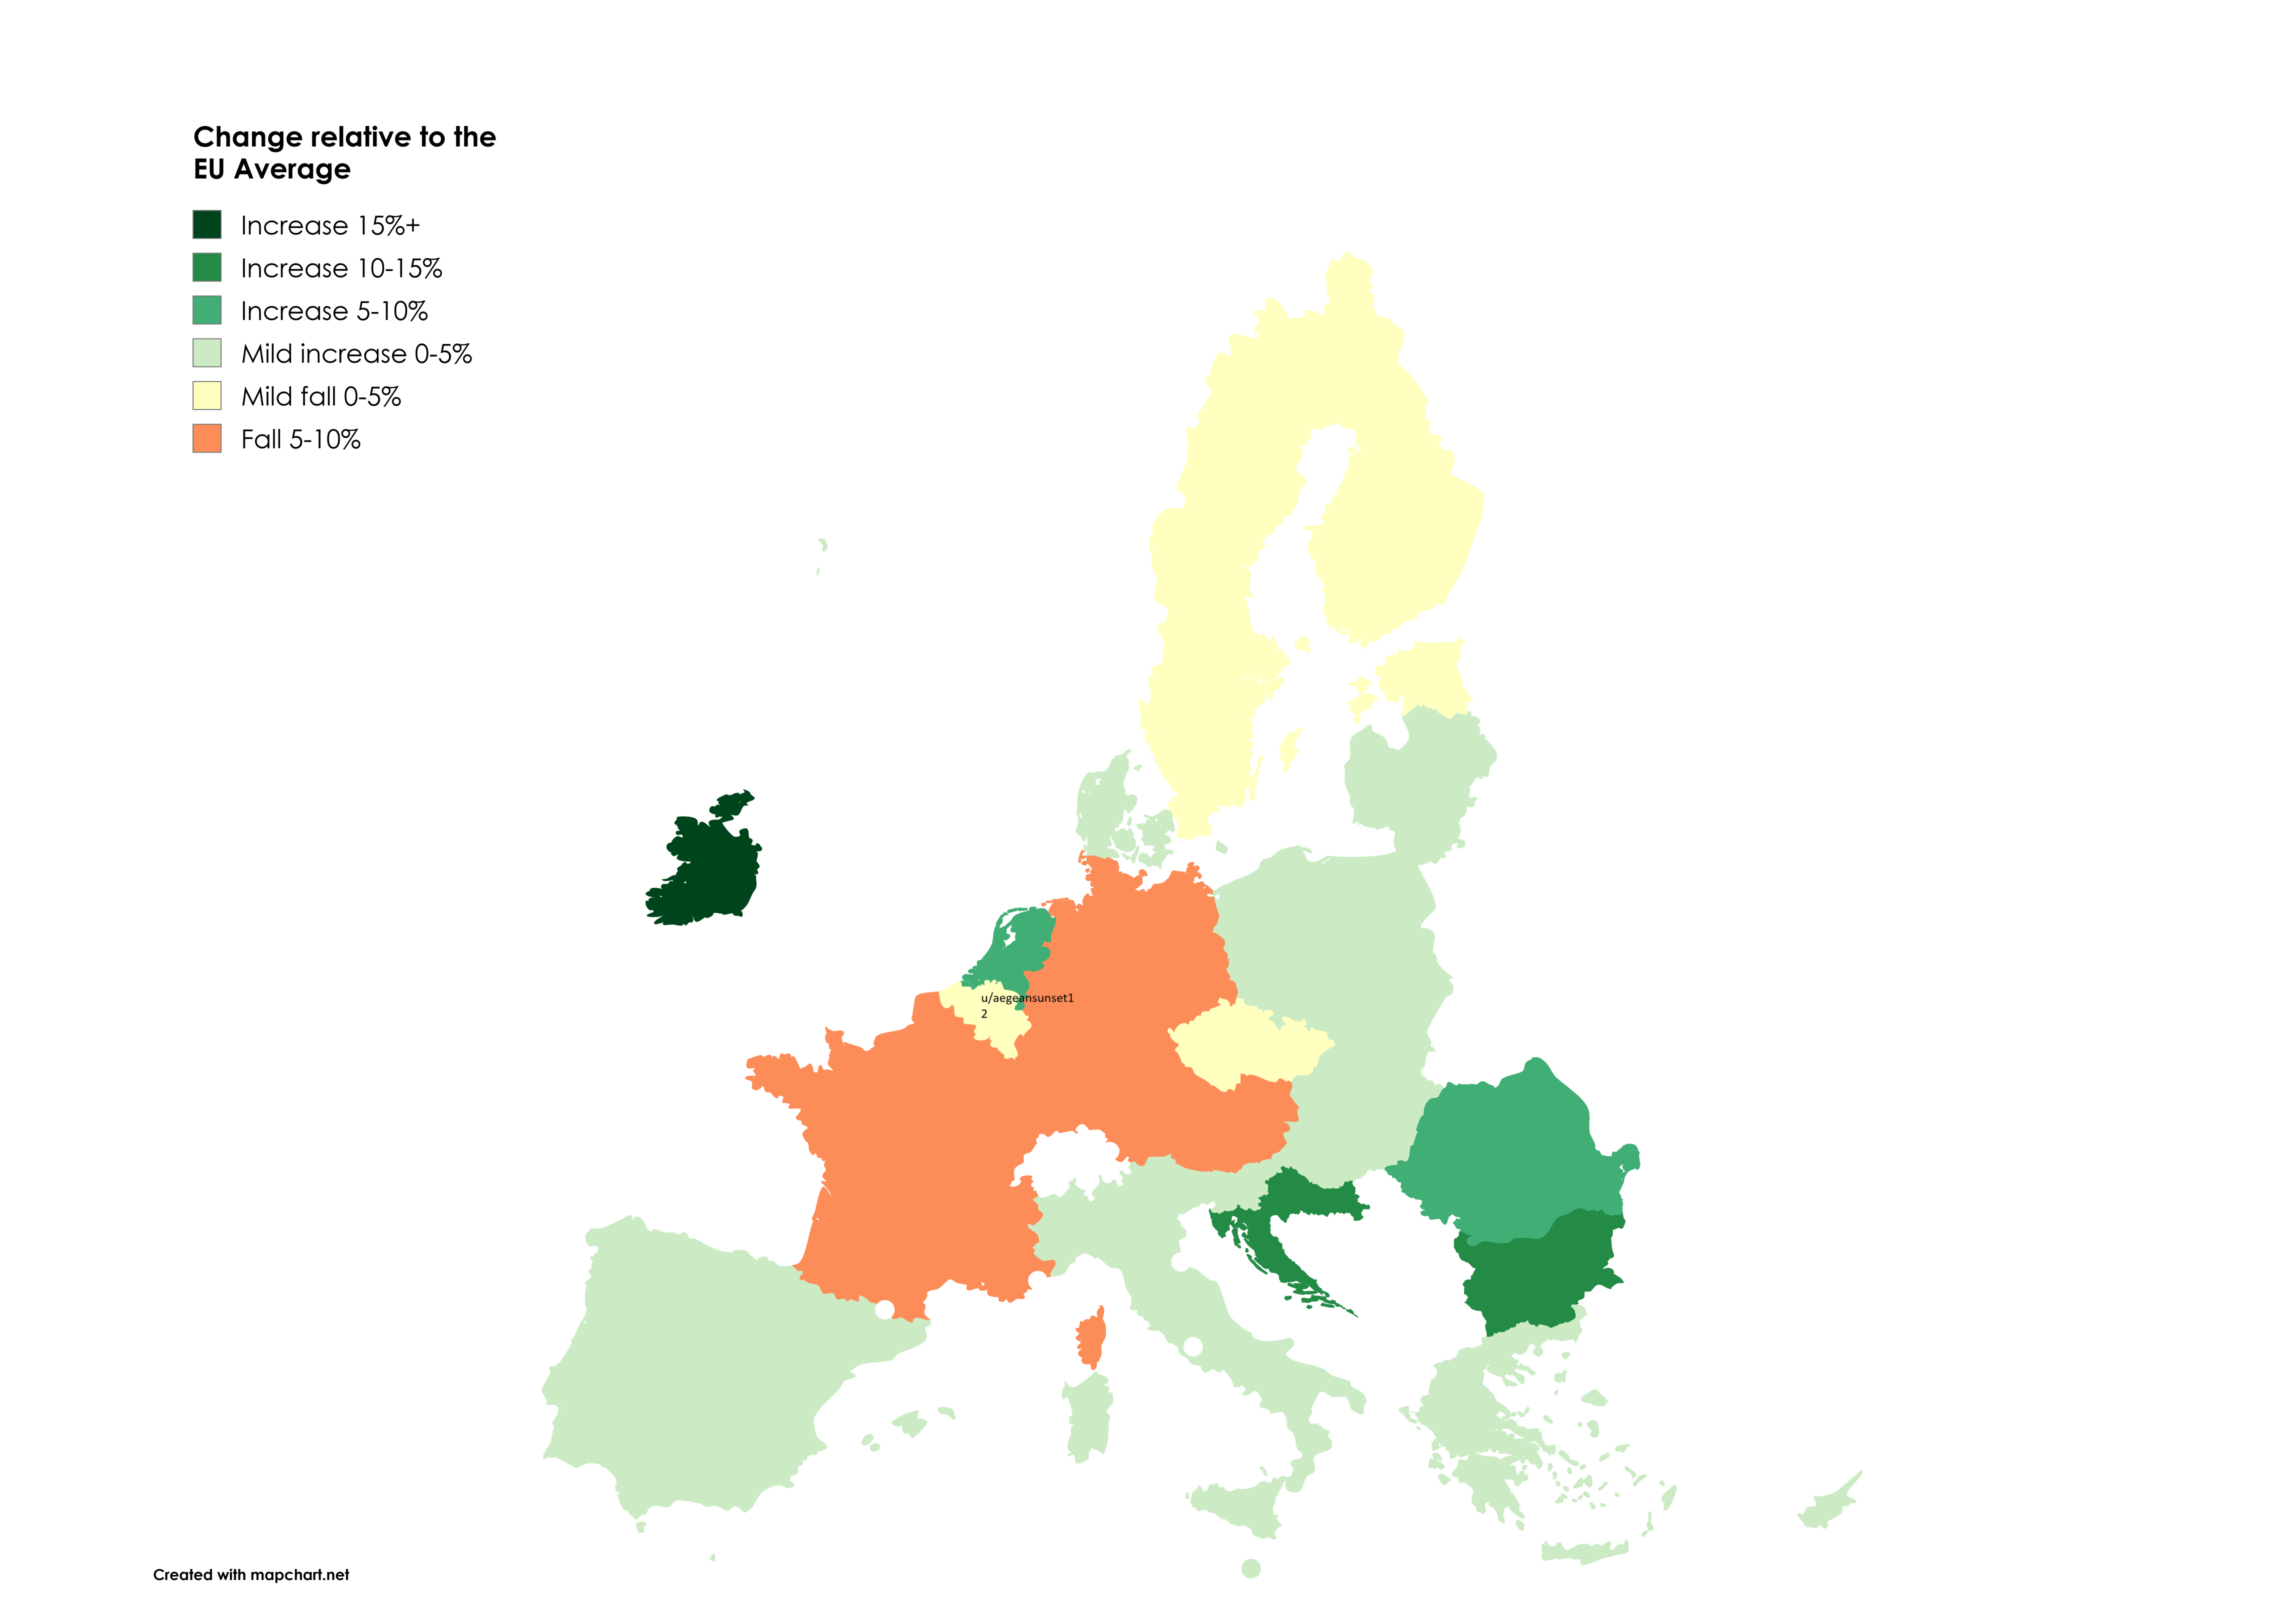
The visualization titled "Europe in Flux: How COVID, Inflation, and War Reshaped GDP Per Capita vs EU Average (2019-2024)" offers a compelling snapshot of the economic landscape of Europe over a pivotal five-year period. By comparing GDP per capita across various European nations against the EU average, this map highlights significant shifts influenced by key global events, including the COVID-19 pandemic, inflationary pressures, and geopolitical conflicts such as the war in Ukraine. Through this lens, we can better understand the resilience and vulnerabilities of different economies within the continent.
Deep Dive into GDP Per Capita
Gross Domestic Product (GDP) per capita is a crucial economic indicator that reflects a country's economic performance relative to its population. It serves as a vital tool for comparing economic health across nations. In the context of Europe, GDP per capita offers insights into not just economic prosperity but also living standards and quality of life.
Interestingly, the period from 2019 to 2024 has been marked by unprecedented challenges. The COVID-19 pandemic led to a dramatic contraction in economic activity across Europe in 2020. Many countries saw their GDP per capita plummet, with tourism-dependent economies hit the hardest. For instance, nations like Spain and Italy, which heavily rely on tourism, experienced significant declines, with GDP per capita dropping by as much as 10-15% in some areas during the height of the pandemic.
However, as countries adapted to the new normal, the recovery phase began. By 2021 and 2022, many economies started to bounce back, bolstered by fiscal stimulus measures and the gradual reopening of businesses. Yet, even as recovery took hold, inflation emerged as a new threat, exacerbated by supply chain disruptions and rising energy prices, particularly following the onset of the war in Ukraine in 2022. The resultant inflationary environment has meant that even as GDP figures showed improvement, real purchasing power for many citizens has stagnated or even regressed.
As we look to 2024, projections indicate a more complex picture. Northern European countries, such as Germany and the Scandinavian nations, generally exhibit higher GDP per capita figures compared to their southern and eastern counterparts. However, nations like Poland and Hungary have shown remarkable resilience, with GDP growth rates outpacing the EU average in many instances, despite facing their own sets of challenges.
Regional Analysis
When examining the map more closely, regional disparities become evident. Western Europe, including countries like Luxembourg, Switzerland, and the Netherlands, consistently ranks above the EU average in GDP per capita. Luxembourg, for instance, boasts one of the highest figures globally, driven by its robust financial services sector.
Conversely, southern European nations often lag behind. Countries such as Greece and Portugal have struggled to recover fully from the economic impacts of the previous decade, compounded by the recent crises. Greece, while showing signs of recovery, still has a GDP per capita significantly below the EU average.
Eastern Europe presents a mixed picture. Nations like Estonia and Lithuania have made significant strides in recent years, often exceeding the EU average, thanks to booming tech sectors and foreign investments. However, countries like Bulgaria and Romania remain more vulnerable, grappling with lower economic outputs and higher levels of poverty.
Interestingly, the map also highlights the impact of political stability on economic performance. Countries with stable governments and sound economic policies tend to have higher GDP per capita compared to those facing political turmoil. For example, the war in Ukraine has not only affected Ukraine's economy but has also ripple effects in neighboring countries, leading to increased costs and economic uncertainty.
Significance and Impact
Understanding GDP per capita in relation to the EU average is crucial for several reasons. It not only reflects economic health but also social well-being. Higher GDP per capita often correlates with better healthcare, education, and living standards. As Europe continues to navigate the aftermath of COVID-19, inflation, and geopolitical tensions, monitoring these economic indicators will be vital for policymakers.
Moreover, the current trends highlight the importance of economic diversification. Countries that have relied heavily on a single sector—such as tourism or energy—are finding themselves more vulnerable in times of crisis. Future projections suggest that nations with diversified economies, robust digital infrastructure, and strong governance will be better positioned for sustainable growth.
In conclusion, the map serves as a vital resource for understanding the economic landscape of Europe from 2019 to 2024. As we move forward, keeping an eye on these shifts will be crucial for both individuals and governments in planning for a more resilient economic future.
Visualization Details
- Published
- August 13, 2025
- Views
- 122
Comments
Loading comments...