2024 Maps
2 geographic visualizations tagged with "2024"

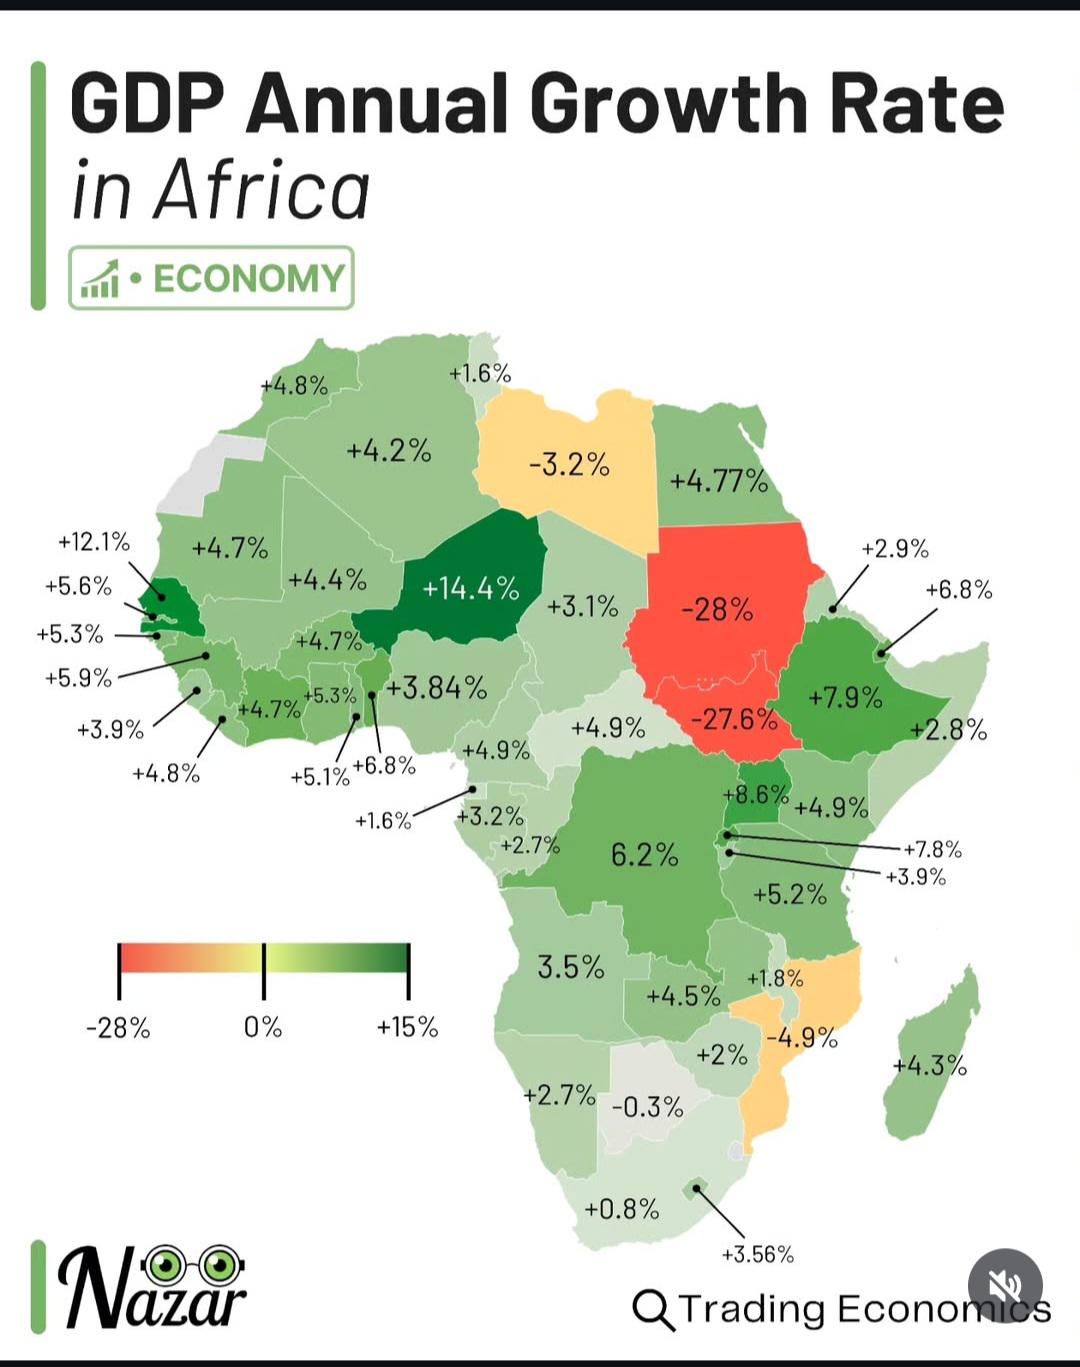
GDP Annual Growth Rate Map for 2024
The GDP Annual Growth Rate Map for 2024 illustrates the projected economic growth rates of various countries around the ...
👁 98📅 8/10/2025

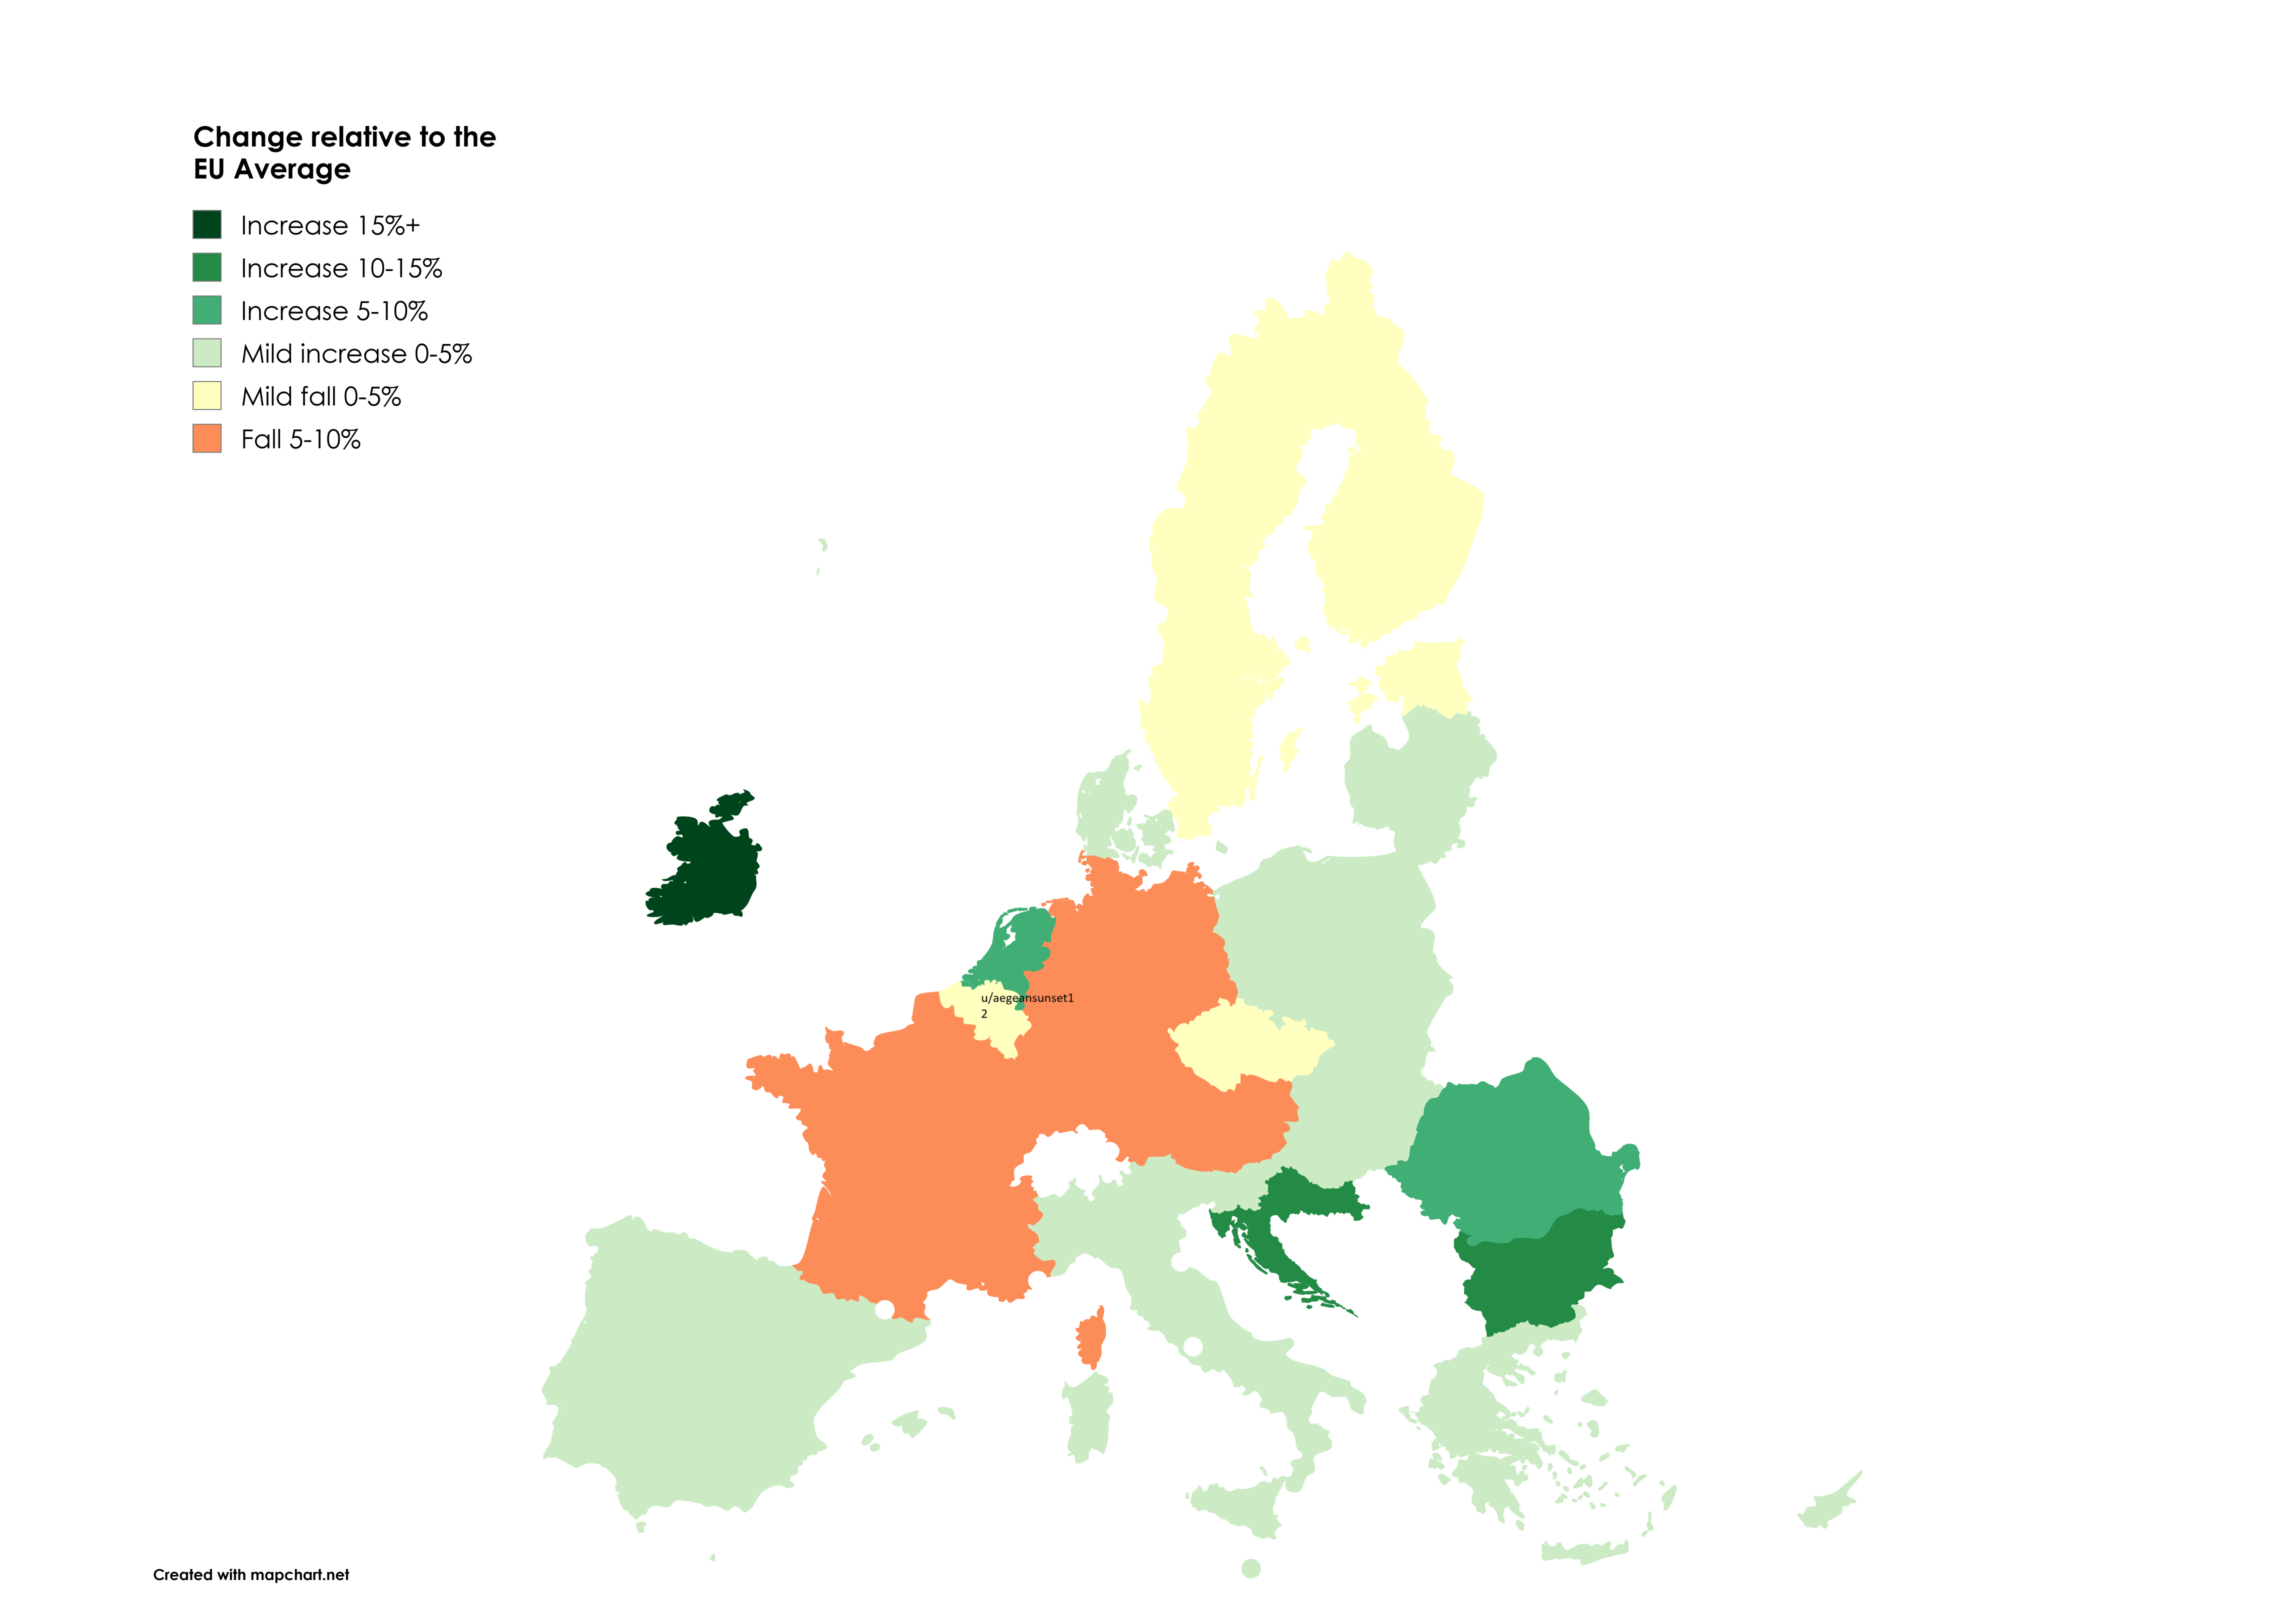
GDP Per Capita Compared to EU Average Map
The visualization titled "Europe in Flux: How COVID, Inflation, and War Reshaped GDP Per Capita vs EU Average (2019-2024...
👁 122📅 8/13/2025