1980 GDP Comparison Map: Countries Richer or Poorer Than China

Alex Cartwright
Senior Cartographer & GIS Specialist
Alex Cartwright is a renowned cartographer and geographic information systems specialist with over 15 years of experience in spatial analysis and data...
Geographic Analysis
What This Map Shows
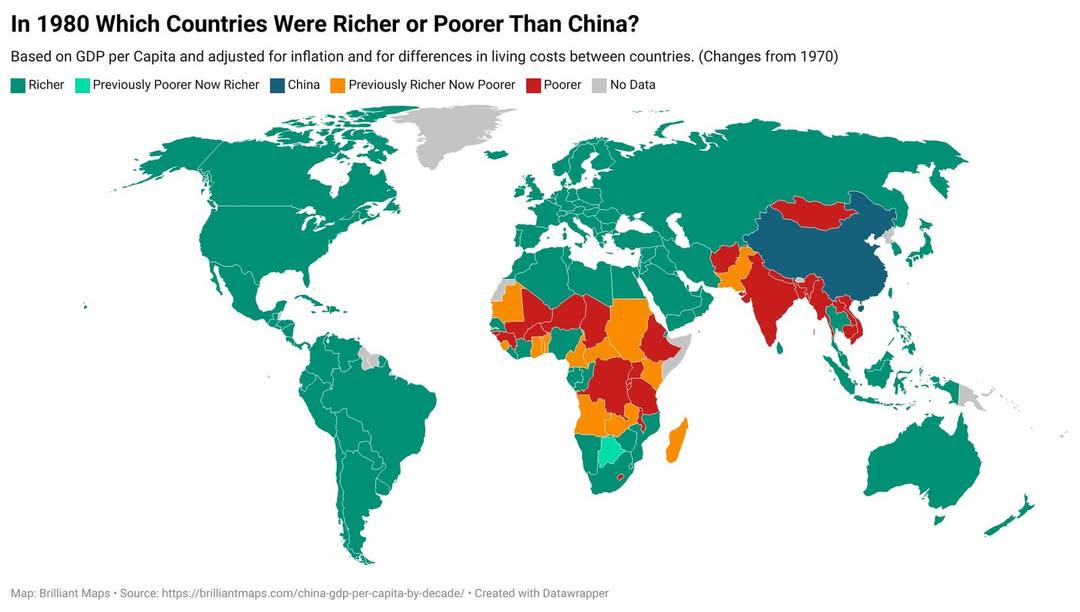
This visualization displays the GDP per capita of various countries in 1980, allowing us to see which nations were richer or poorer than China at that time. With China undergoing significant economic changes during this period, understanding its economic standing in comparison to other countries provides valuable insights into global economic dynamics. In 1980, China was transitioning from a centrally planned economy to one that embraced market reforms, but it still had a long way to go in terms of wealth generation.
Deep Dive into GDP and Economic Indicators
Gross Domestic Product (GDP) per capita is a crucial indicator of a country's economic performance and living standards. In 1980, China's GDP per capita was approximately $200, a stark contrast to wealthier nations like the United States, which boasted a GDP per capita of around $12,000. This discrepancy highlights the vast differences in economic development between China and more industrialized nations during the late 20th century.
Interestingly, GDP per capita doesn't just reflect economic output; it also showcases the distribution of wealth within a country. For instance, nations like Japan, which had a GDP per capita of about $7,500 in 1980, were reaping the benefits of post-war economic recovery and technological advancements. Meanwhile, many developing countries struggled with lower GDPs, often due to economic instability, lack of infrastructure, or colonial legacies.
In the context of developing nations, the 1980 GDP figures reveal a mixed bag. Countries in Africa, such as Ethiopia with a GDP per capita of approximately $100, were significantly poorer than China. In contrast, some countries in Southeast Asia, like Malaysia, were already on the path to rapid economic growth, with GDPs around $1,500. These variations show that economic development was not uniform across regions, and local factors played a significant role.
Regional Analysis
The map allows us to break down economic performance by region. In North America, the United States and Canada had GDPs that were substantially higher than China’s, reflecting their advanced industrial sectors and high standards of living. In Europe, countries like West Germany and France were also wealthier, showcasing the benefits of post-war recovery and integration into the global economy.
In contrast, many African nations were struggling economically in 1980. Countries like Sudan and Uganda had GDPs that were not only lower than China’s but were also indicative of political turmoil and conflict, which severely hindered economic development. In Latin America, countries like Brazil and Argentina had mixed economic outcomes, with Brazil nearing China’s GDP per capita, reflecting its industrial capabilities at the time.
Interestingly, Japan and the Asian Tigers (Hong Kong, Singapore, South Korea, and Taiwan) were already demonstrating the power of export-led growth strategies, which set the stage for the rapid economic transformation of these regions in the following decades. This regional analysis highlights that while China was beginning to emerge as a significant player, many of its neighbors were already reaping the rewards of different economic strategies.
Significance and Impact
Understanding the economic landscape of 1980 is essential for contextualizing China's subsequent rise as a global economic powerhouse. The comparison of GDP per capita between China and other countries illustrates how far China has come since then. The reforms initiated by Deng Xiaoping in 1978 paved the way for unprecedented economic growth, leading to a dramatic increase in GDP per capita over the next few decades.
This topic matters not just for historical understanding but also for current economic discussions. The path China took has influenced global trade dynamics and economic policies in developing nations. Moreover, reflecting on the past helps us to better understand current trends, such as emerging markets and the shifting balance of economic power that is increasingly favoring Asia.
As we observe contemporary economic ties and the lessons learned from this period, it’s clear that the world is interconnected. The evolution of China’s economy is a testament to the potential for growth in developing nations, which can inspire current and future strategies for economic development worldwide. Have you noticed how the economic narratives of countries change over time? The 1980 map serves as a reminder of just how quickly fortunes can change in the global economy.
Visualization Details
- Published
- August 27, 2025
- Views
- 86
Comments
Loading comments...