United States Real GDP Growth by State Map

David Chen
Data Visualization Specialist
David Chen is an expert in transforming complex geographic datasets into compelling visual narratives. He combines his background in computer science ...
Geographic Analysis
What This Map Shows
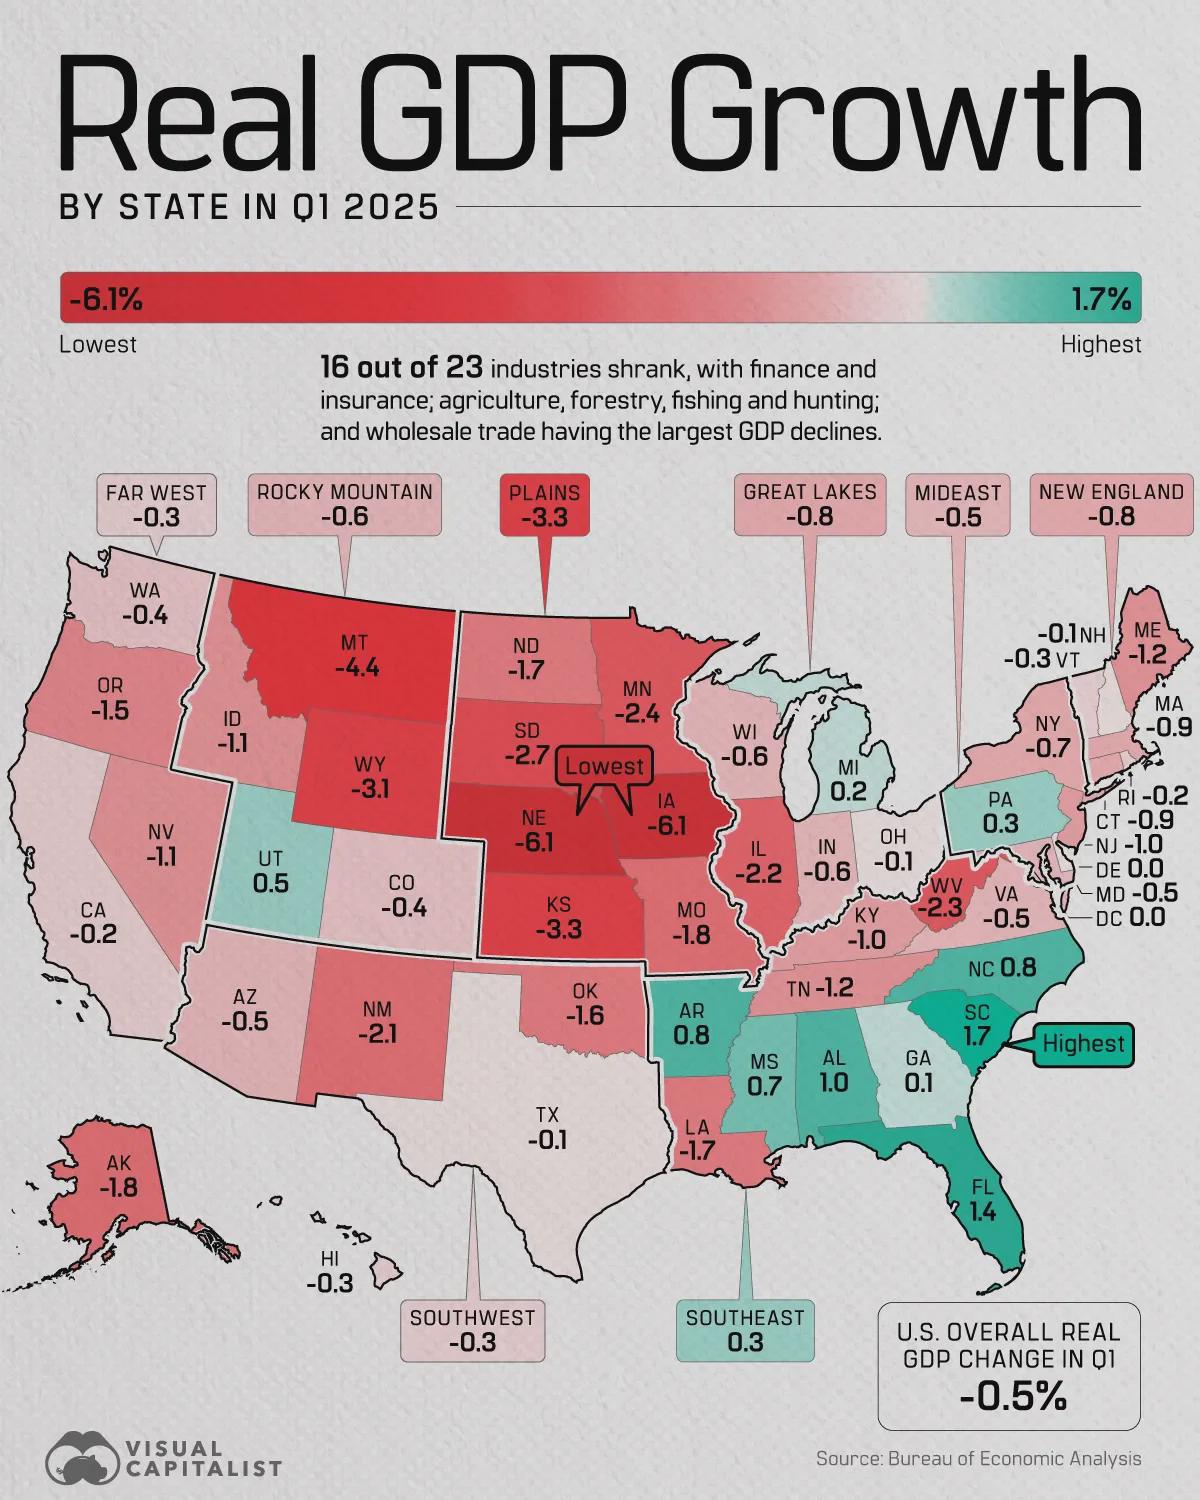
The "United States Real GDP Growth by State in Q1 2025" map visually represents the economic performance of each state in the U.S. during the first quarter of 2025. By showcasing the percentage growth of real Gross Domestic Product (GDP), this map provides valuable insights into how different states are faring economically. This is particularly important for understanding regional economic dynamics, identifying growth trends, and comparing economic health across states.
Transitioning now into the actual topic, we see that Gross Domestic Product (GDP) is a critical indicator of economic health. It's calculated as the total value of all goods and services produced over a specific time period, adjusted for inflation. Real GDP growth indicates how quickly an economy is expanding or contracting, which directly influences employment, investment, and overall living standards.
Deep Dive into Real GDP Growth
Real GDP growth is not just a number; it reflects the vitality of a state's economy. For instance, a state experiencing high GDP growth often sees new businesses emerging, job opportunities increasing, and higher consumer spending. This growth can stem from various sources, including technological advancements, a skilled workforce, or even natural resources.
Interestingly, GDP growth can vary widely between states due to several factors. For example, states like California and Texas, which boast large tech and energy sectors respectively, often report higher GDP growth rates compared to states with less diversified economies. In Q1 2025, we might anticipate that states heavily invested in technology, renewable energy, and healthcare will show impressive growth figures.
Additionally, economic policies and local governance play a pivotal role. States that foster business-friendly environments through tax incentives or infrastructure improvements tend to attract more investments, which can significantly boost GDP. Conversely, states with higher regulatory burdens or economic instability might struggle to maintain positive growth rates.
Demographic factors also influence GDP growth. A younger, more educated population is typically more innovative, driving economic advancement. On the other hand, states facing demographic challenges, like an aging population, may experience slower growth. For instance, states in the Midwest may see a stagnation in growth due to declining population levels and industries not adapting to modern economic trends.
Regional Analysis
Examining the map reveals distinct regional patterns in GDP growth across the United States. The West Coast, particularly California, is often a leader in economic growth, propelled by the tech industry’s dominance and high levels of investment in innovation. In Q1 2025, we might see California continuing to outperform other states, given the ongoing advancements in artificial intelligence and biotechnology.
The South, especially Texas and Florida, tends to demonstrate robust growth as well. Texas, with its booming energy sector and a favorable business climate, could report strong GDP figures, while Florida’s tourism and healthcare industries may also show resilience.
In contrast, the Northeast may present a mixed bag. States like New York and Massachusetts are usually strong performers due to their financial and educational sectors. However, regions heavily reliant on manufacturing, such as parts of the Rust Belt, might lag behind as they grapple with economic transitions and workforce challenges.
Significance and Impact
Understanding GDP growth by state is crucial for policymakers, businesses, and even individuals. For policymakers, GDP growth data helps in crafting effective economic strategies that can stimulate further growth and mitigate potential downturns. For businesses, knowing which states are prospering can influence decisions regarding expansion, investment, and resource allocation.
Moreover, the implications of these economic trends extend to everyday life. Higher GDP growth usually means better job prospects, increased wages, and improved public services. Conversely, states struggling with low or negative growth might face budget cuts, higher unemployment, and declining living conditions.
Looking ahead, the trends observed in Q1 2025 could set the stage for future economic policies and growth trajectories. As we move further into the 2020s, it will be fascinating to see how states adapt to evolving economic landscapes, especially in areas like technology, sustainability, and workforce development. Have you noticed how some states seem to bounce back quicker from economic downturns than others? It often boils down to strategic planning and the ability to innovate in a rapidly changing world.
Visualization Details
- Published
- September 7, 2025
- Views
- 94
Comments
Loading comments...