Debt-to-GDP Ratios in Europe Map

Alex Cartwright
Senior Cartographer & GIS Specialist
Alex Cartwright is a renowned cartographer and geographic information systems specialist with over 15 years of experience in spatial analysis and data...
Geographic Analysis
What This Map Shows
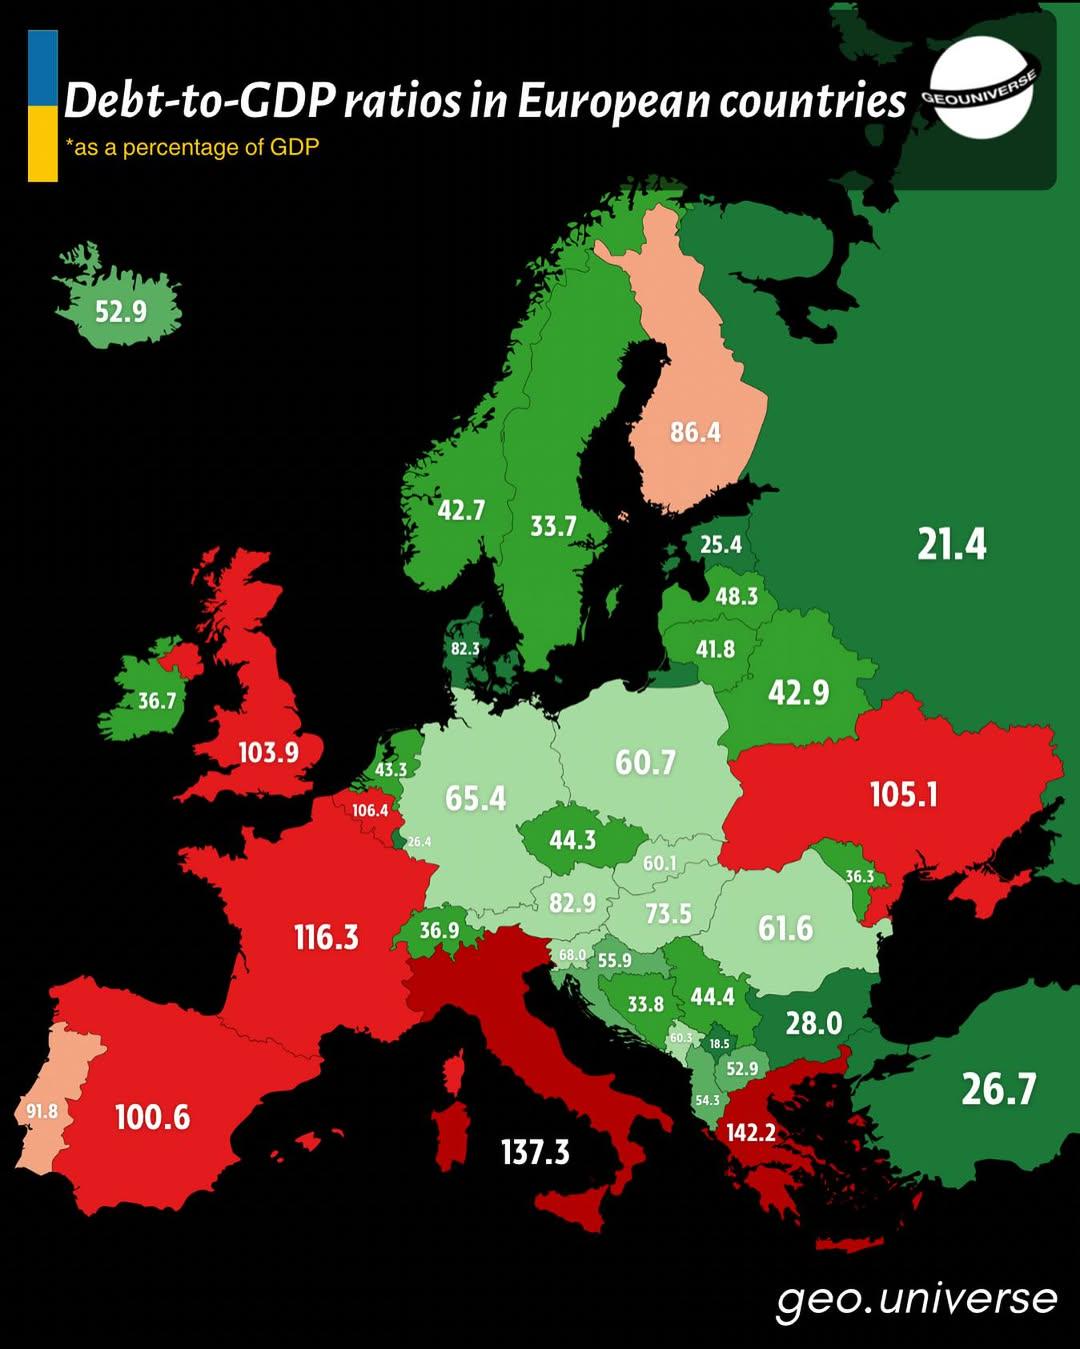
The "Debt-to-GDP Ratios in Europe (2025)" map provides a comprehensive overview of the economic health of European nations by illustrating the ratio of each country’s public debt to its gross domestic product (GDP). This visualization offers insights into how much debt a country carries in relation to its economic output, which is a critical indicator of fiscal stability and economic performance. As we delve into this important topic, we will explore the implications of these ratios and how they reflect the broader economic landscape of Europe.
Deep Dive into Debt-to-GDP Ratios
Debt-to-GDP ratio is an essential metric for understanding a country's fiscal health. It is calculated by dividing a nation's total debt by its GDP, expressed as a percentage. A higher ratio may indicate that a country has taken on too much debt relative to its economic size, which can lead to concerns about default and long-term sustainability. Conversely, a lower ratio suggests a healthier balance where the economy can comfortably manage its debts.
Interestingly, the global average debt-to-GDP ratio has been on the rise, primarily due to the economic fallout from the COVID-19 pandemic. As countries implemented extensive fiscal measures to support their economies, many saw their debt levels soar. In Europe, the implications of these rising ratios are particularly pronounced given the diverse economic conditions across the continent. For instance, countries like Greece and Italy have historically struggled with high debt levels, while nations like Germany and Sweden have maintained more favorable ratios.
What’s fascinating is the variation in these ratios across the European Union. In 2025, countries such as Greece are projected to have some of the highest debt-to-GDP ratios in Europe, potentially exceeding 200%. In contrast, nations like Estonia and Luxembourg may boast ratios below 50%. This disparity raises questions about fiscal policy, governance, and the economic structure within each nation.
Furthermore, the consequences of high debt-to-GDP ratios can extend beyond mere economic metrics. High levels of debt can restrict a government’s ability to invest in public services and infrastructure, which are vital for long-term growth. Countries with high ratios may face higher borrowing costs, as lenders demand greater risk premiums. This creates a cycle that can hinder economic recovery and growth.
Regional Analysis
When we look at the map, it’s evident that southern European countries tend to have higher debt-to-GDP ratios. For example, Greece, Italy, and Portugal are grappling with ratios that place them at risk of economic instability. These nations have had to implement austerity measures in the past to manage their debt levels, often leading to public unrest and economic contraction.
In contrast, northern European countries, such as Norway and Finland, enjoy lower debt-to-GDP ratios. These nations have successfully managed their debt levels through prudent fiscal policies and robust economic growth. Interestingly, the Nordic model, which emphasizes social welfare alongside fiscal responsibility, has allowed these countries to maintain strong public finances.
Western European countries like France and Belgium present a mixed picture. Their ratios hover around the average, indicating that while they are not in immediate danger, they must remain vigilant about their fiscal policies, particularly in light of potential economic downturns.
Eastern European nations exhibit a diverse range of debt-to-GDP ratios. Countries like Poland have managed to keep their ratios relatively low, thanks to strong economic growth post-EU accession. However, others, such as Hungary, have experienced rising debt levels, raising concerns about their economic trajectories.
Significance and Impact
Understanding debt-to-GDP ratios is crucial not only for economists but also for policymakers and citizens alike. These ratios can impact everything from government spending to social services, affecting the day-to-day lives of people. High debt levels can lead to increased taxes or reduced public services, which can spur social discontent.
As we look towards 2025, the trends in debt-to-GDP ratios may signal future challenges for the European Union. Countries must navigate the delicate balance between stimulating economic growth and managing debt levels. With ongoing geopolitical tensions, inflation concerns, and potential shifts in monetary policy, the landscape may change rapidly.
Ultimately, the outlook for Europe will depend on each country’s ability to implement effective fiscal strategies that encourage growth while keeping debt levels manageable. The debt-to-GDP ratio map acts as a vital tool for understanding these dynamics, providing insights that can guide future economic policies and discussions across the continent. Have you considered how these financial metrics might influence your country’s future? The implications are vast, touching upon everything from social stability to international relations.
Visualization Details
- Published
- October 4, 2025
- Views
- 38
Comments
Loading comments...