agriculture Maps
78 geographic visualizations tagged with "agriculture"
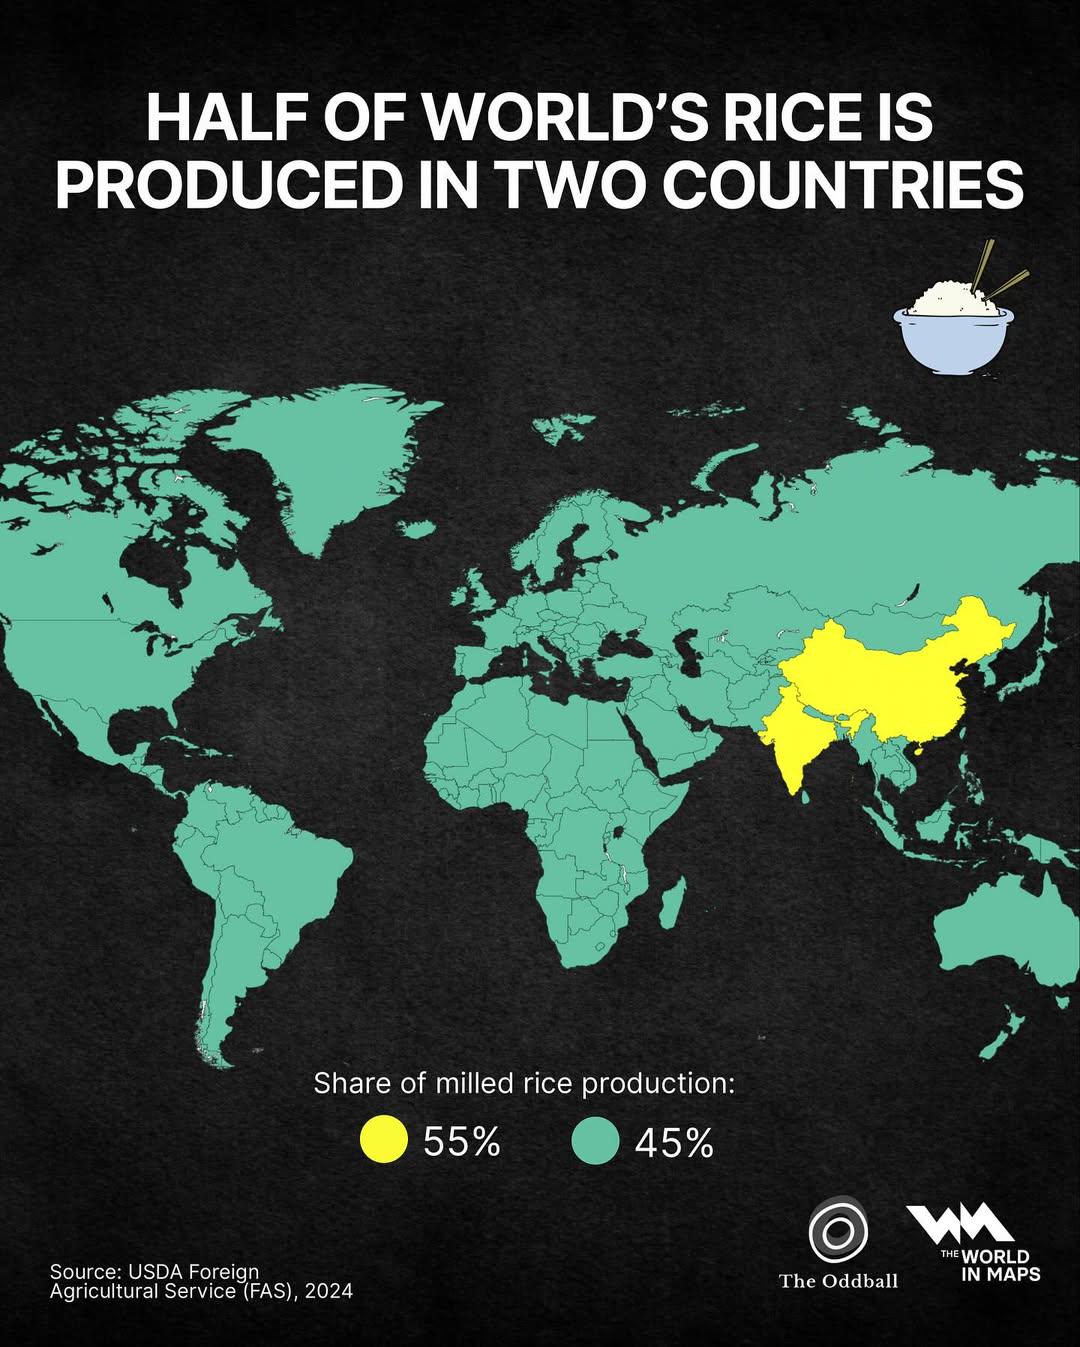
Rice Production Map of the World
This map illustrates a striking reality: more than half of the world’s rice production comes from just two countries—Chi...
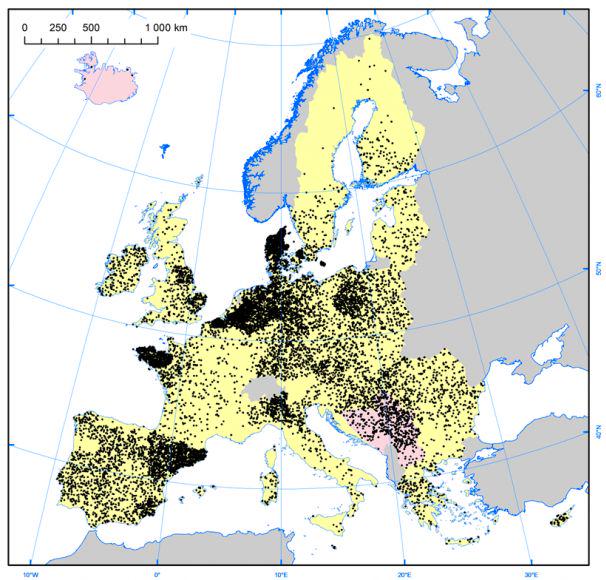
Pig Farm Density Map of Europe
The "Density of Pig Farms across Europe" map highlights the geographical distribution of pig farming throughout the cont...
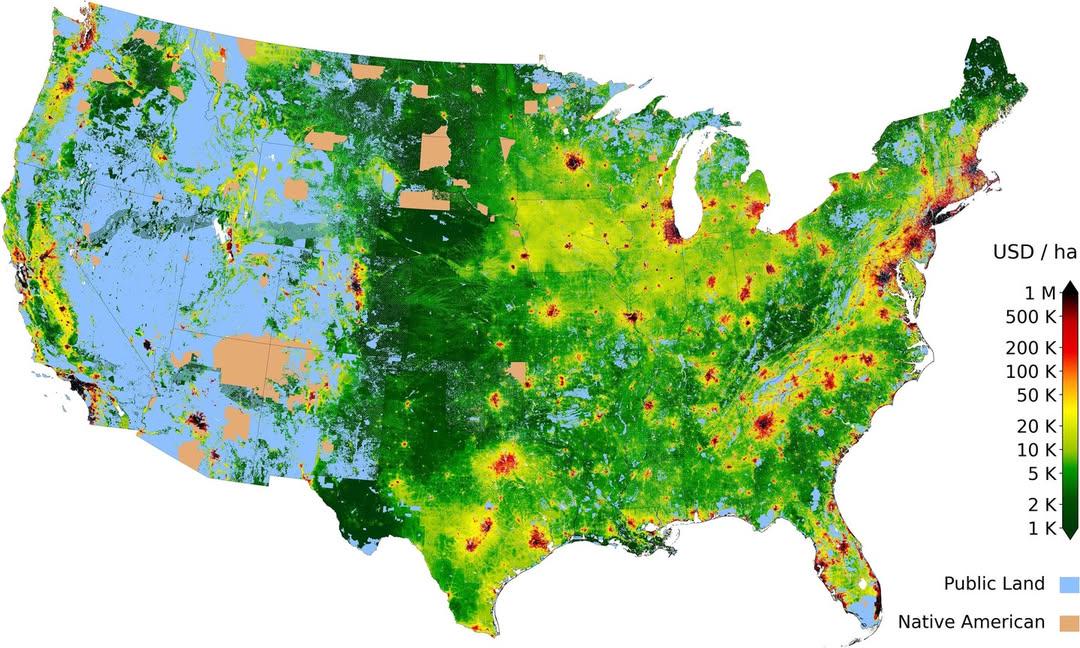
Land Prices Across America Map
The map titled "The Most and Least Expensive Land in America" provides a detailed overview of land prices across various...
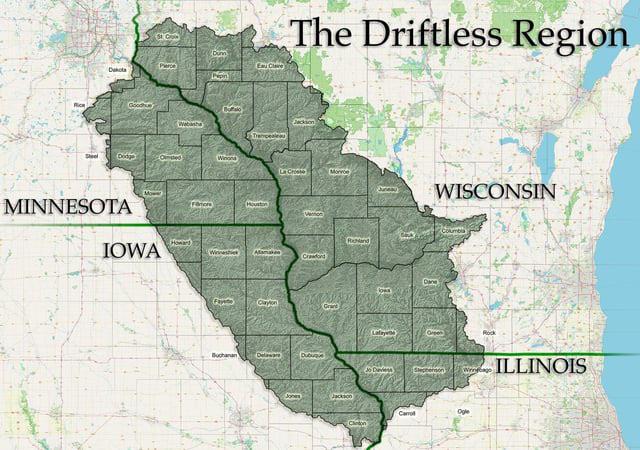
Driftless Area Geographical Features Map
The "Driftless Area Geographical Features Map" highlights a unique geological and ecological region in the Midwestern Un...
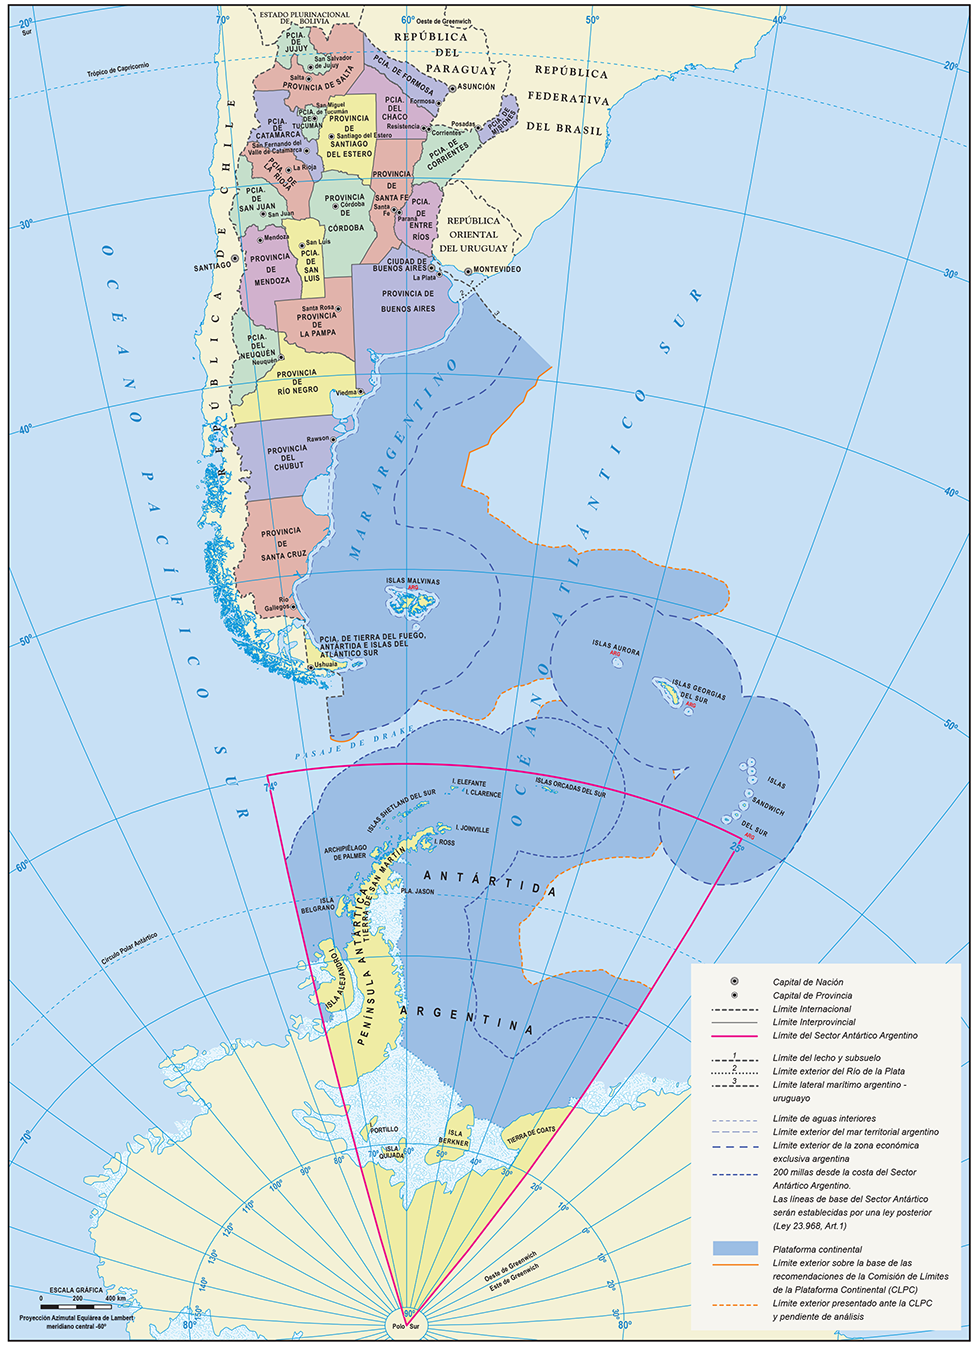
Official Map of the Argentine Republic
The official map of the Argentine Republic provides a comprehensive representation of the country's geographical feature...
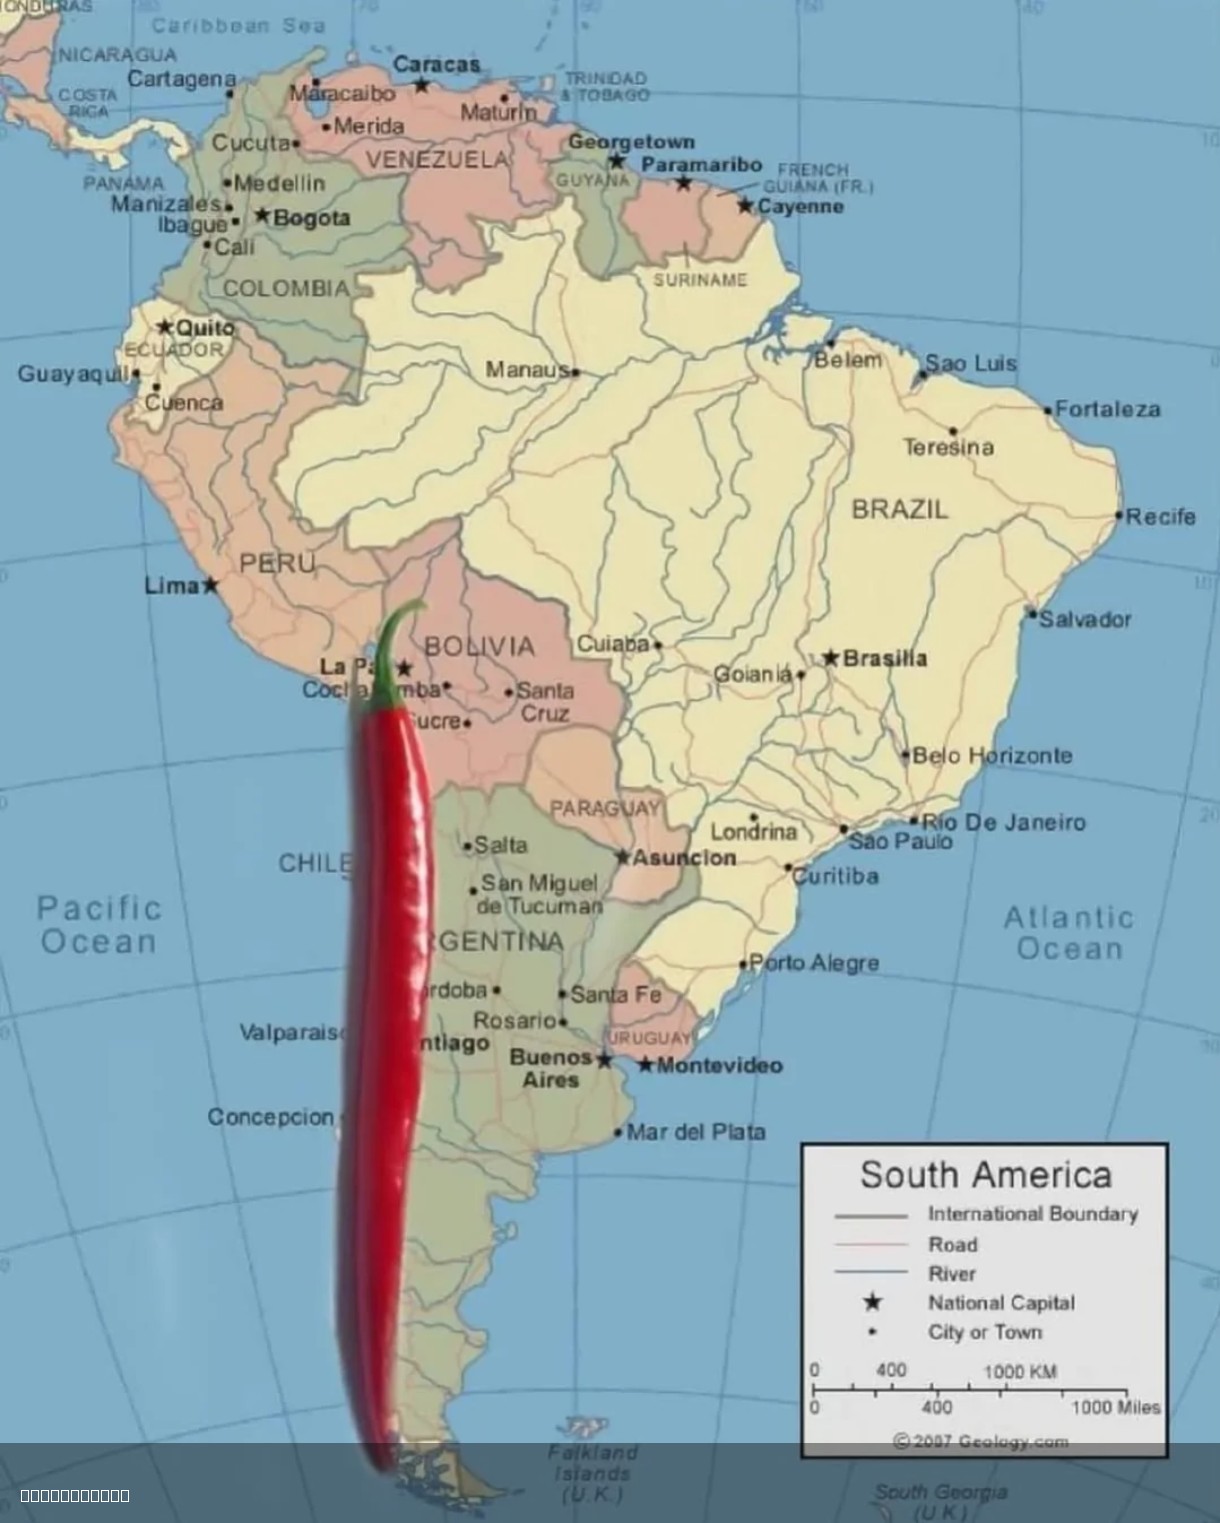
Spice Production and Consumption Map
The "Have some🌶️" map provides a visual representation of global spice production and consumption patterns. It highligh...
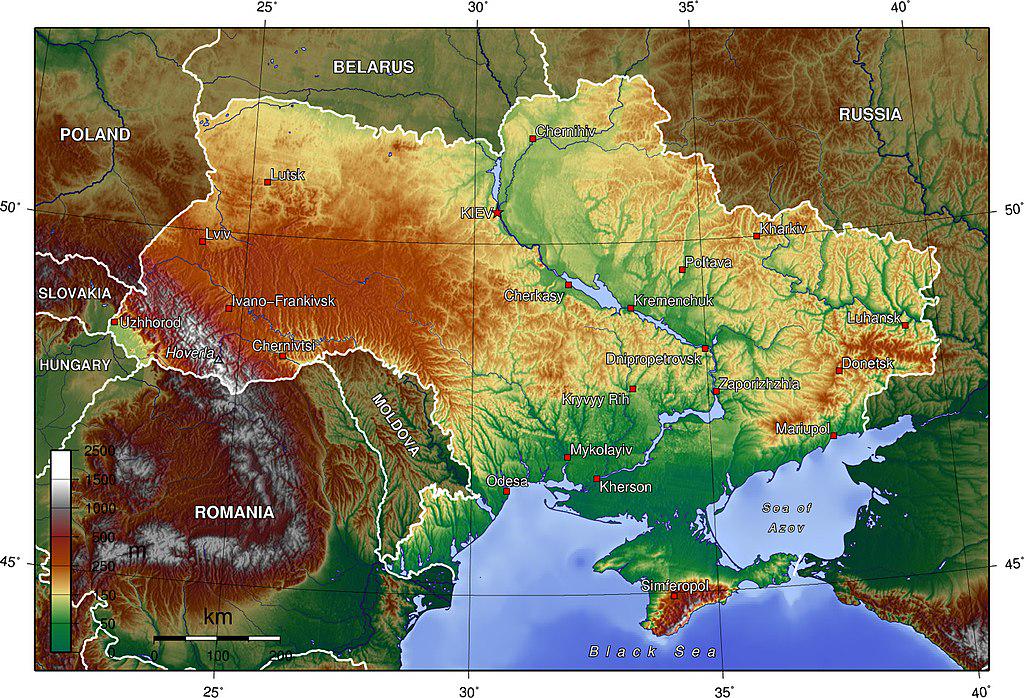
Topographic Map of Ukraine
The Topographic Map of Ukraine provides a detailed visualization of the country's diverse terrain, showcasing its elevat...
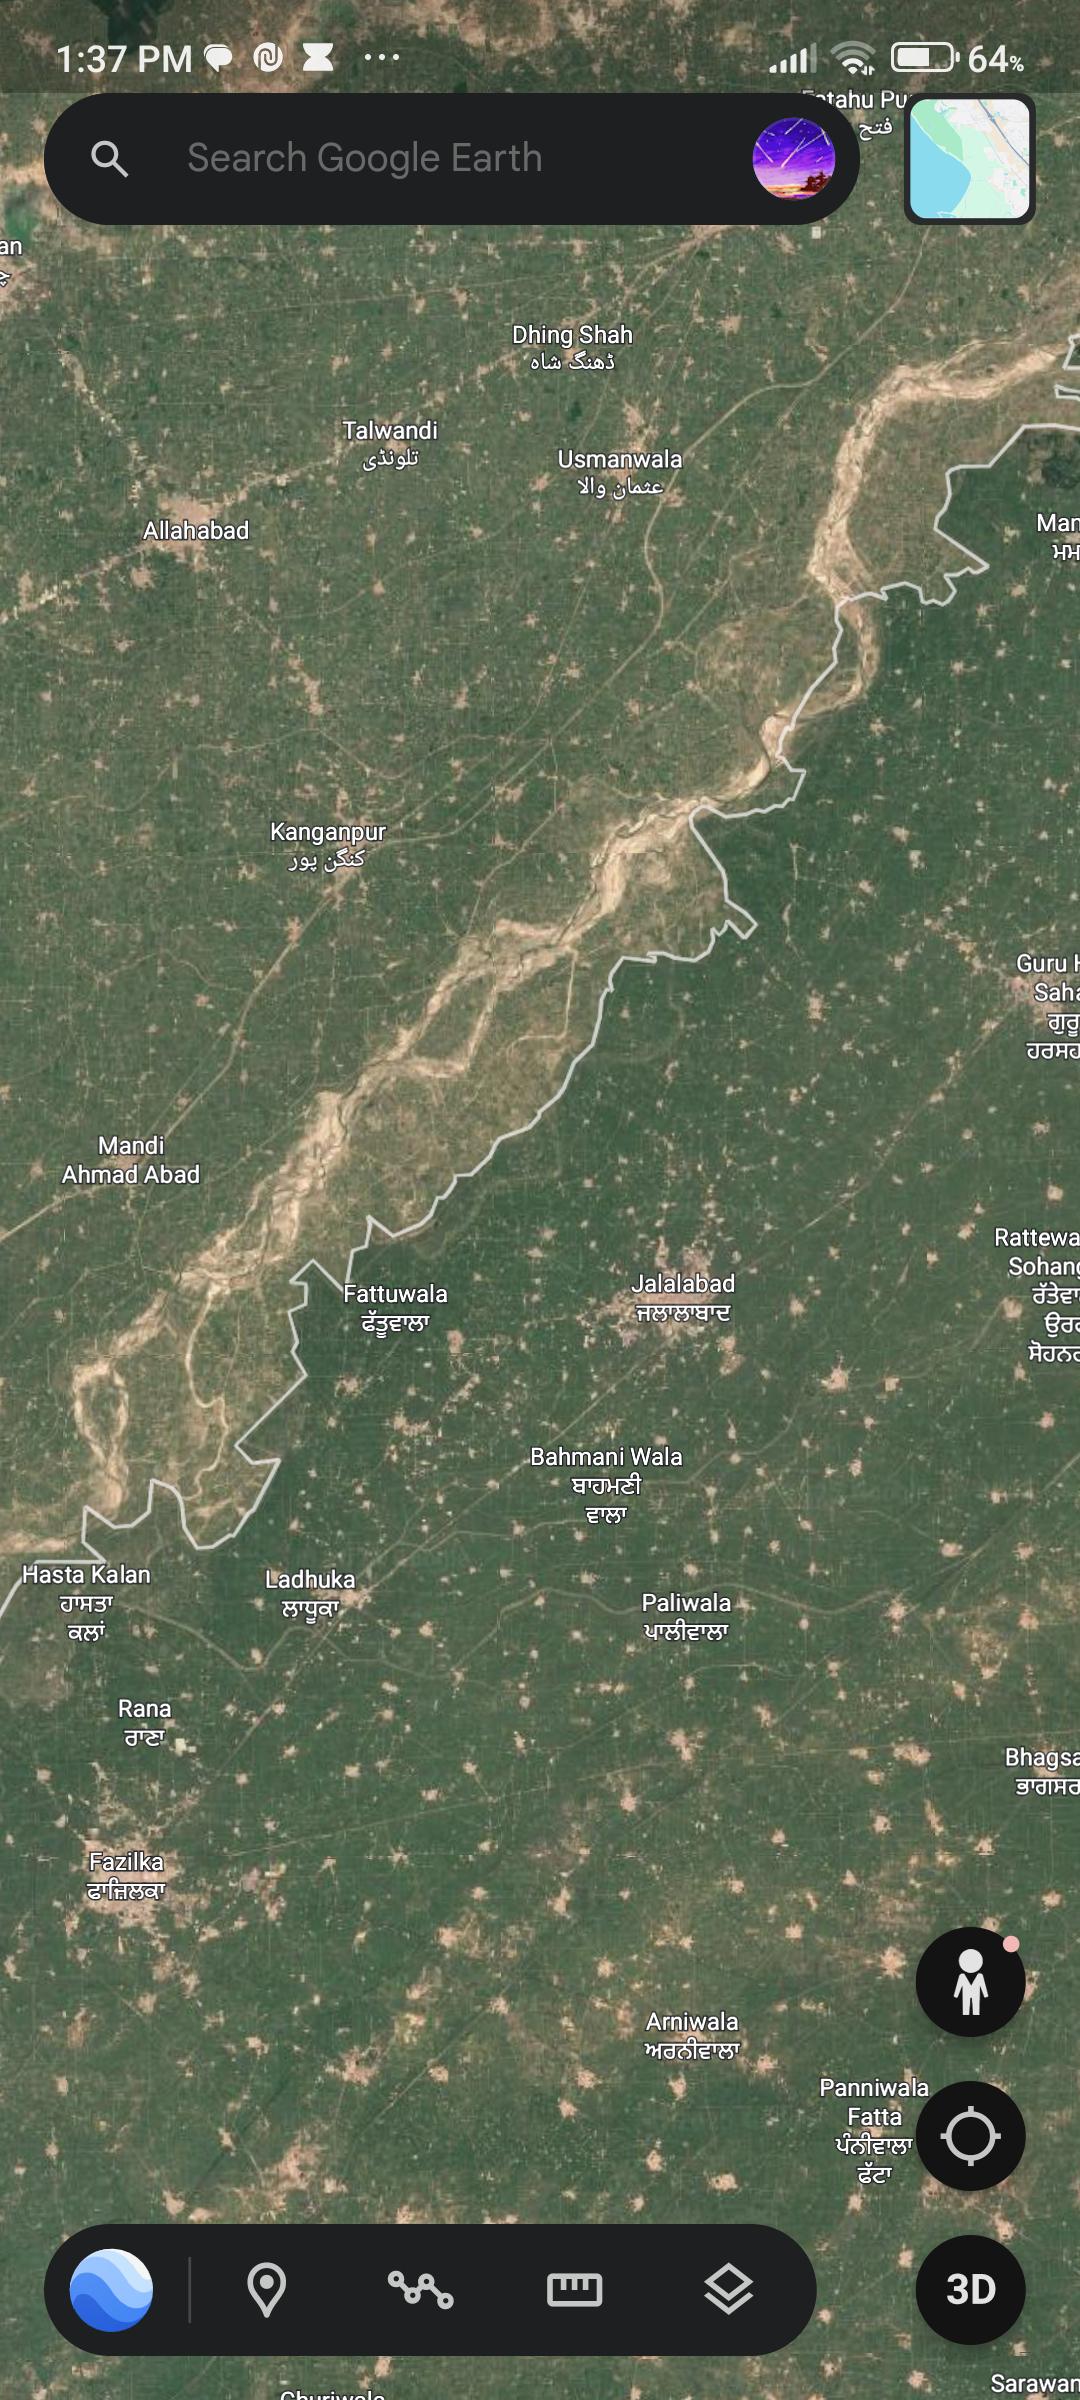
Greener Areas Near India-Pakistan Border Map
The visualization titled "Why is the grass greener on this side?" illustrates the stark contrast in vegetation along the...
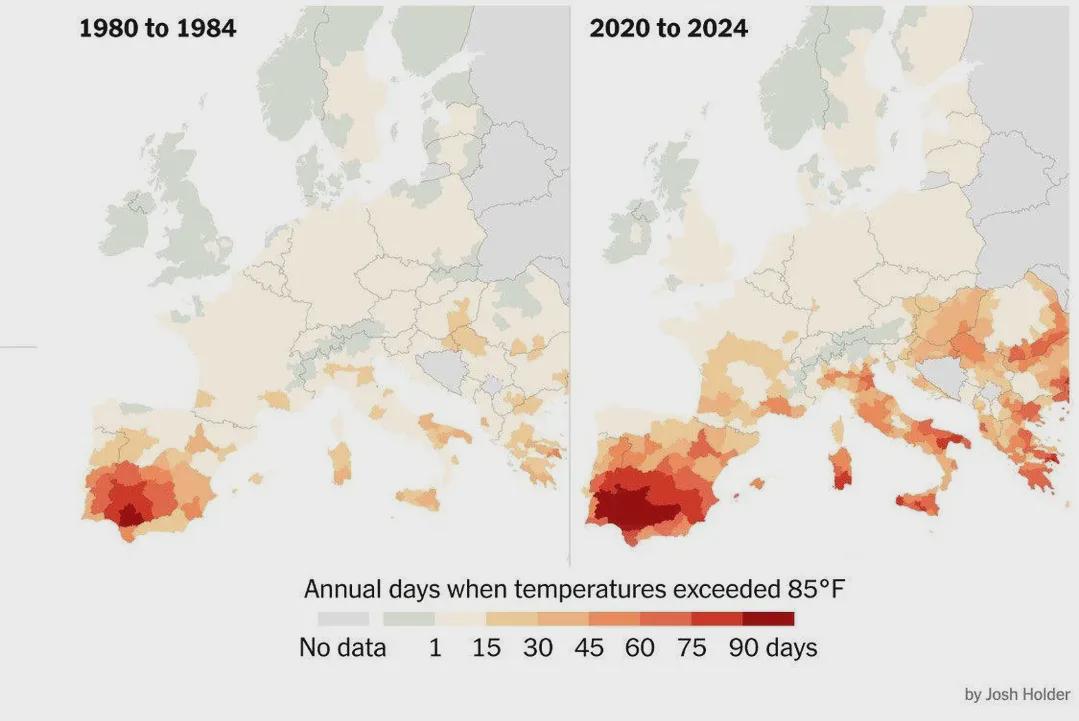
Days Over 30ºC in Europe Map
The visualization titled "Number of Days per Year When Temperatures Exceeded 30ºC (85°F) in Europe" provides a comprehen...
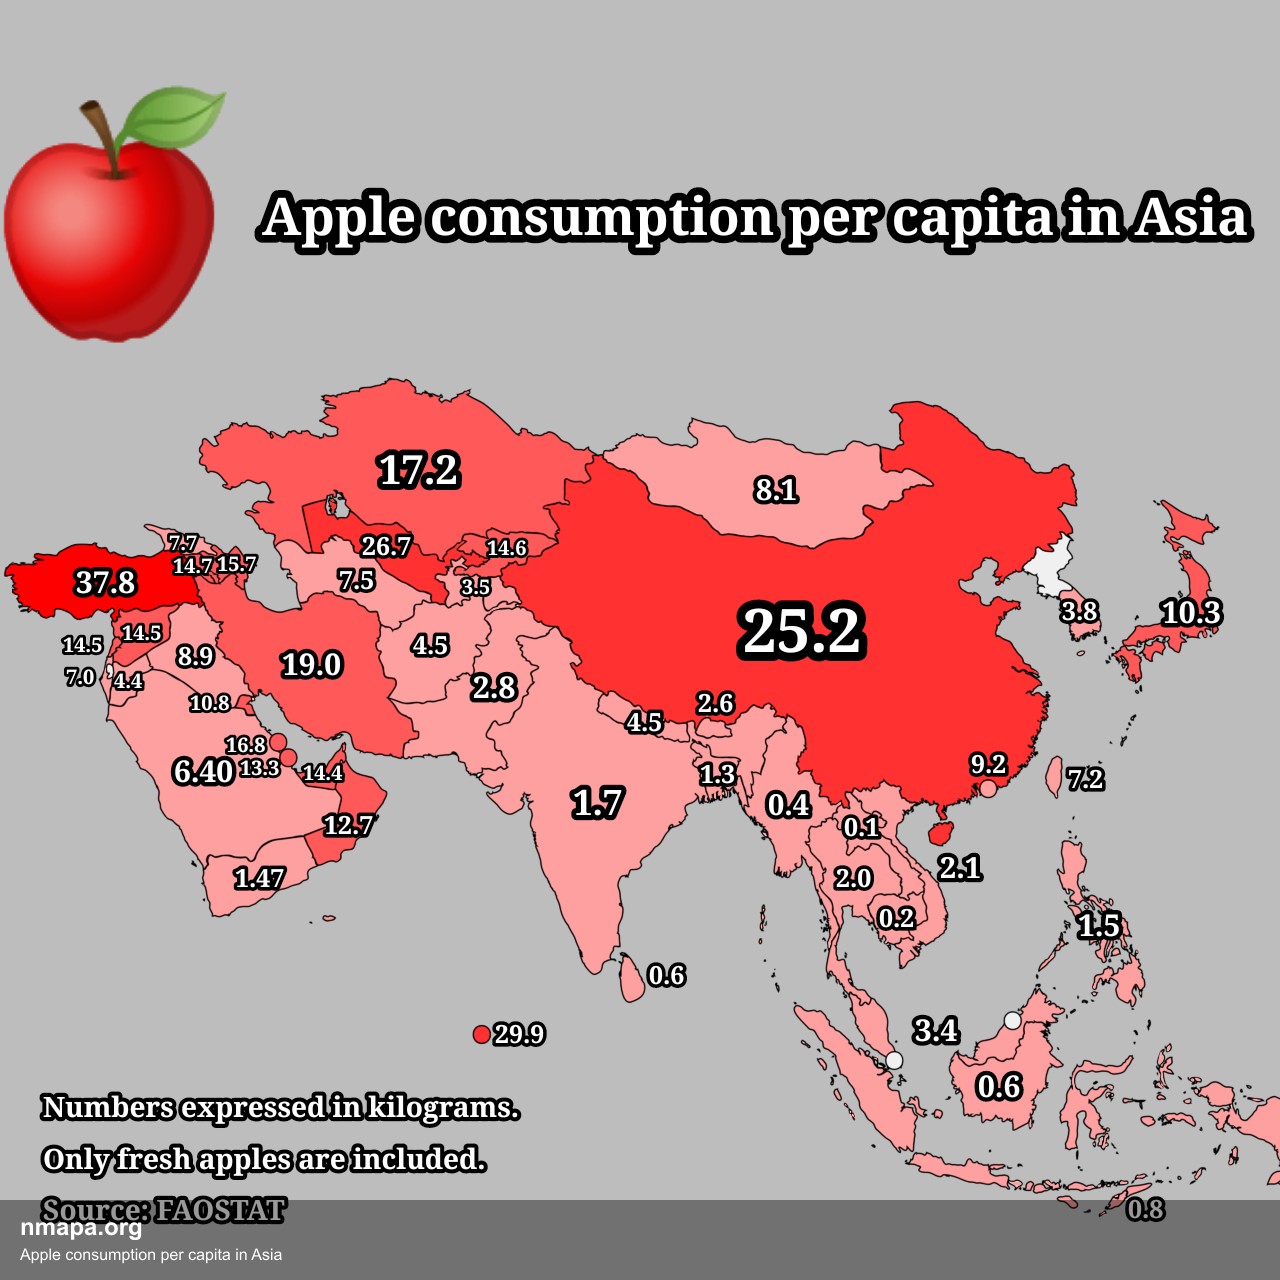
Apple Consumption Per Capita in Asia Map
The 'Apple Consumption Per Capita in Asia Map' presents a comprehensive visualization of apple consumption across variou...
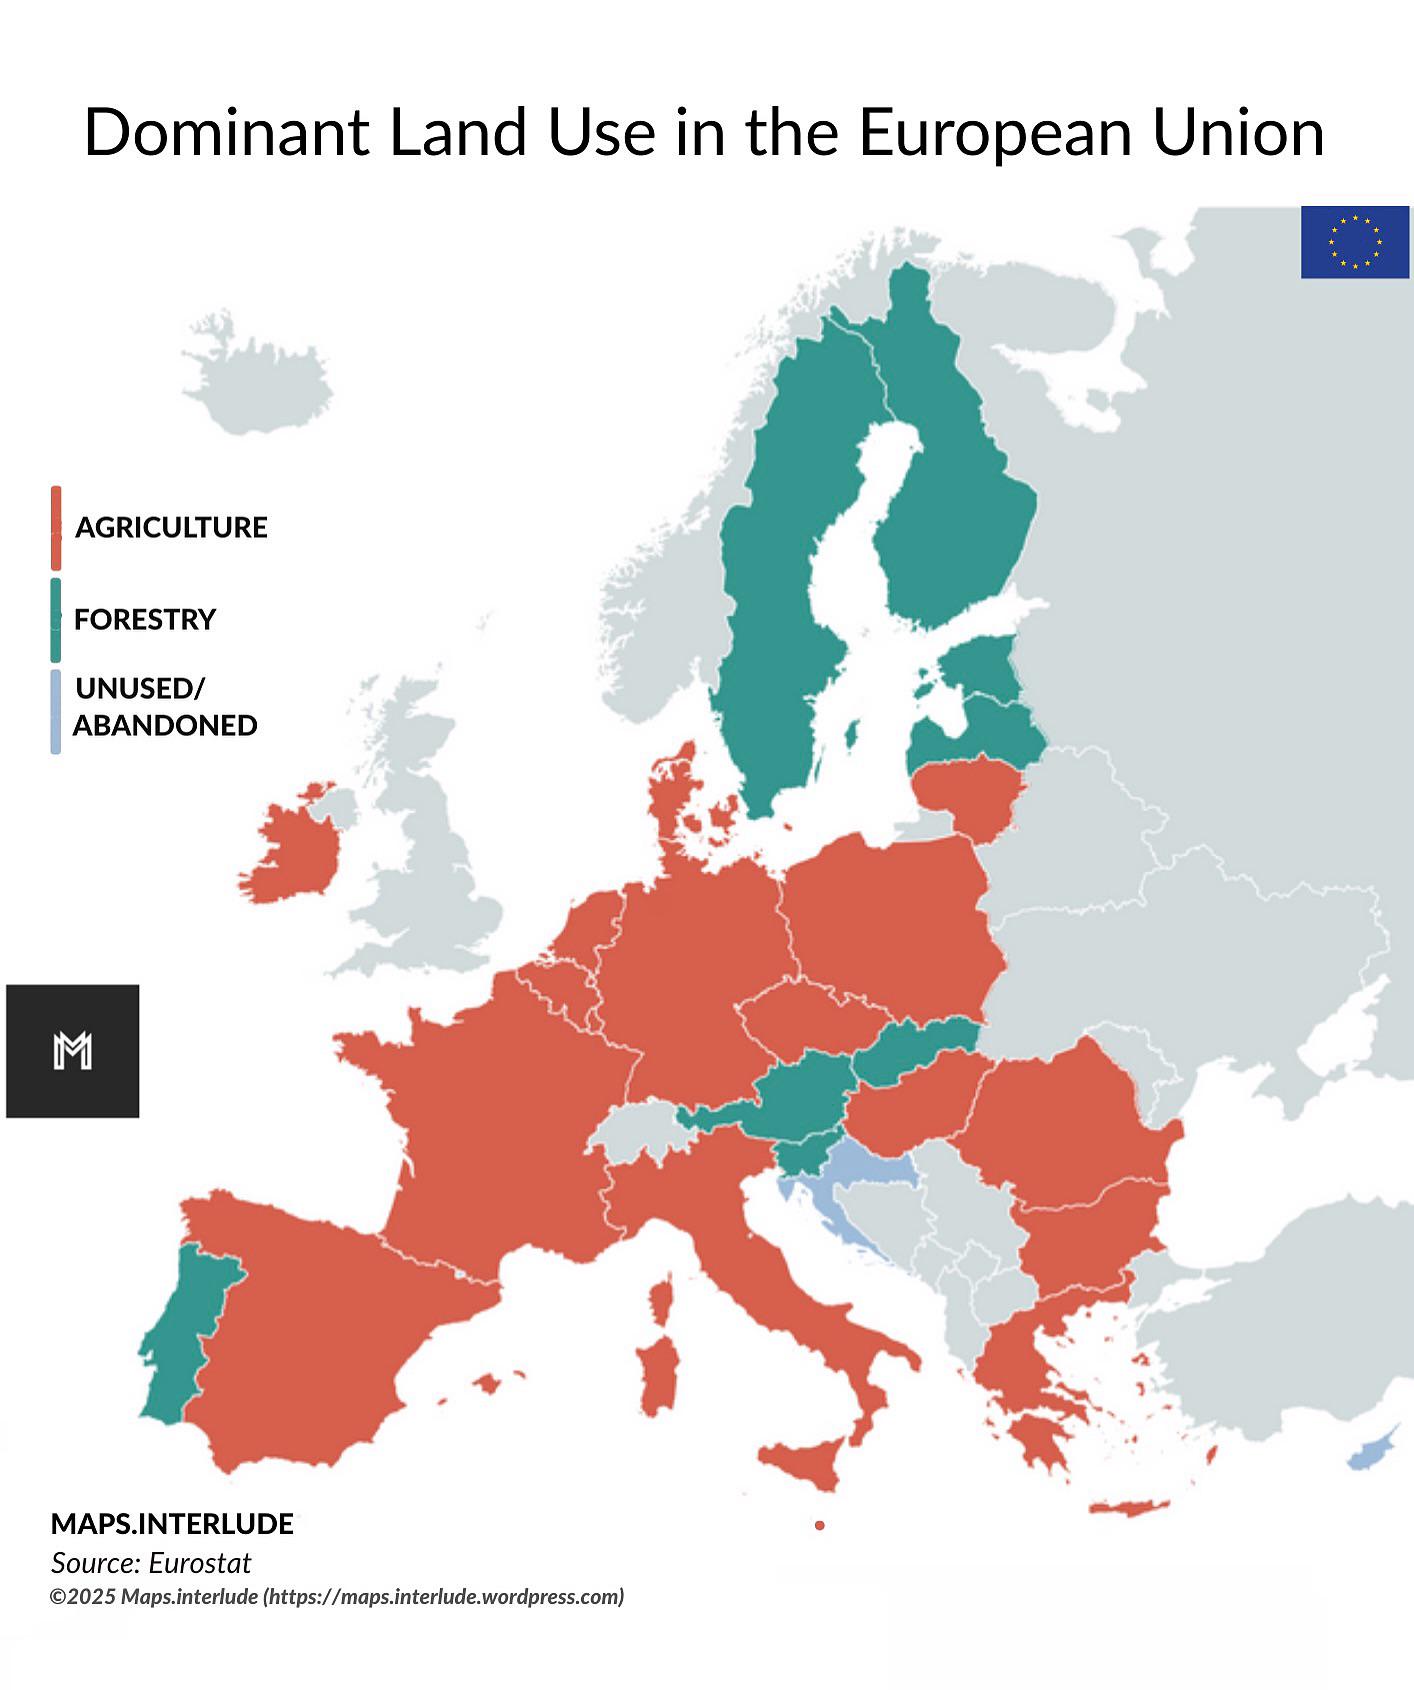
Dominant Land Use in the European Union Map
The "Dominant Land Use in the European Union" map provides a comprehensive visualization of how land is utilized across ...
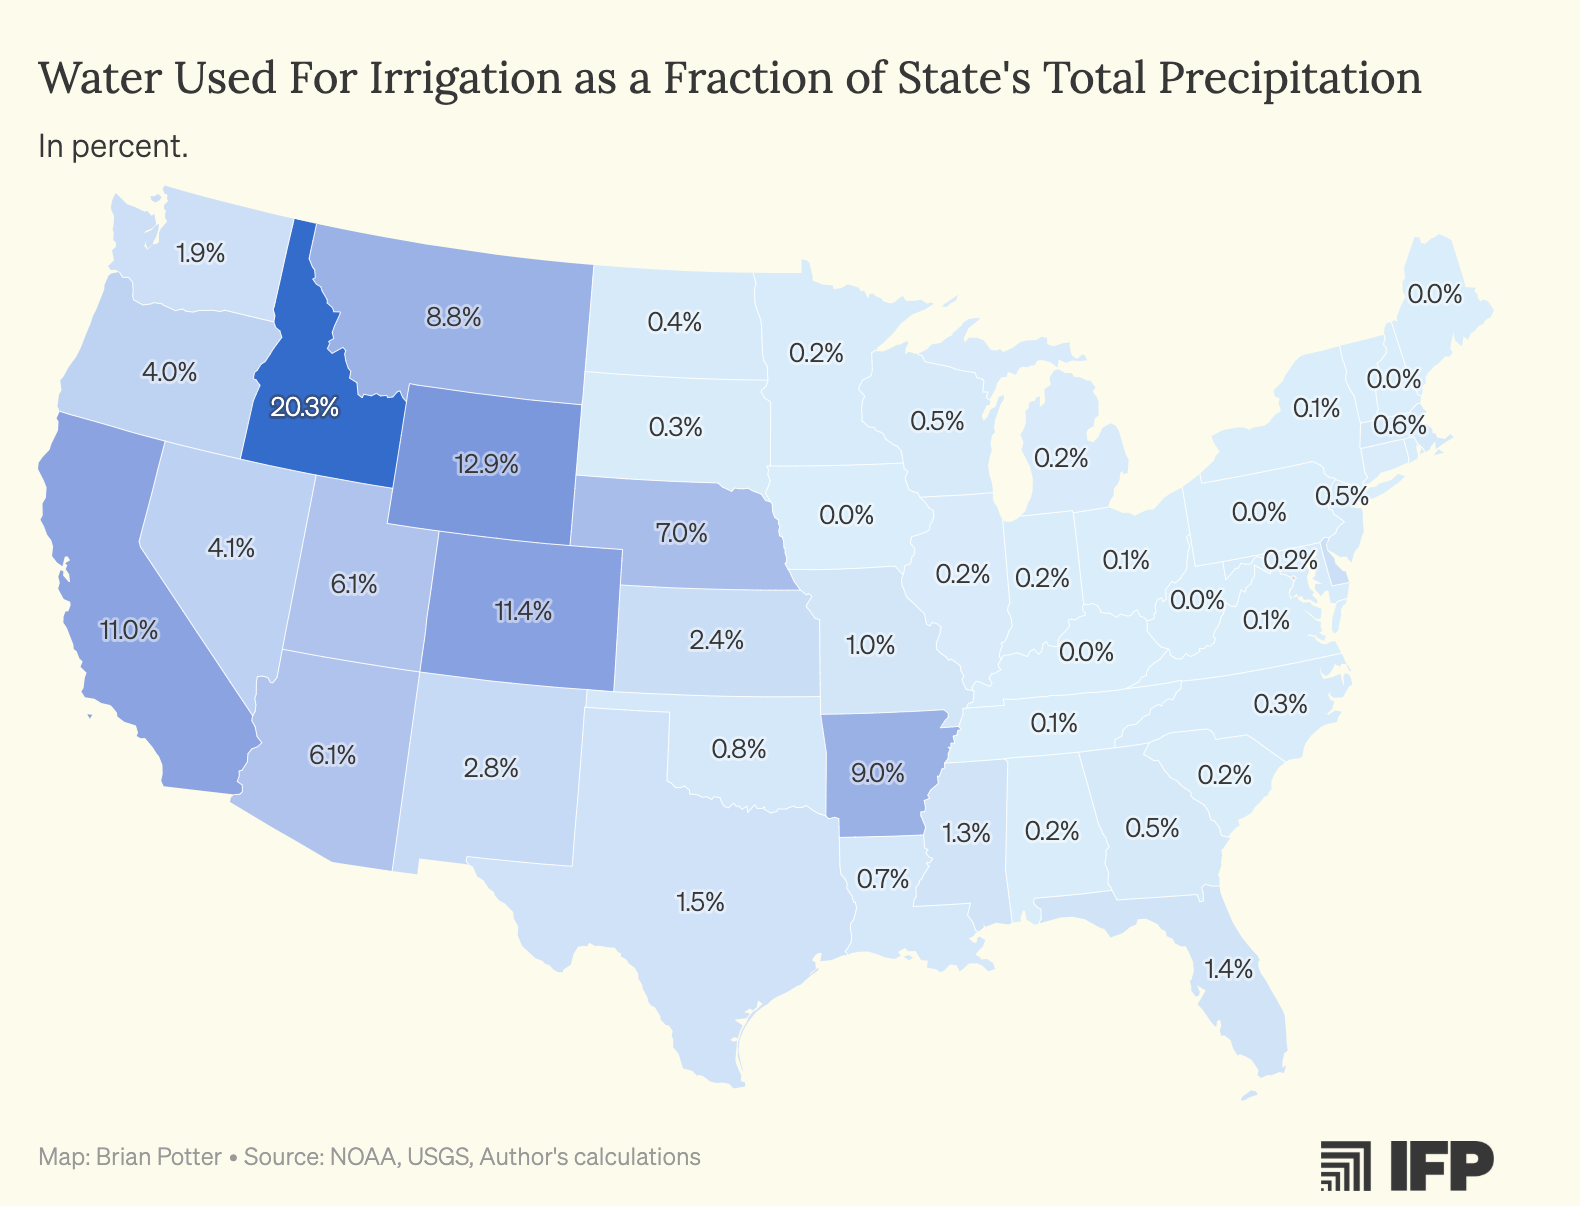
Water Used for Crop Irrigation Map by US States
The map titled "Water Used for Crop Irrigation as a Percentage of US States' Total Precipitation" provides a compelling ...
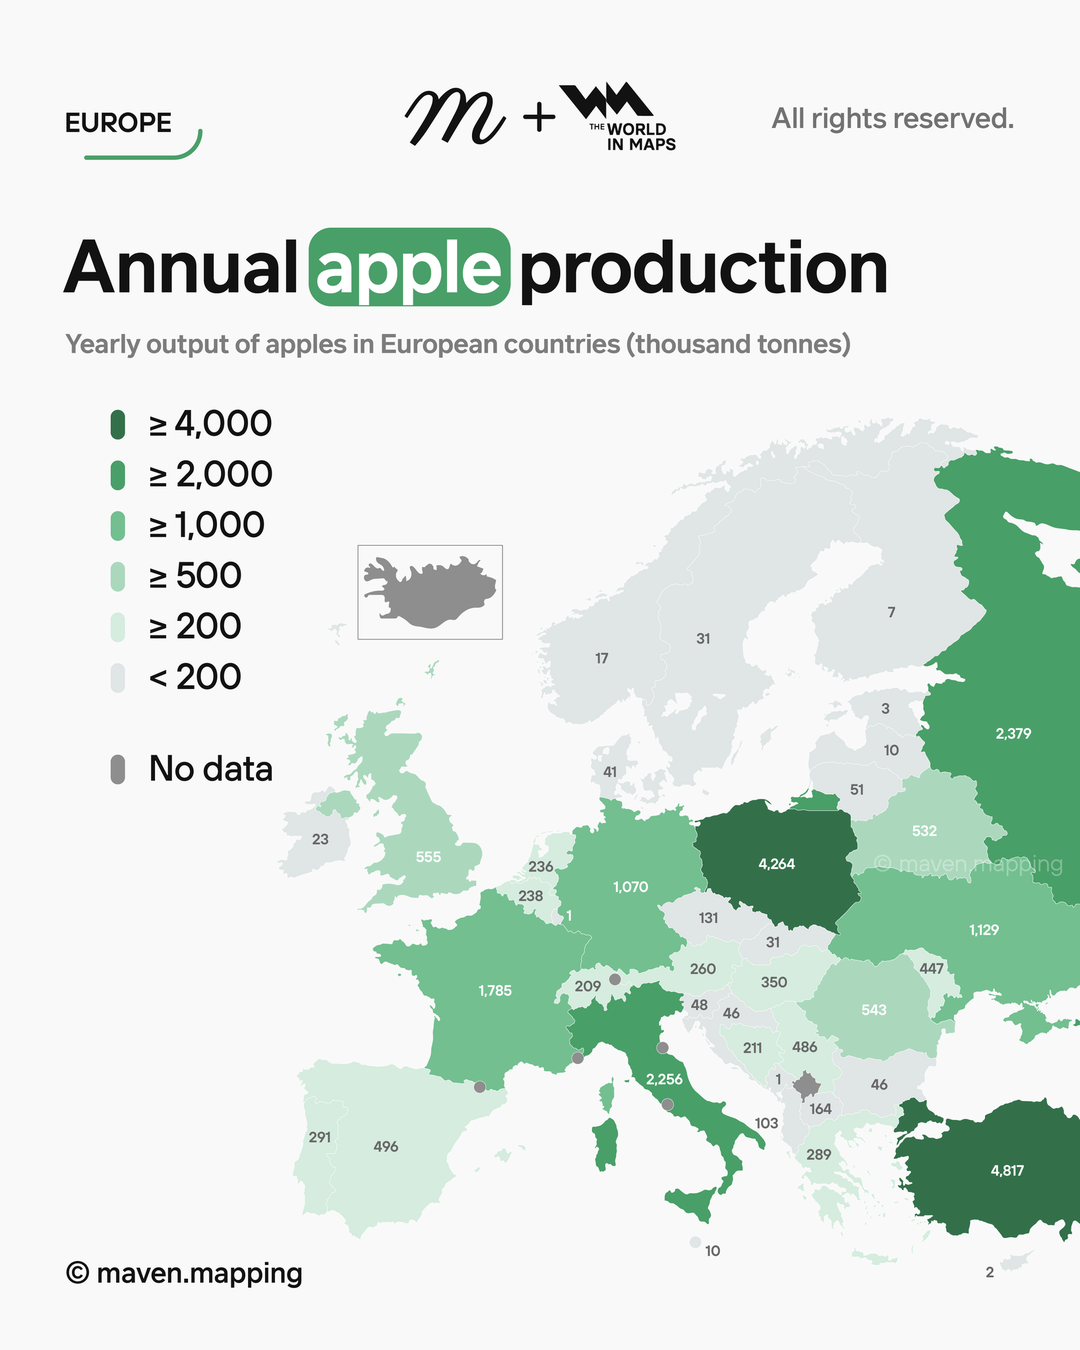
Annual Apple Production in Europe Map
Interestingly, in 2022, it was reported that Europe collectively produced over 10 million metric tons of apples, with no...
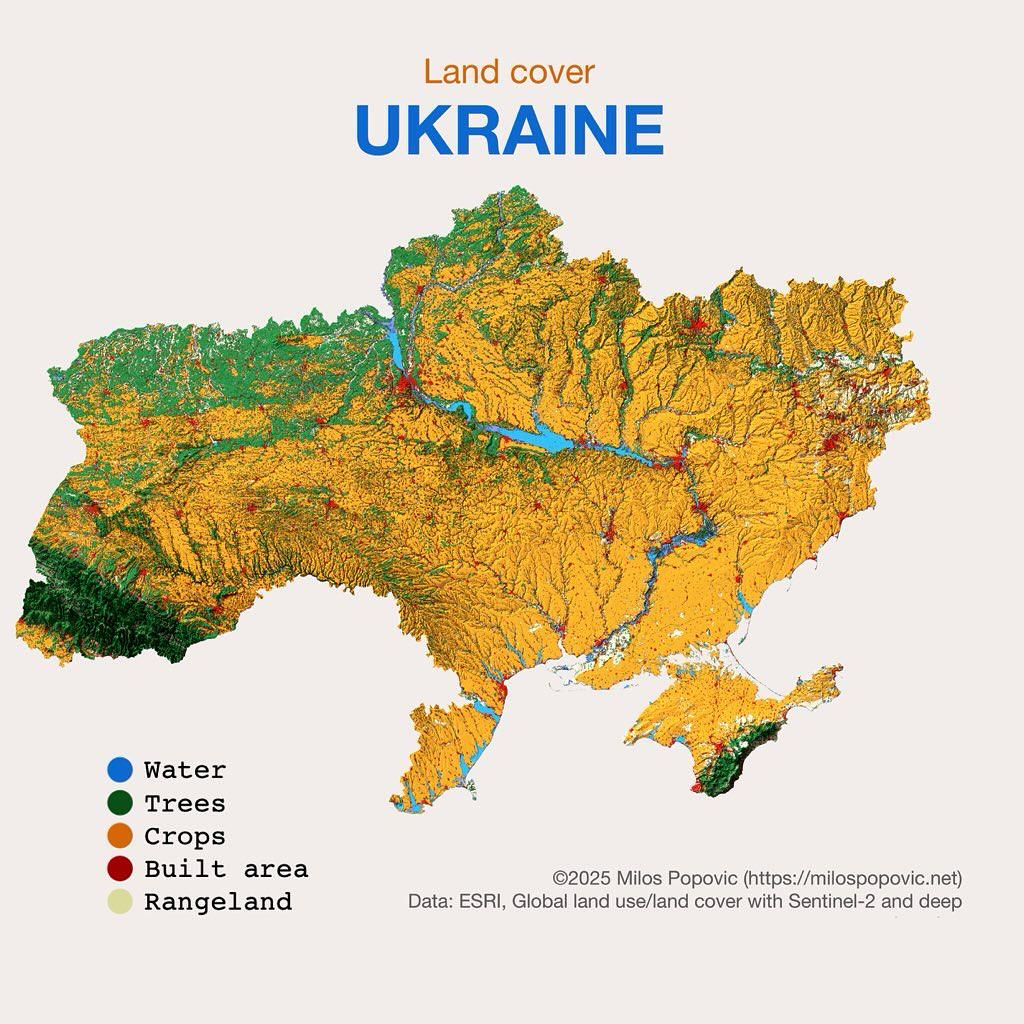
Land Cover Map of Ukraine
The "Land Cover of Ukraine" map provides a comprehensive overview of the various types of land cover across the country....
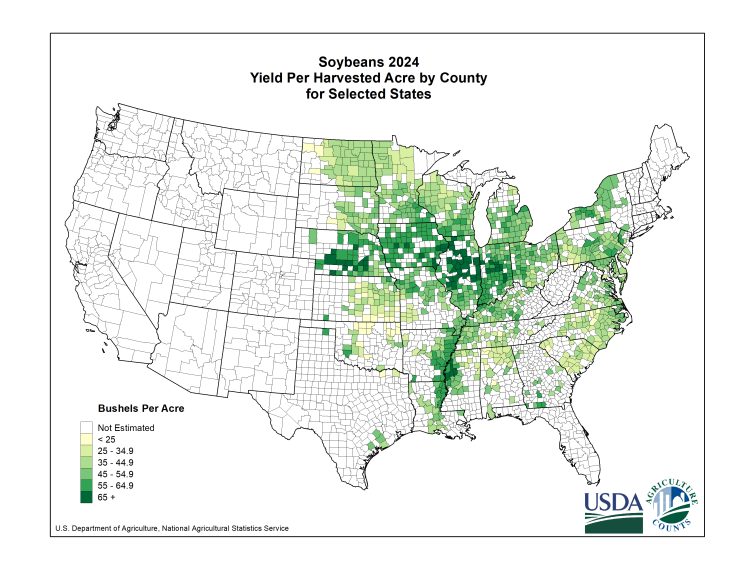
Soybean Yield Map of the US
The "Soybean Yield Map of the US" provides a comprehensive visualization of the regions across the United States that ex...
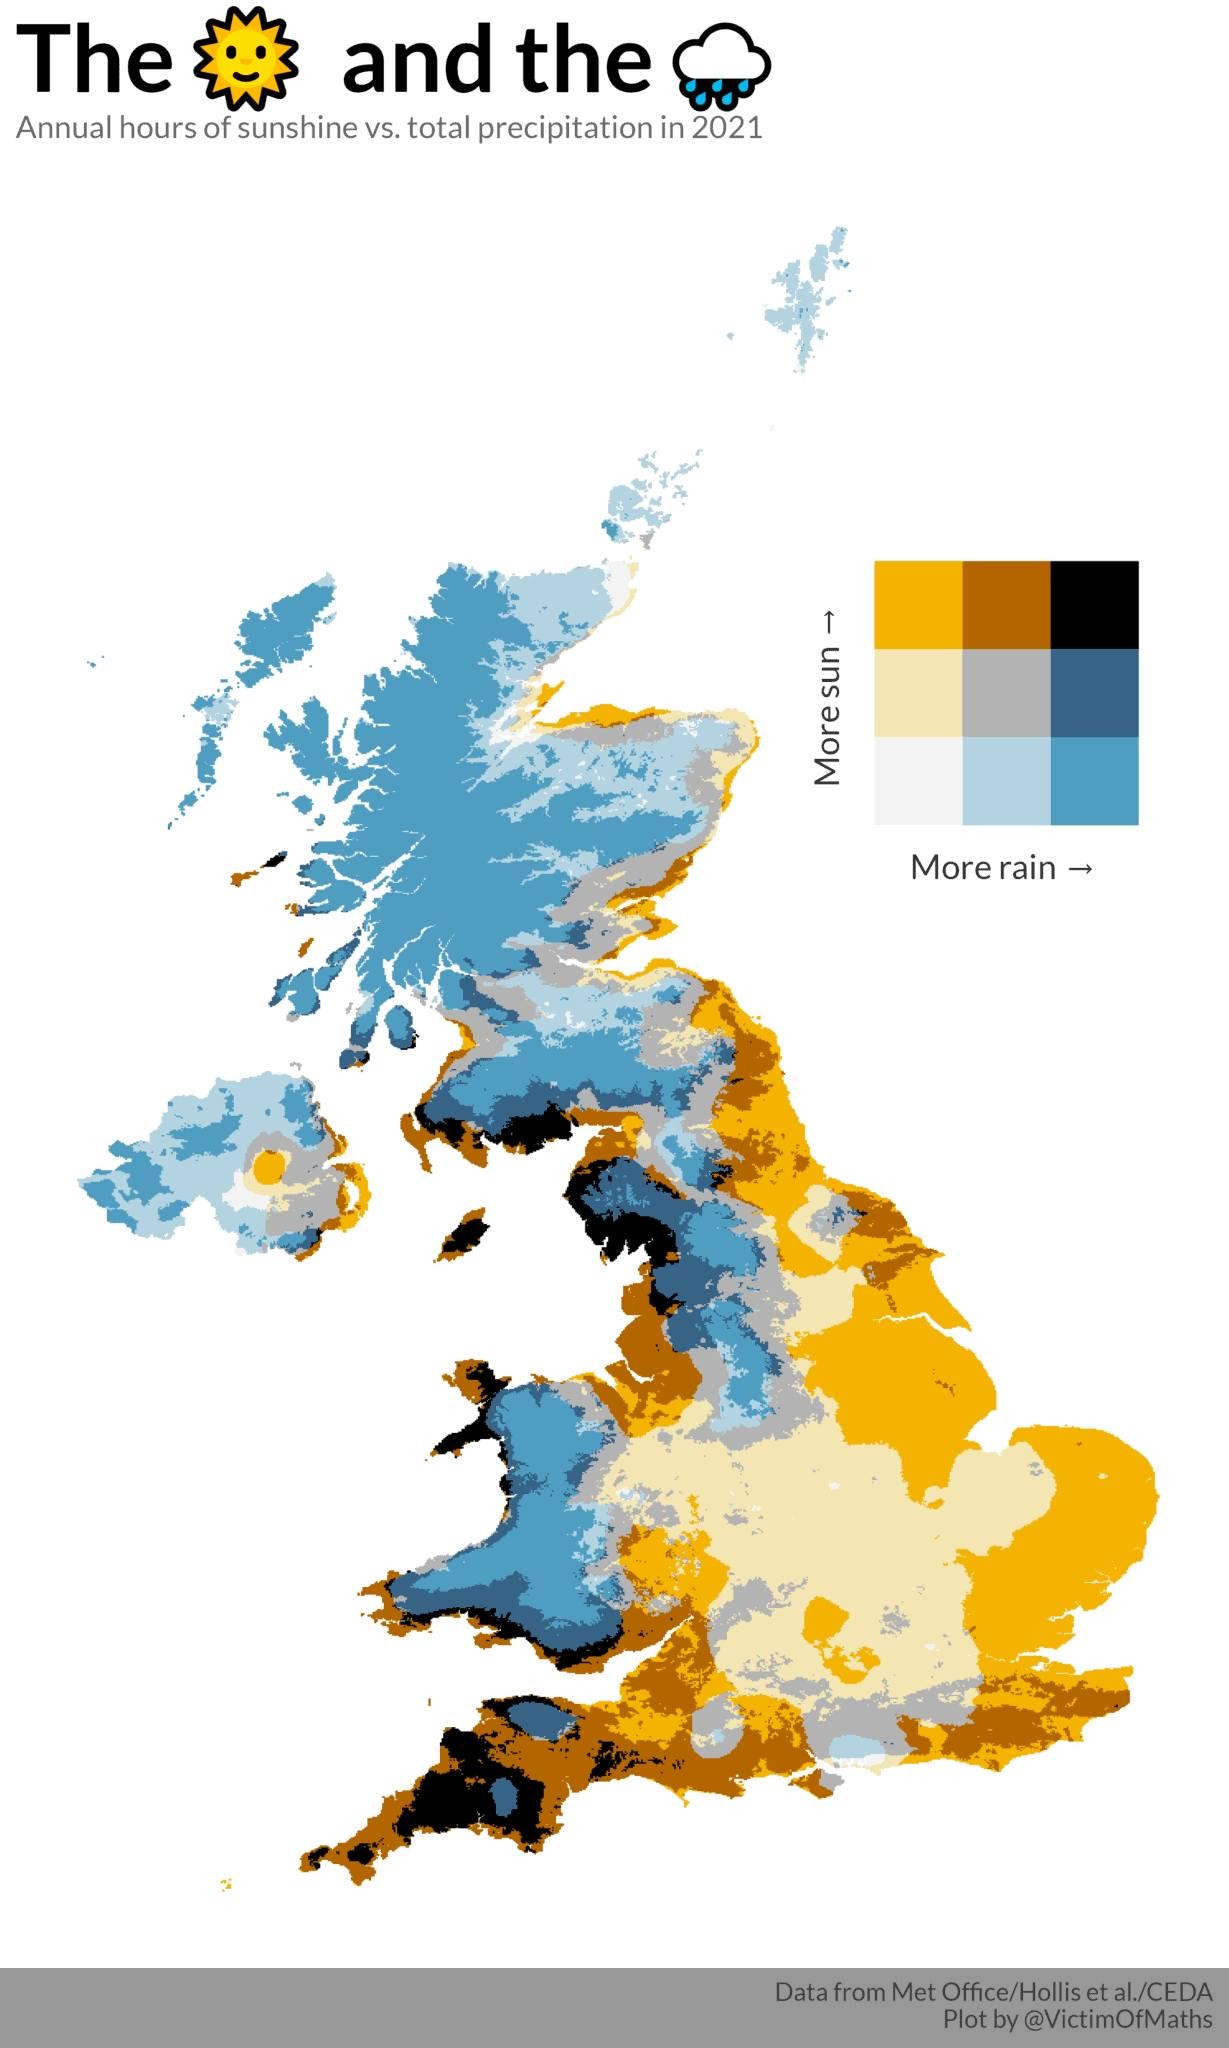
Sunshine Hours vs Rain in the UK Map
...
Map of Australia's Climate Zones
The "Map of Australia's Climate Zones" provides a comprehensive overview of the diverse climatic regions across the cont...
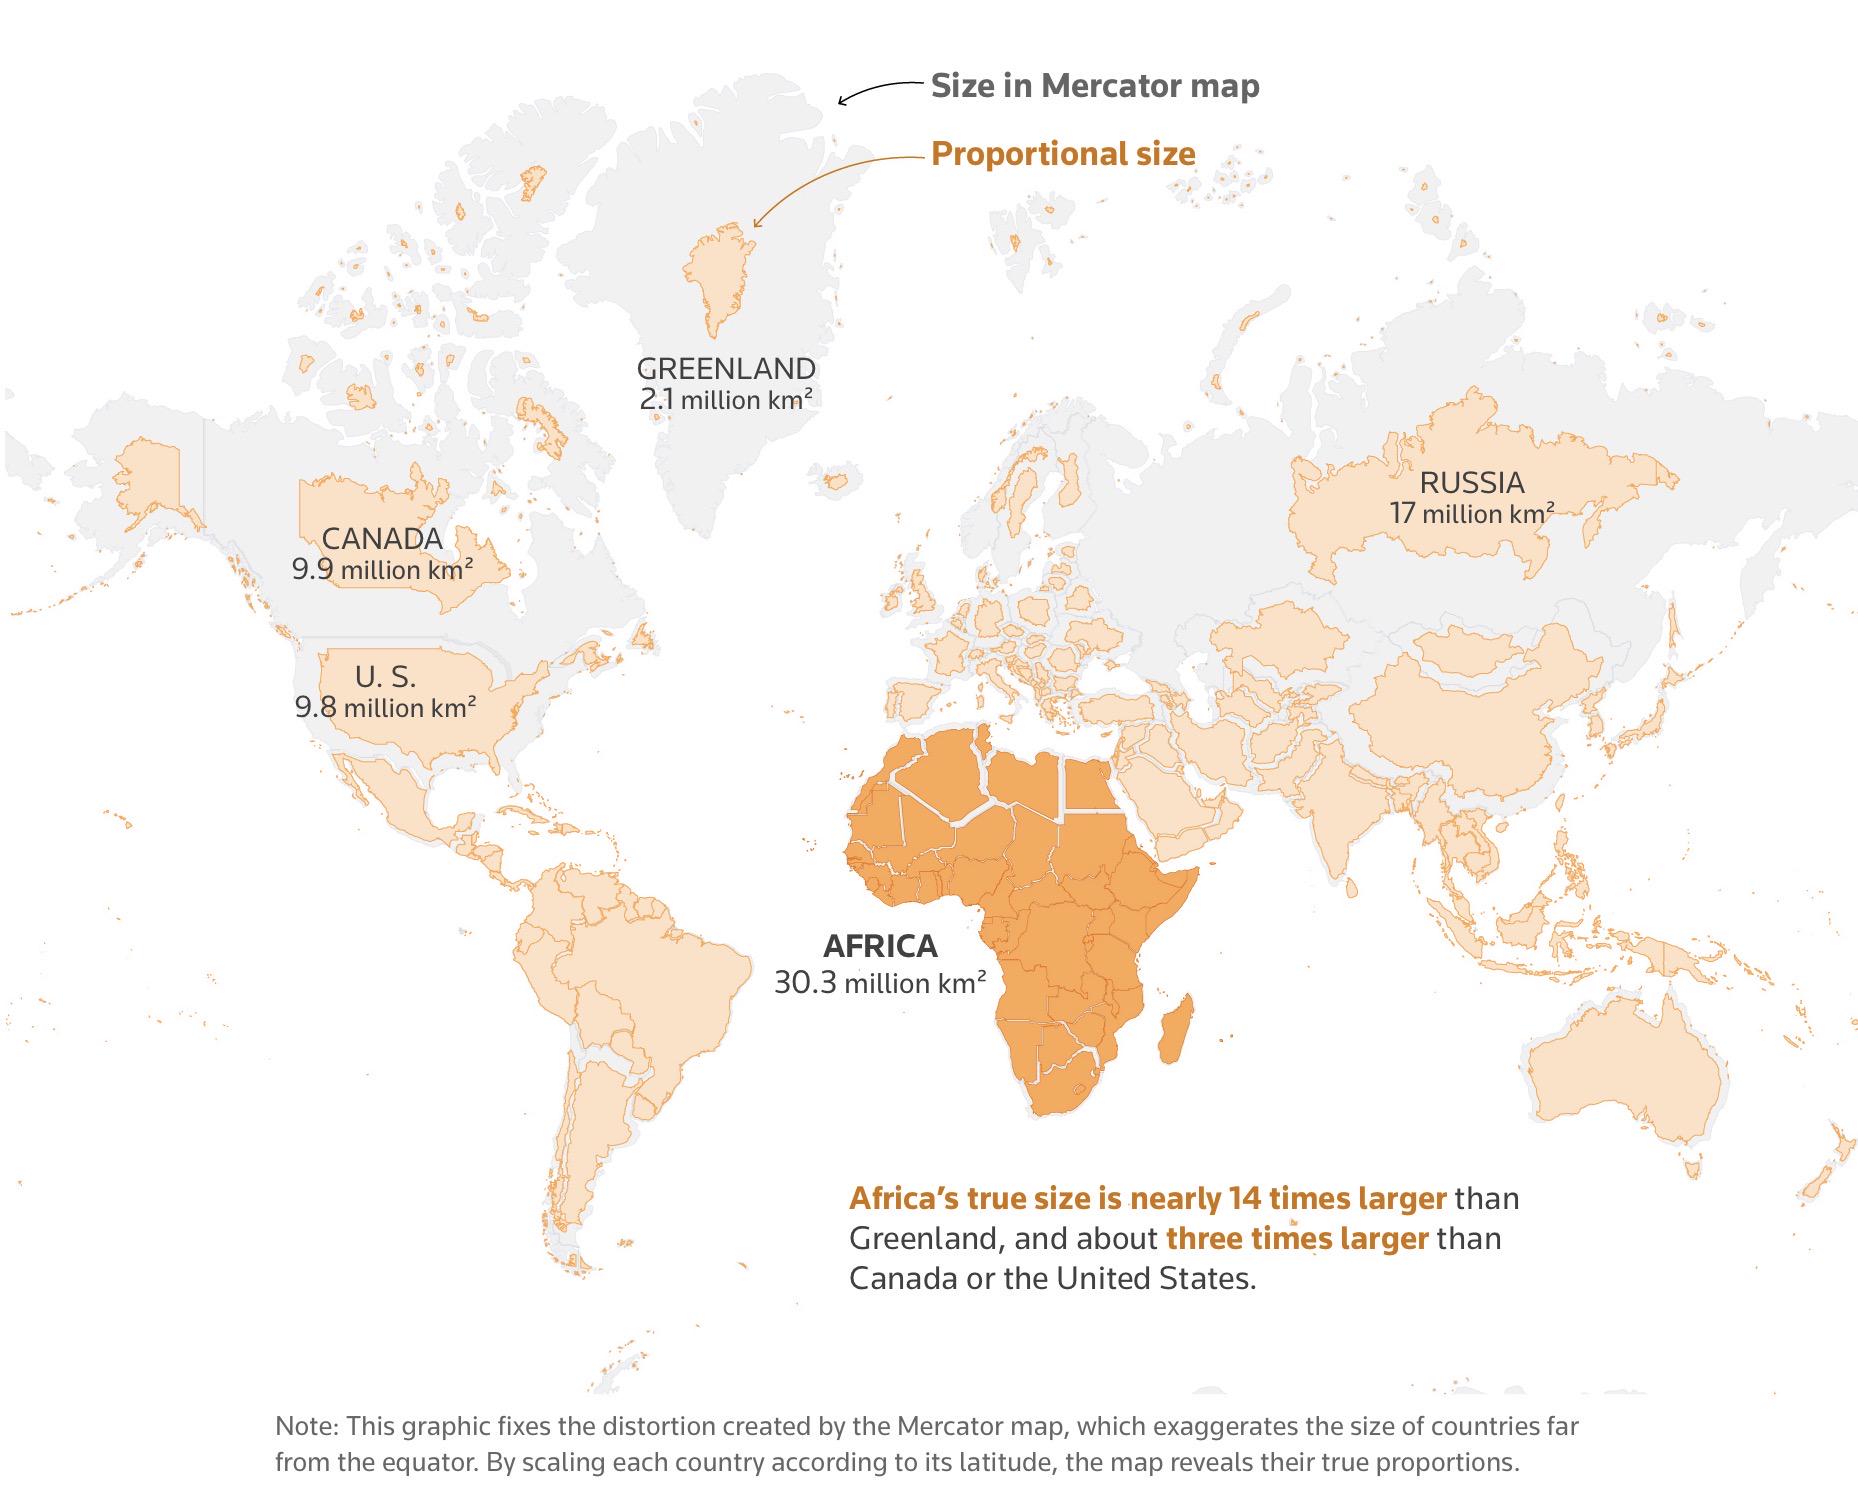
The True Size of Africa Map
The visualization titled "The True Size of Africa" challenges common misconceptions about the size of Africa relative to...
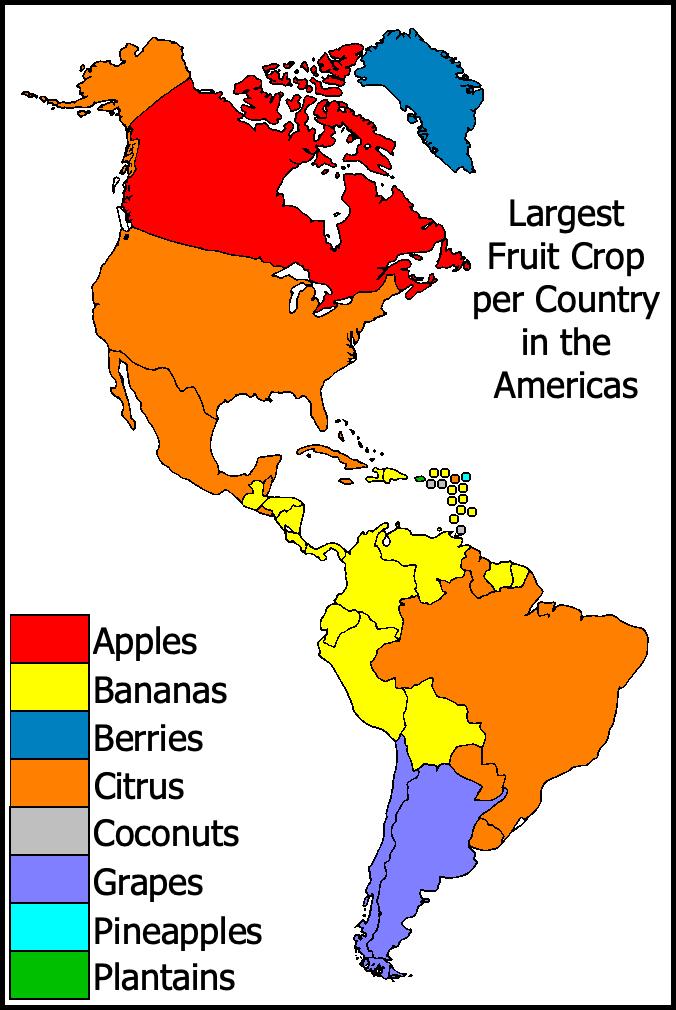
Largest Fruit Crop per Country in the Americas Map
The "Largest Fruit Crop per Country in the Americas" map visually represents the predominant fruit crops cultivated acro...
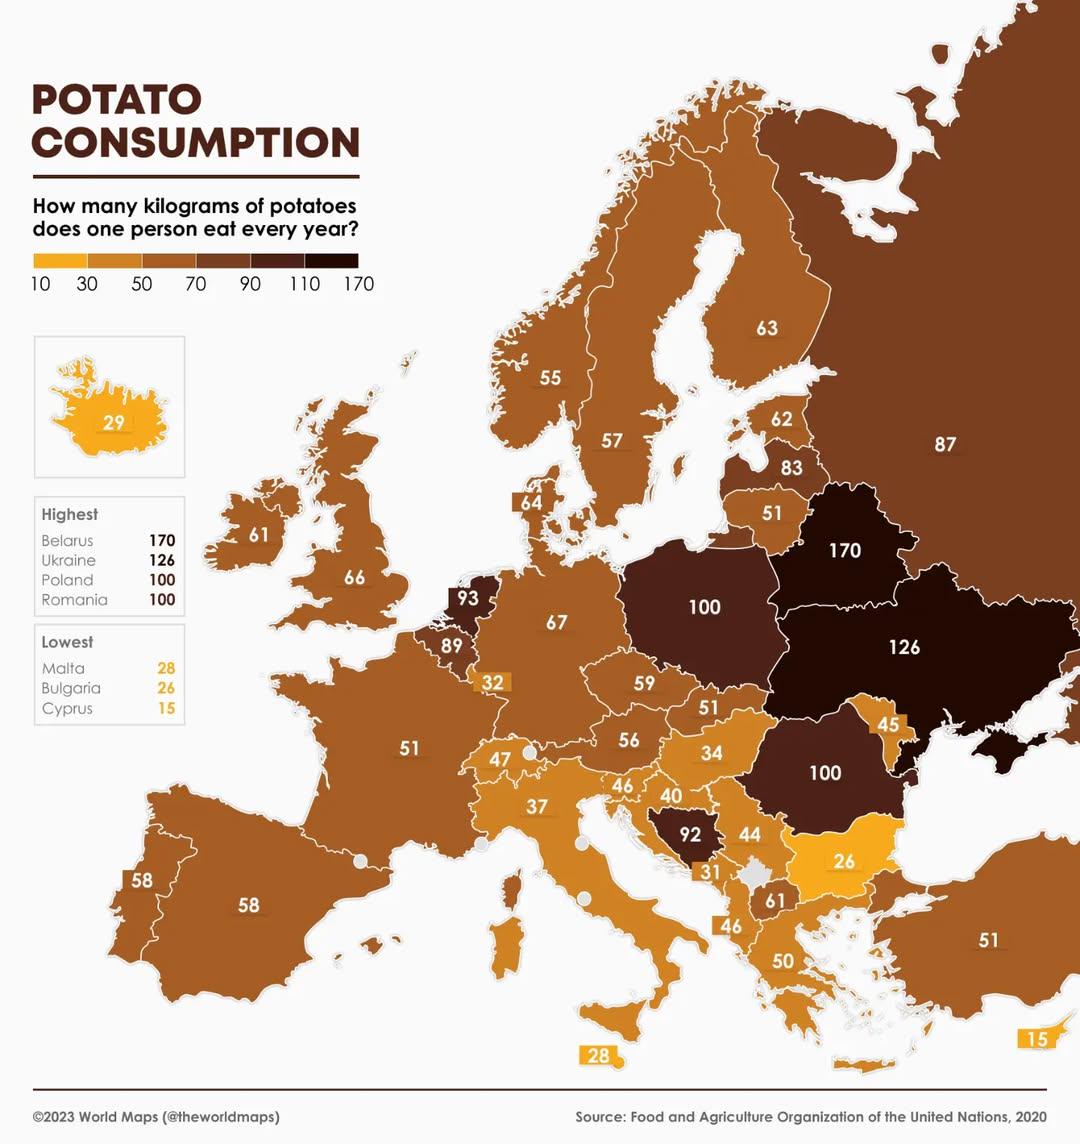
Potato Consumption in Europe Map
The "Potato Consumption in Europe Map" provides a clear visual representation of the average potato consumption per capi...
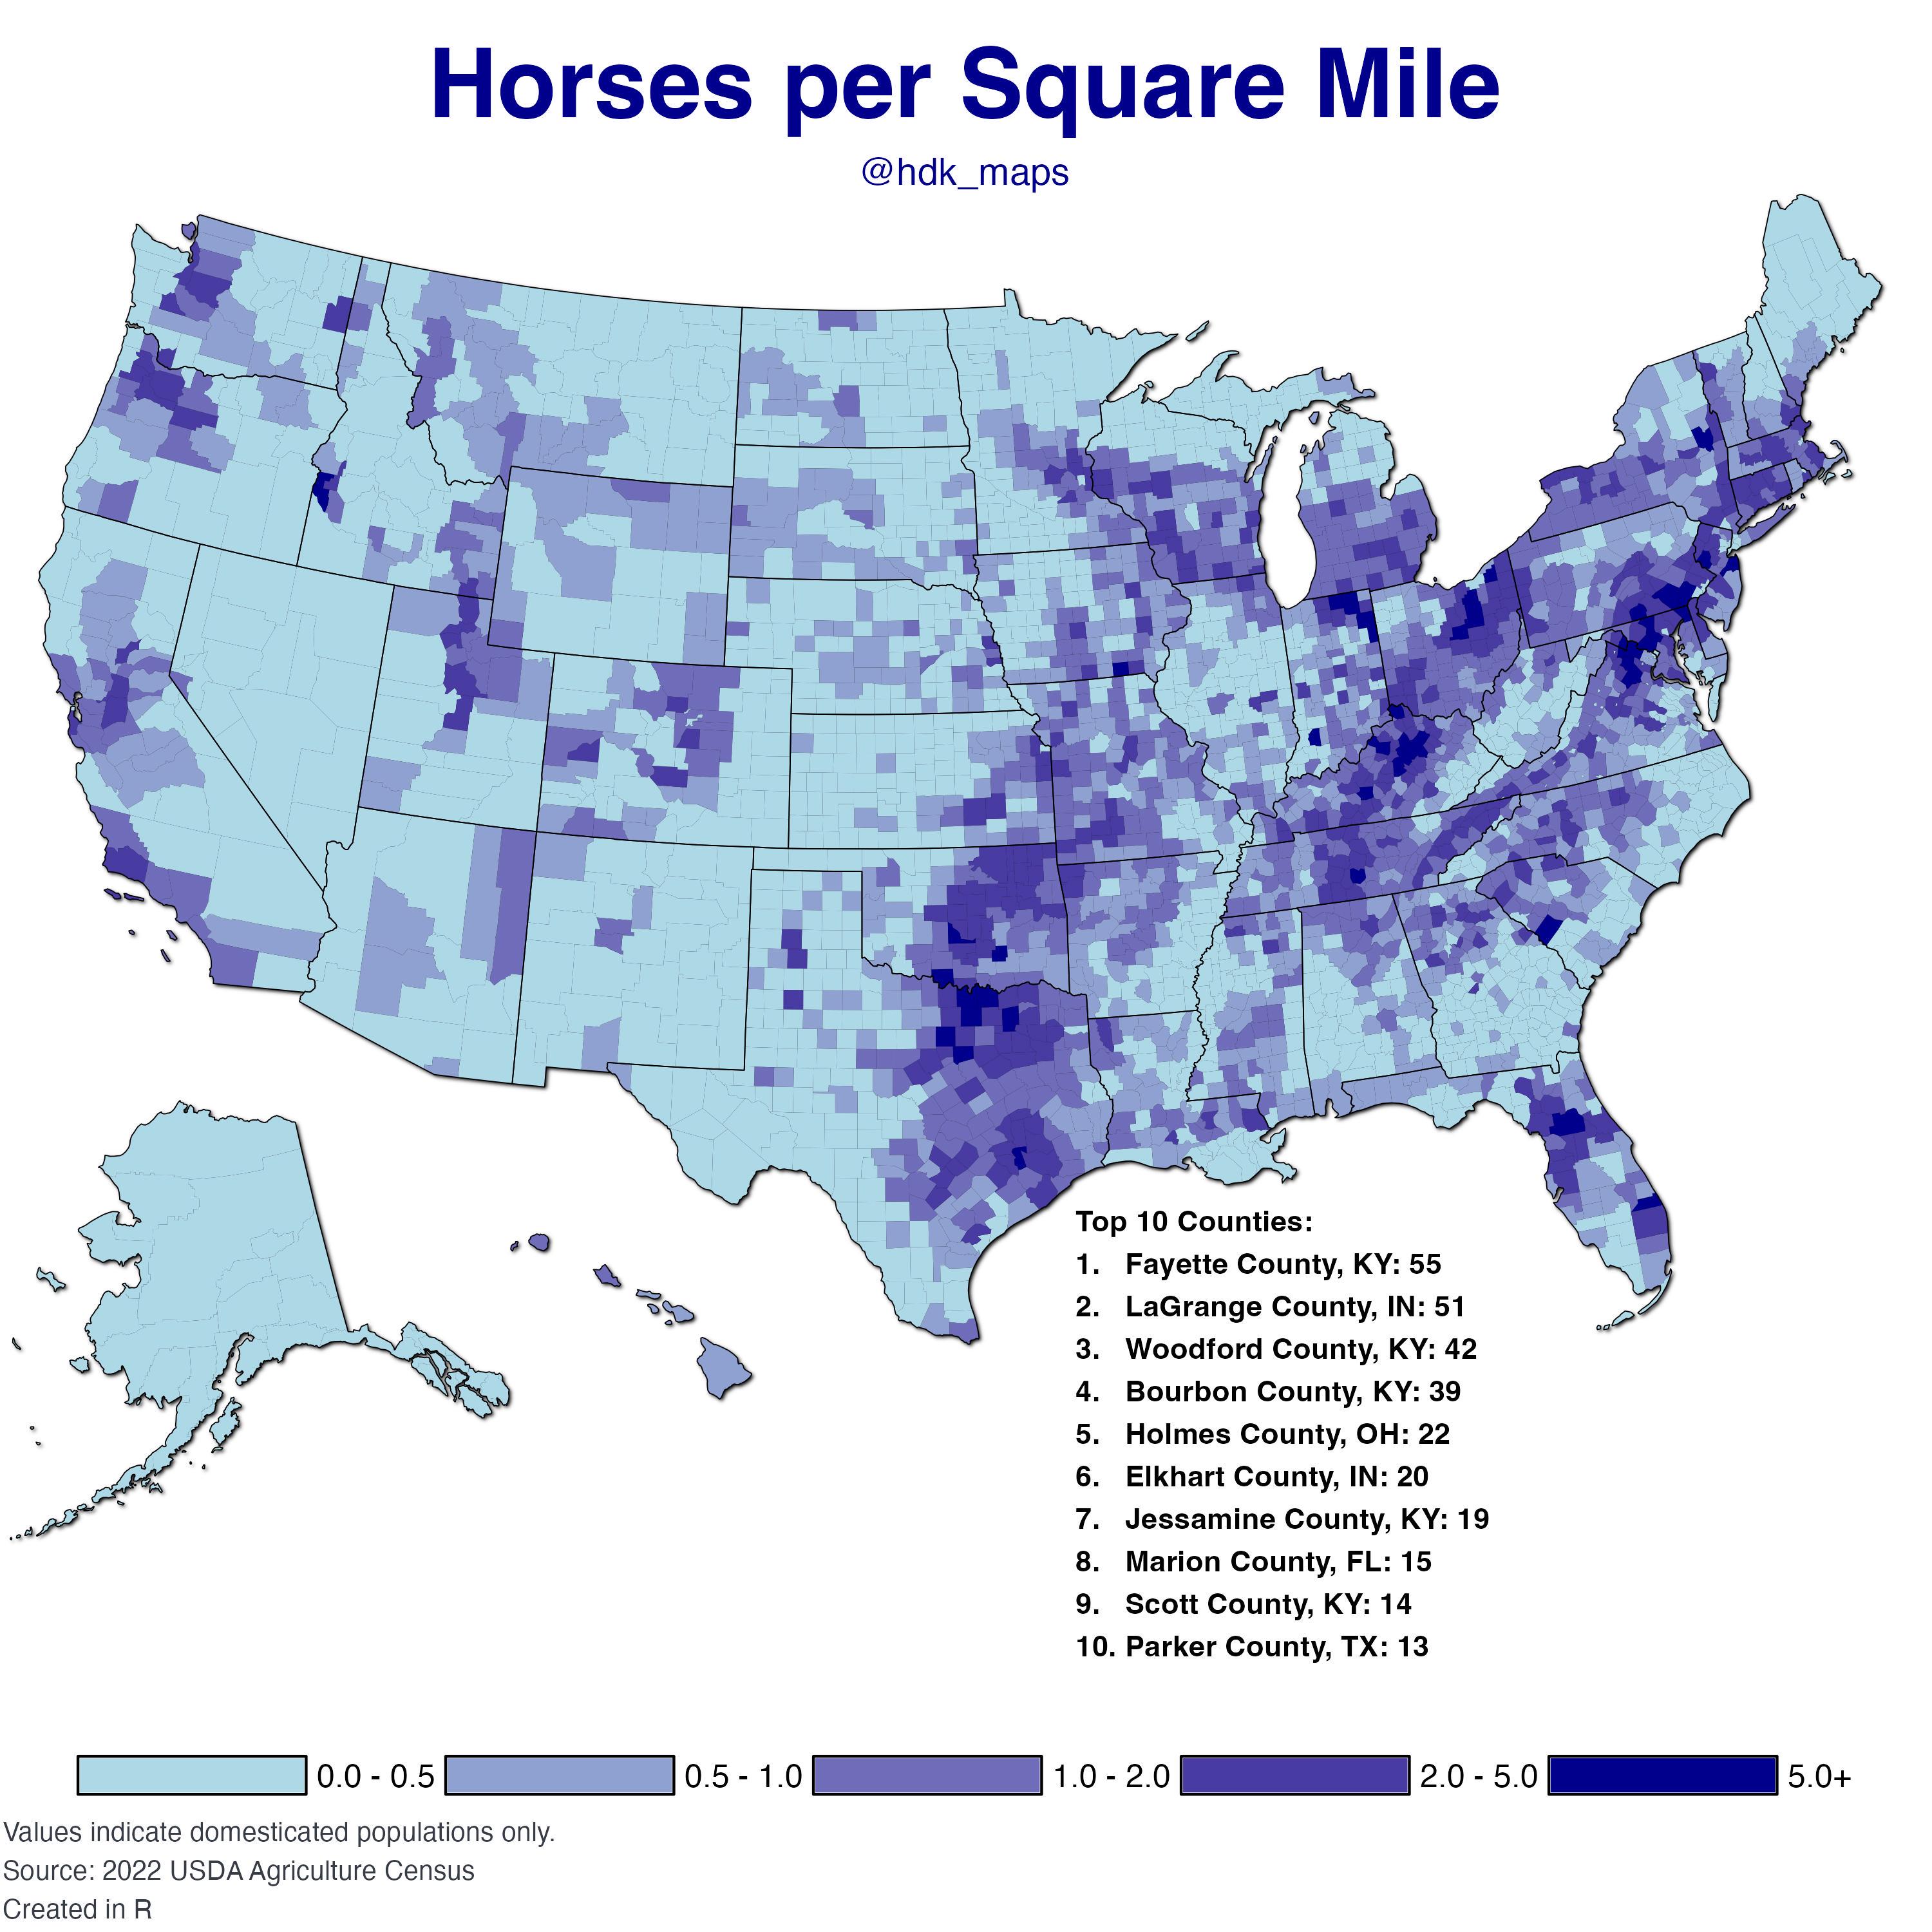
Horses per Square Mile in the USA Map
The "Horses per Square Mile in the USA Map" provides a fascinating visualization of the distribution of horses across th...
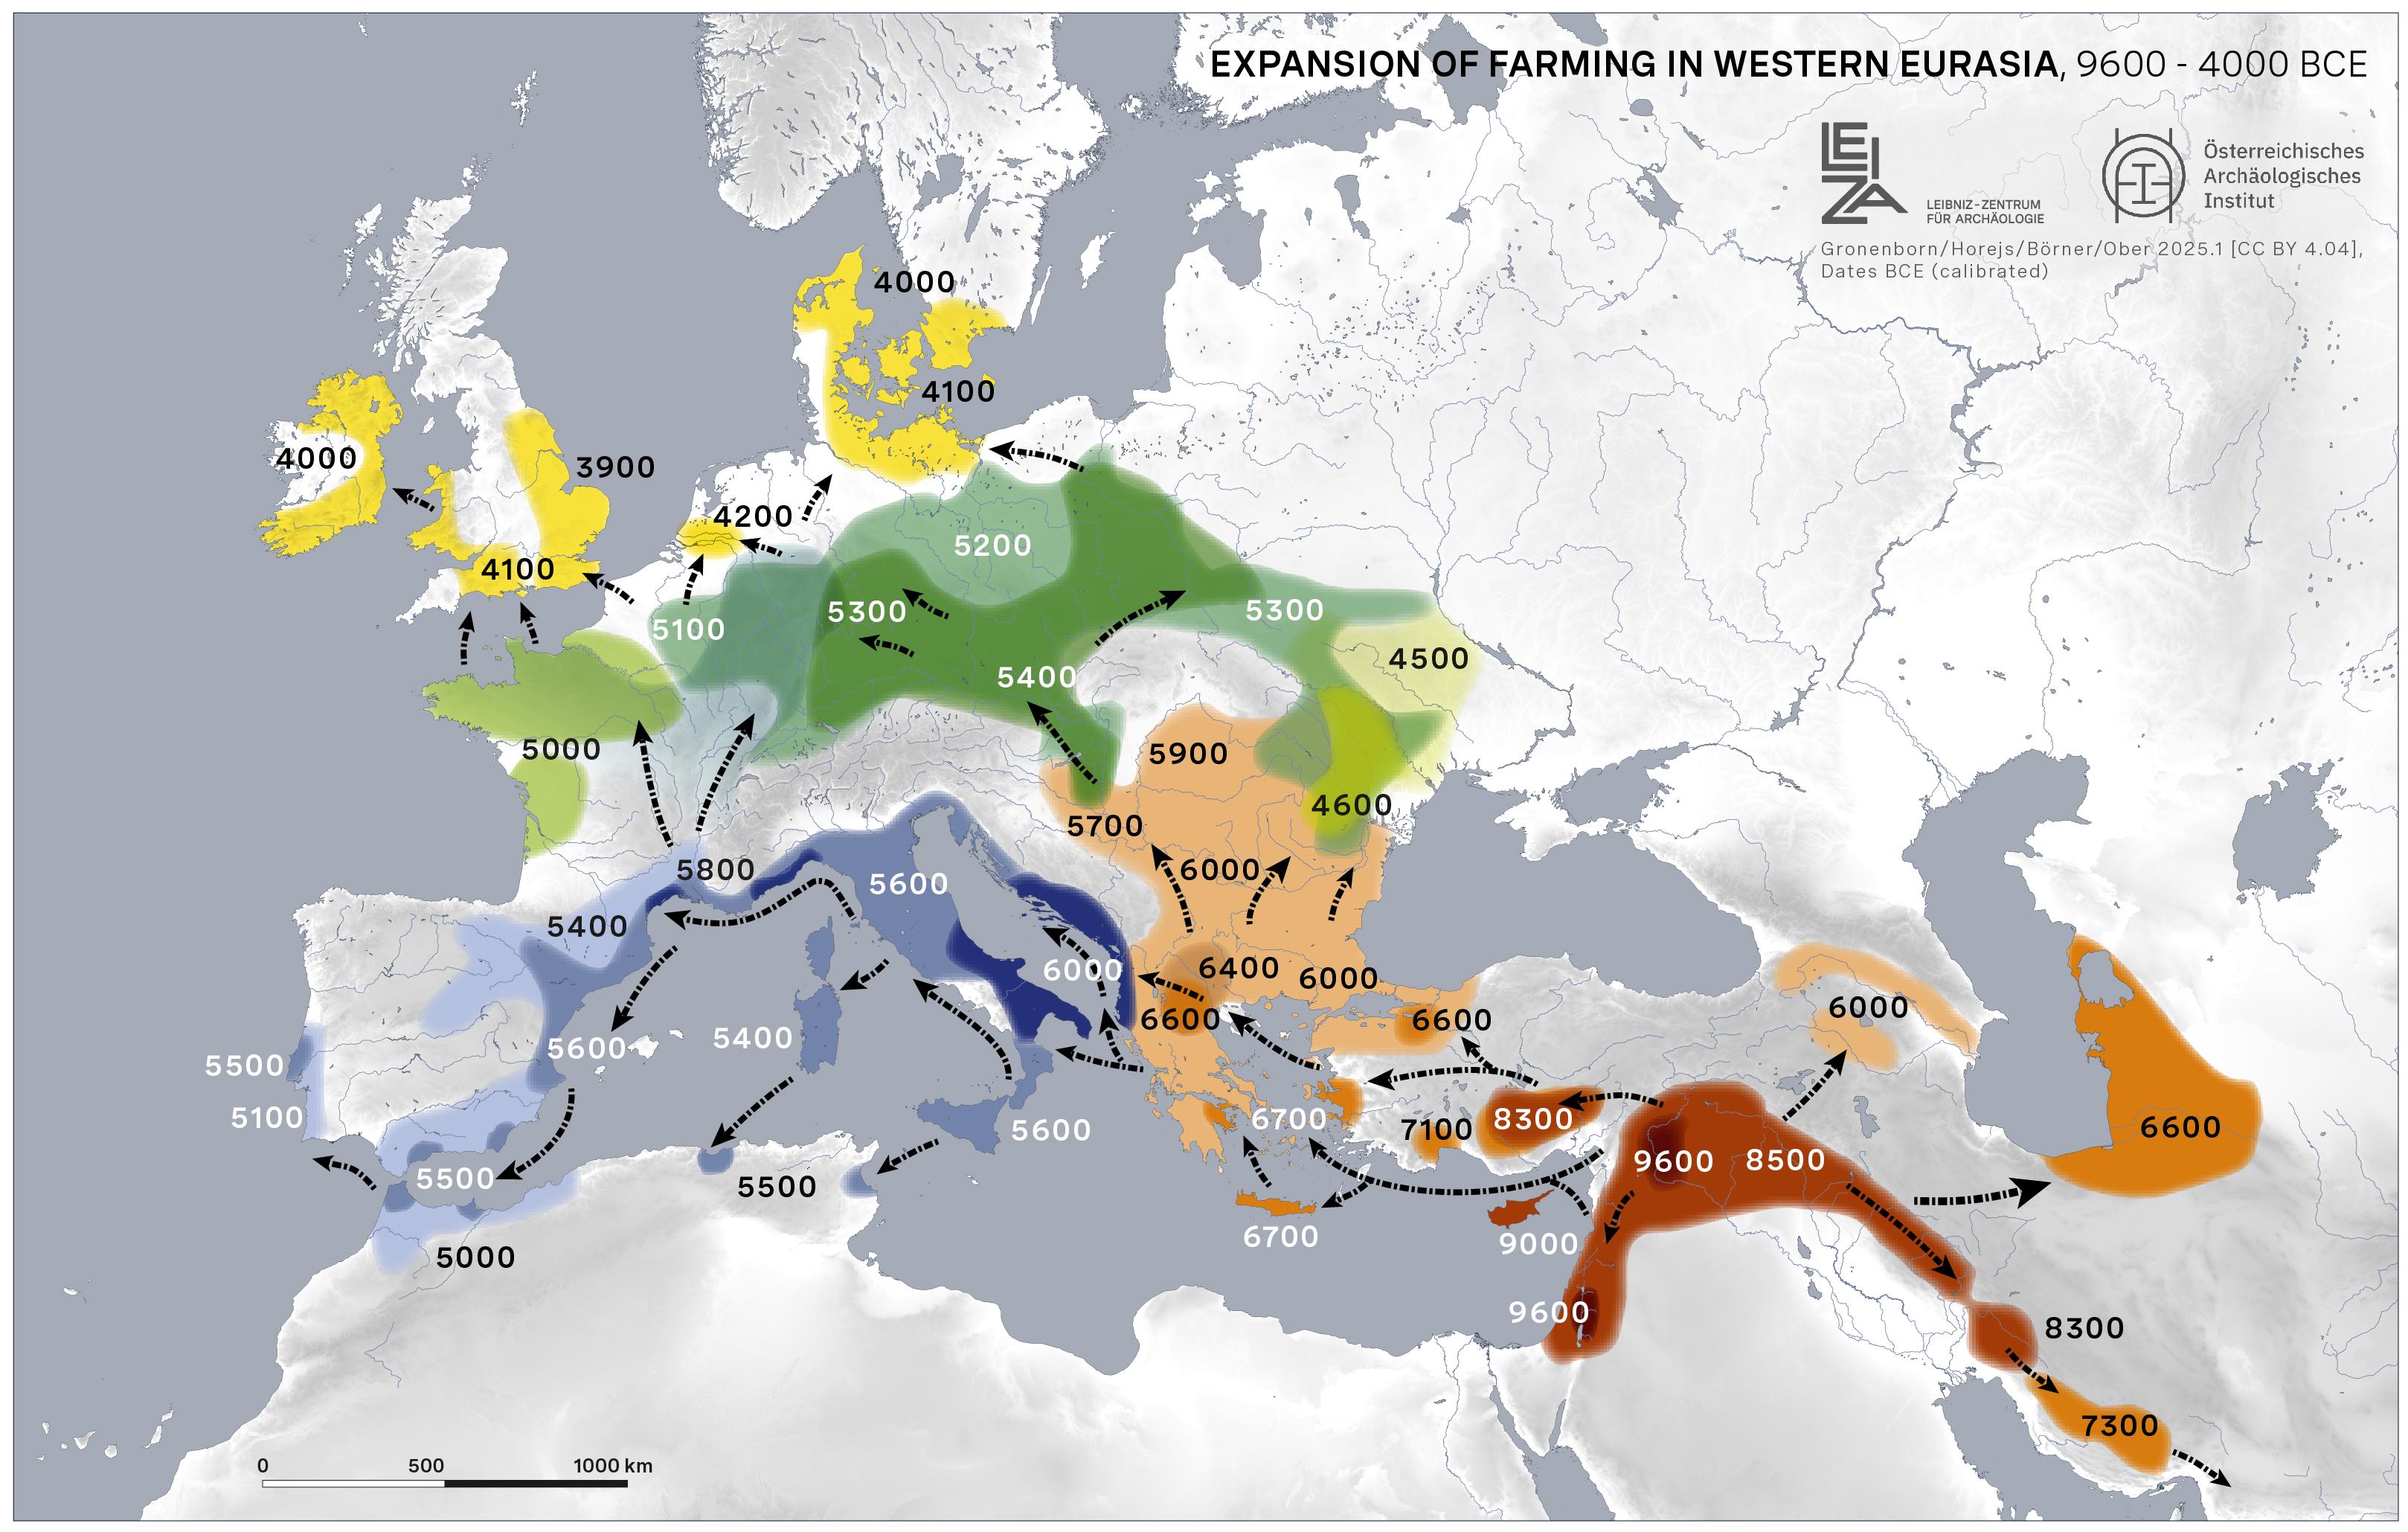
Farming Expansion Map in Western Eurasia, 9600-4000 BCE
The map titled "Expansion of Farming in Western Eurasia, 9600-4000 BCE" illustrates the spatial distribution and growth ...
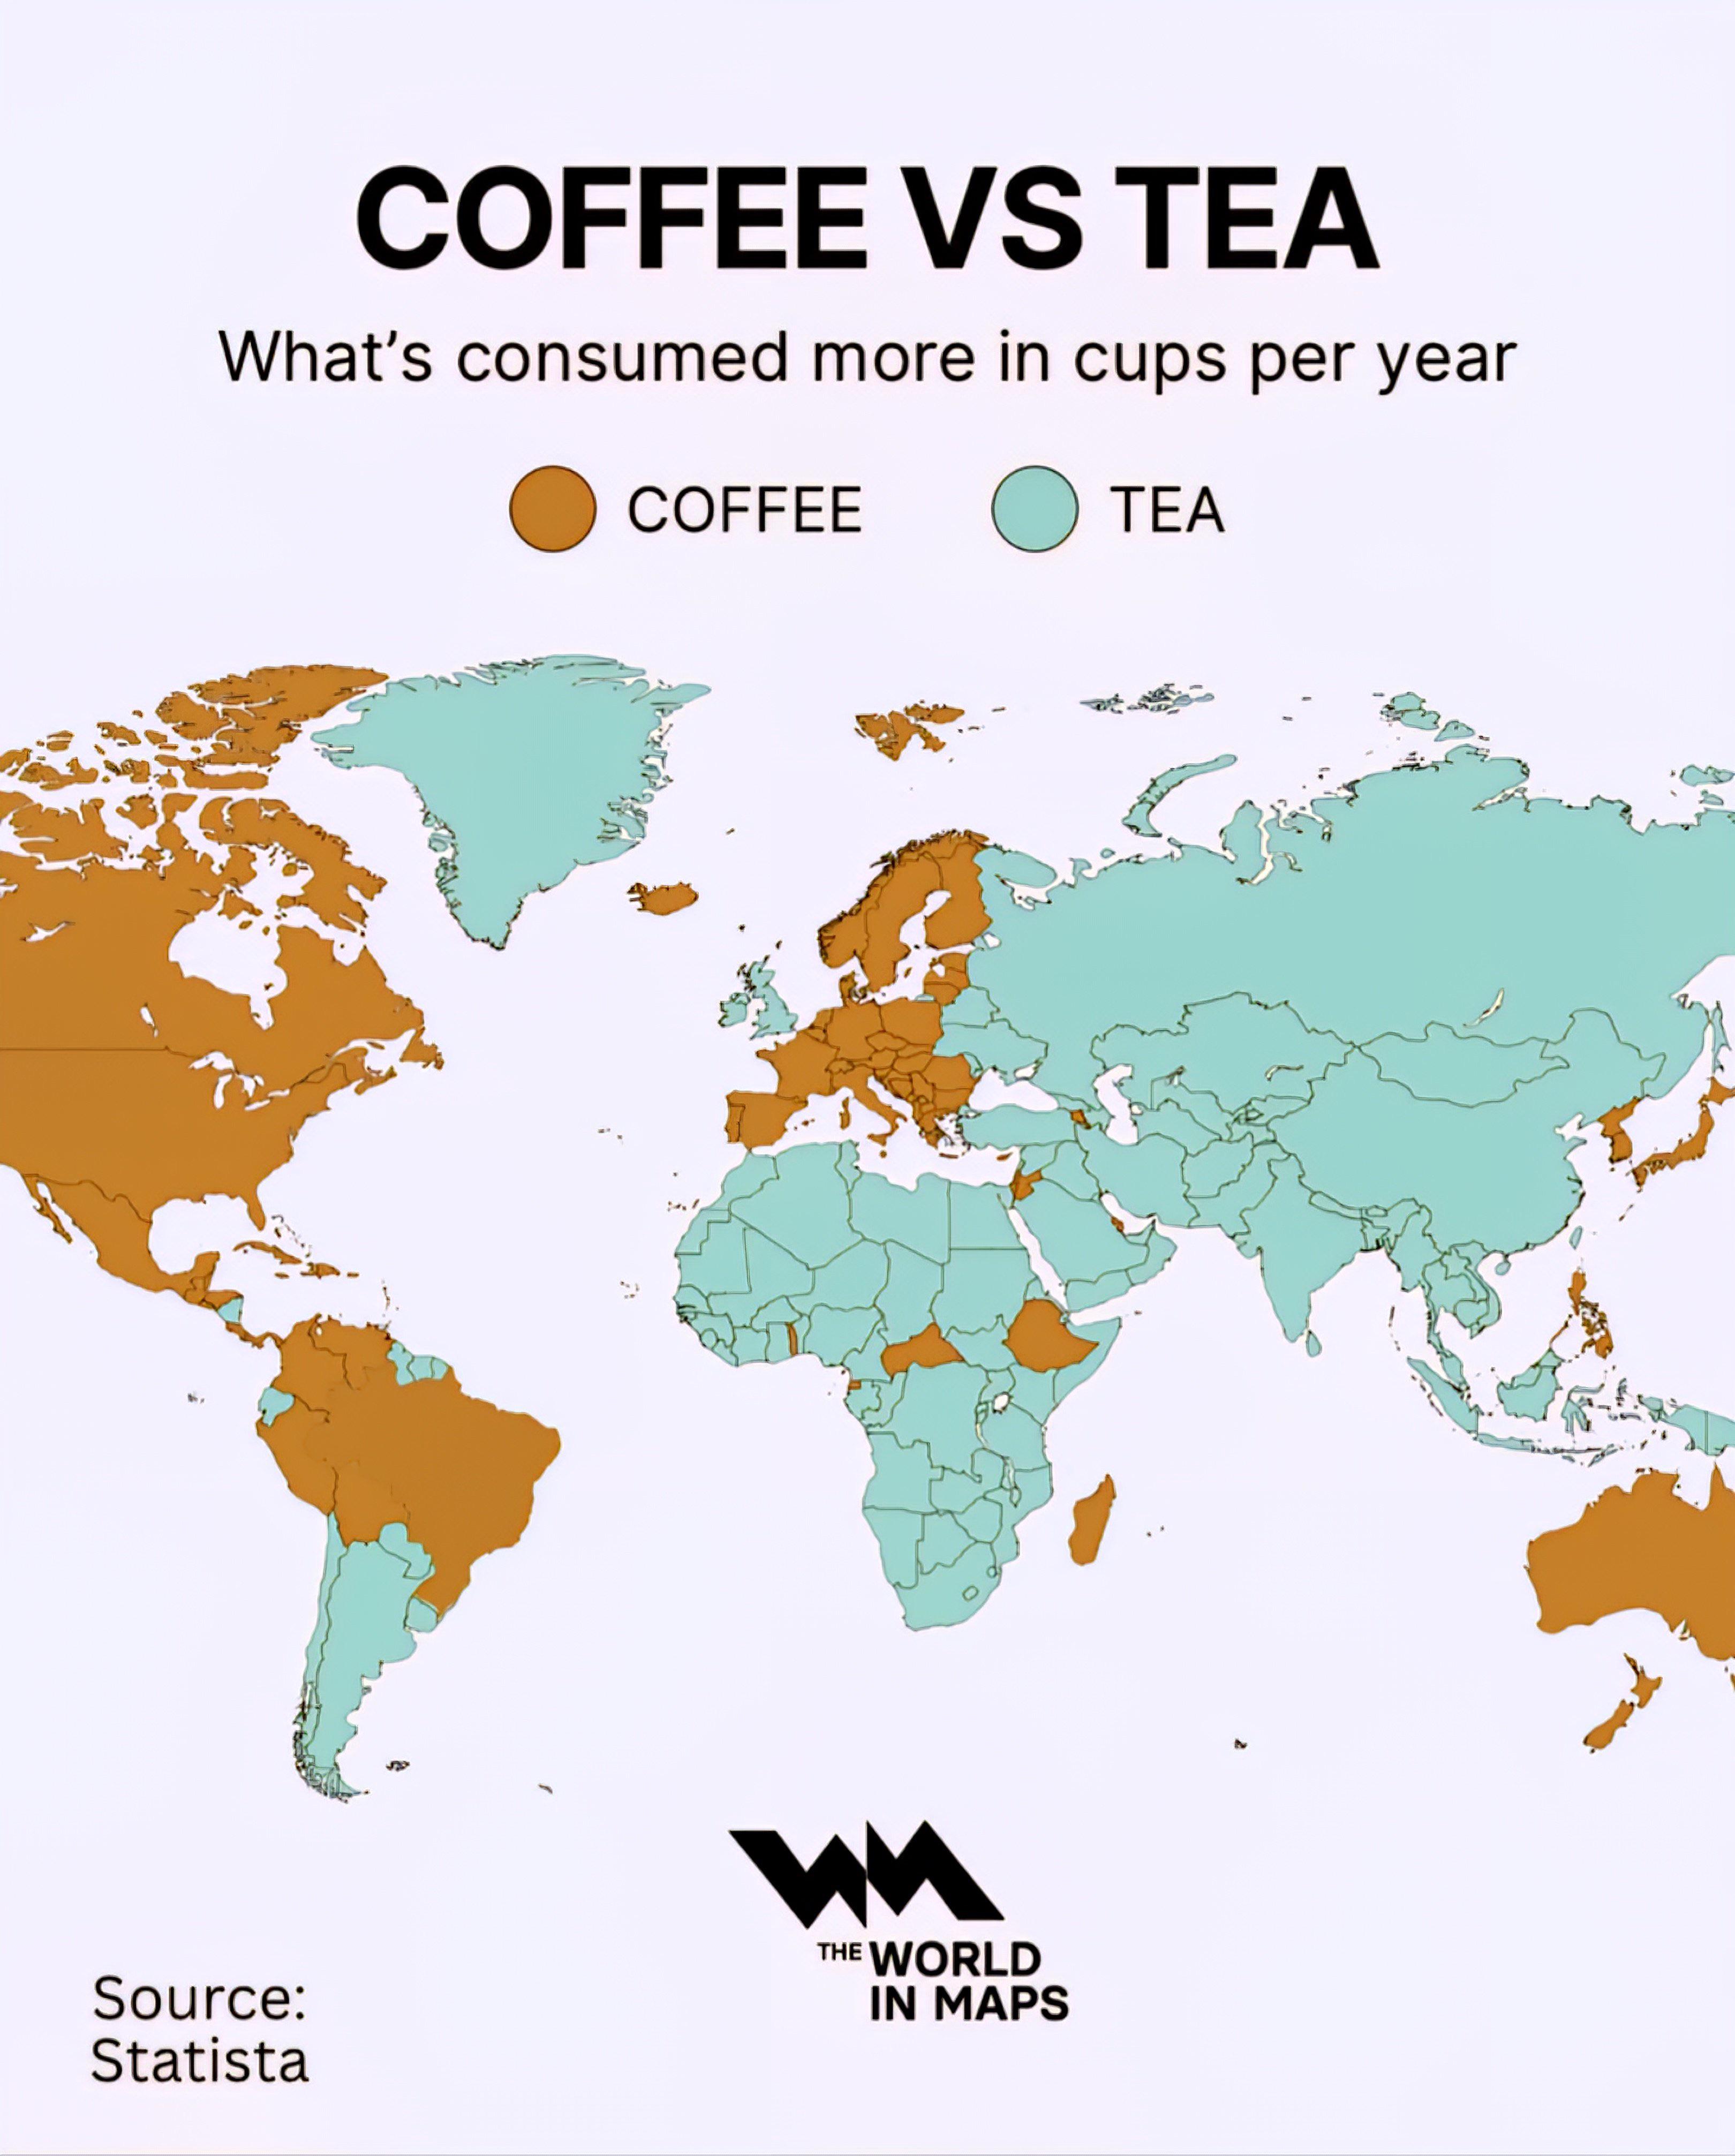
Coffee vs Tea Production Map
...
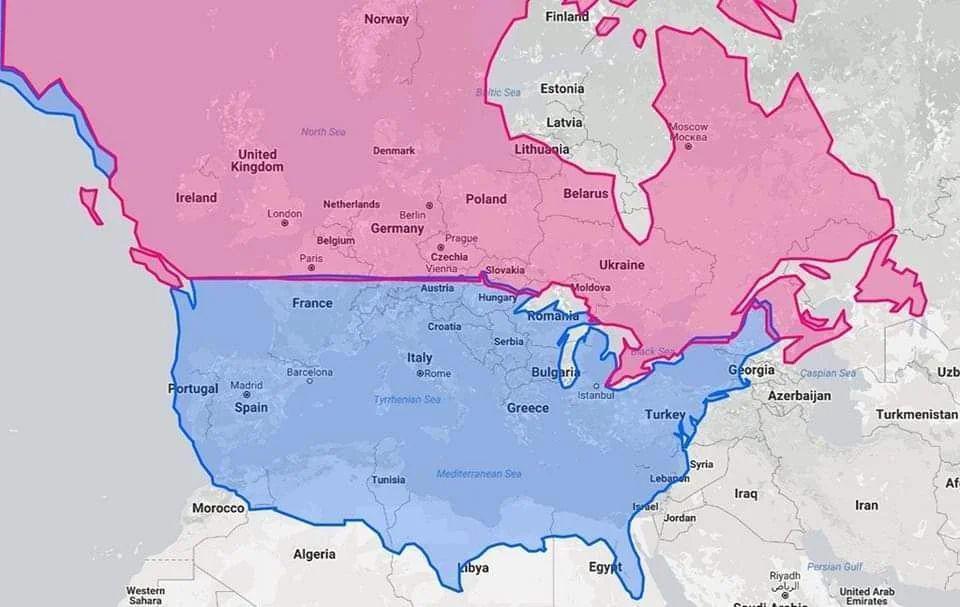
Latitude Map of United States, Canada, and Europe
The visualization titled "United States & Canada in same latitude w/ Europe" highlights the parallels of latitude that c...
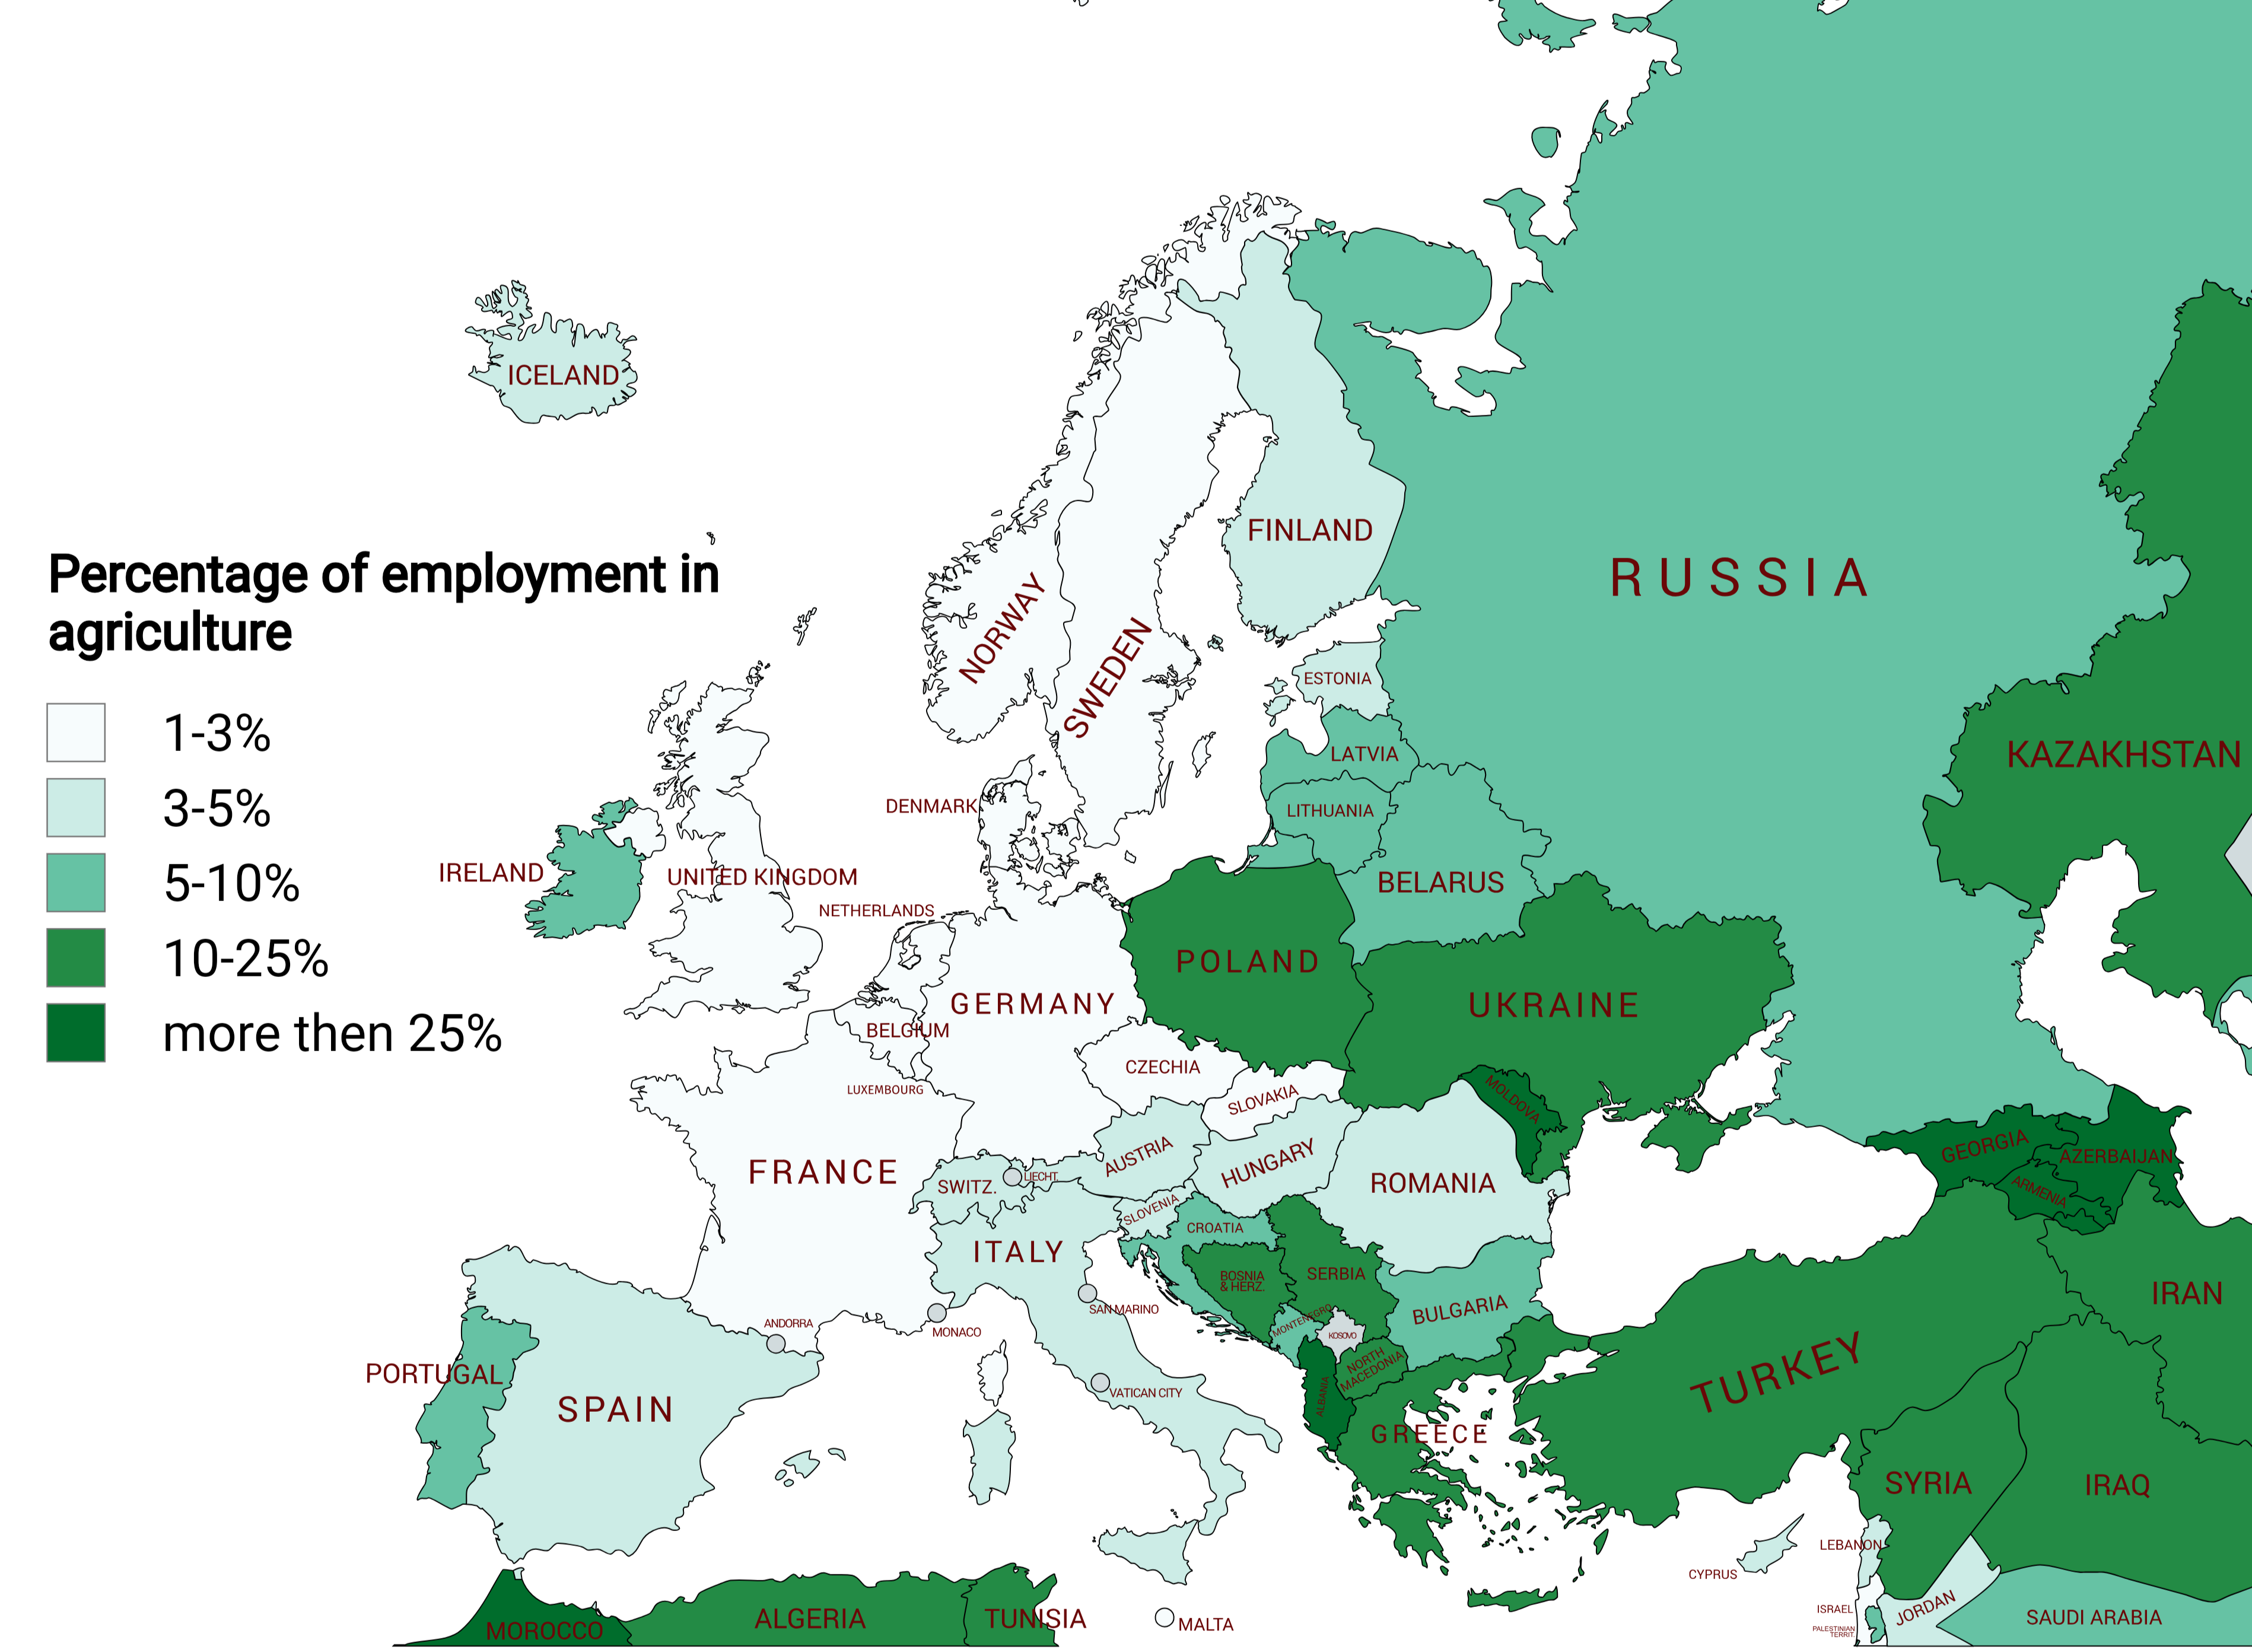
Agricultural Employment Percentage Map of Europe
The "Agricultural Employment Percentage Map of Europe" provides a clear visual representation of the proportion of total...
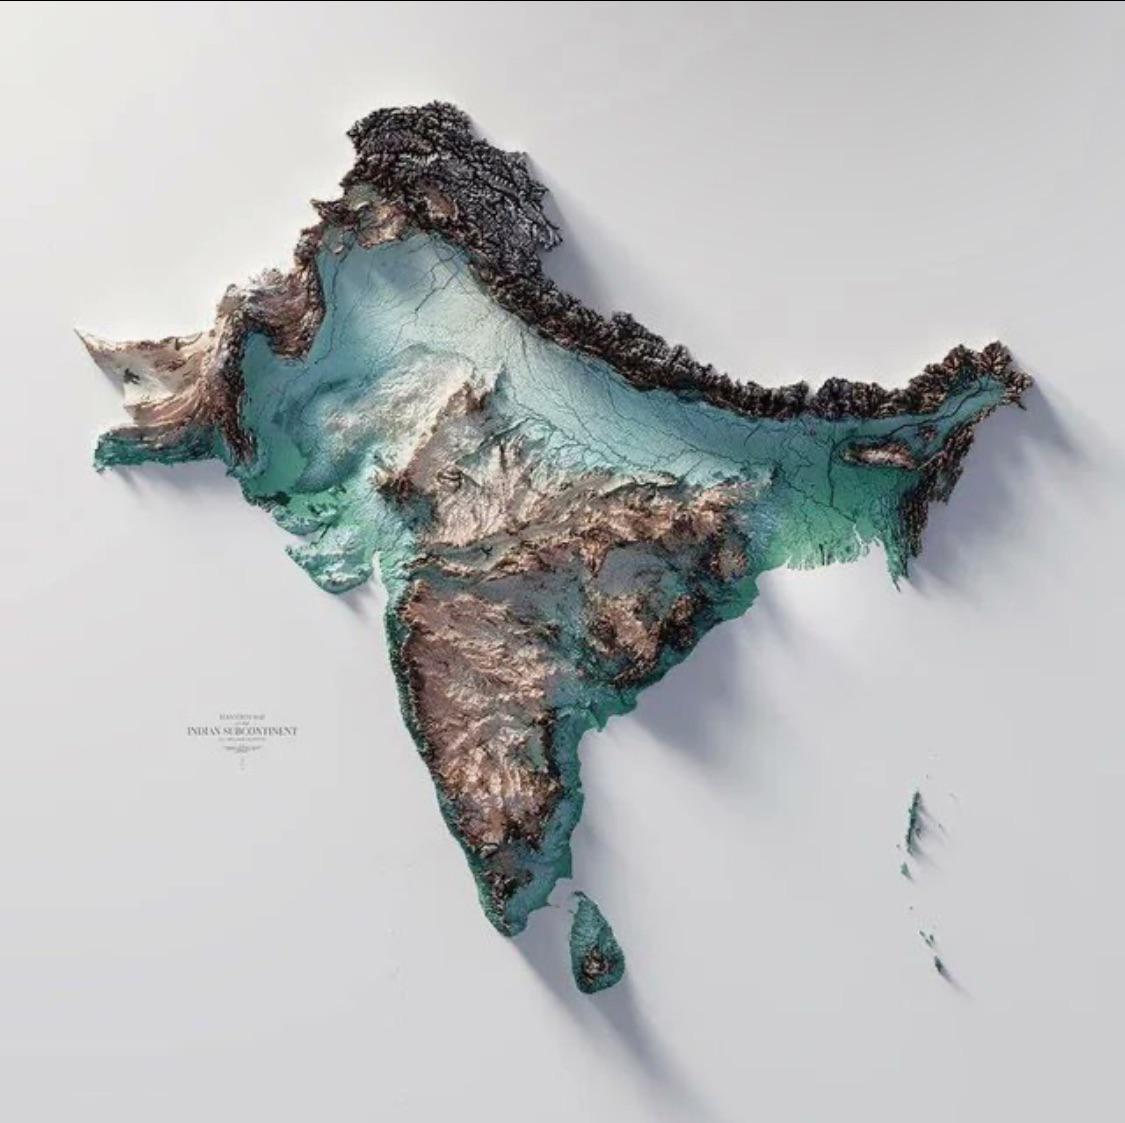
Geographical Map of the Indian Subcontinent
The Indo-Gangetic Plain, one of the most densely populated regions in the world, is another striking feature of the subc...
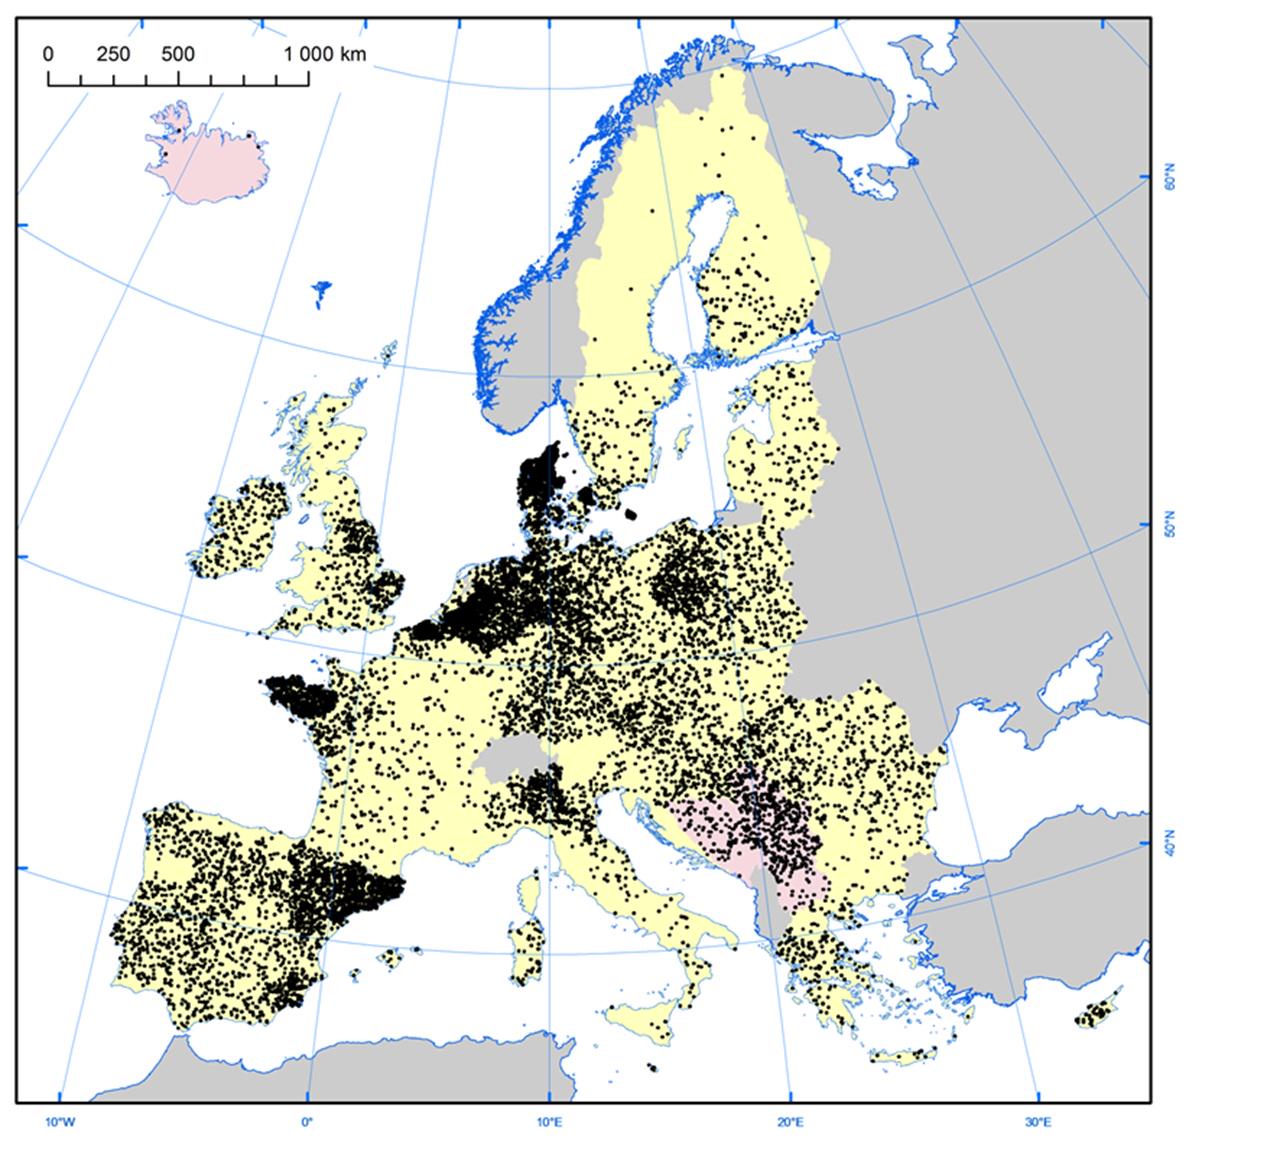
Pig Farms in Europe Map
The "Pig Farms in Europe Map" provides a comprehensive overview of pig farming locations across the continent, highlight...
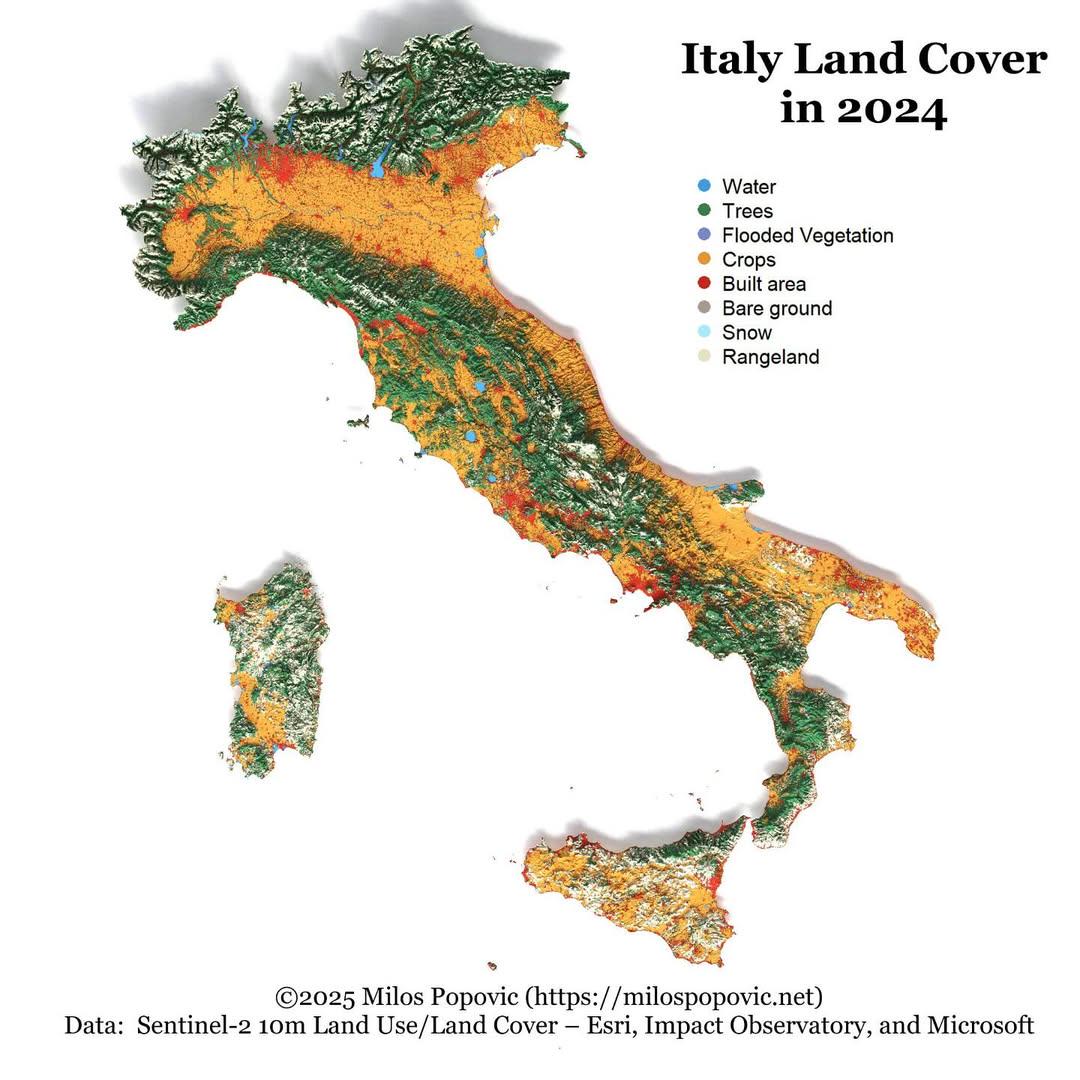
Italy Land Cover Map 2024
The "Italy Land Cover Map 2024" provides a comprehensive visualization of the various land cover types across Italy, ill...
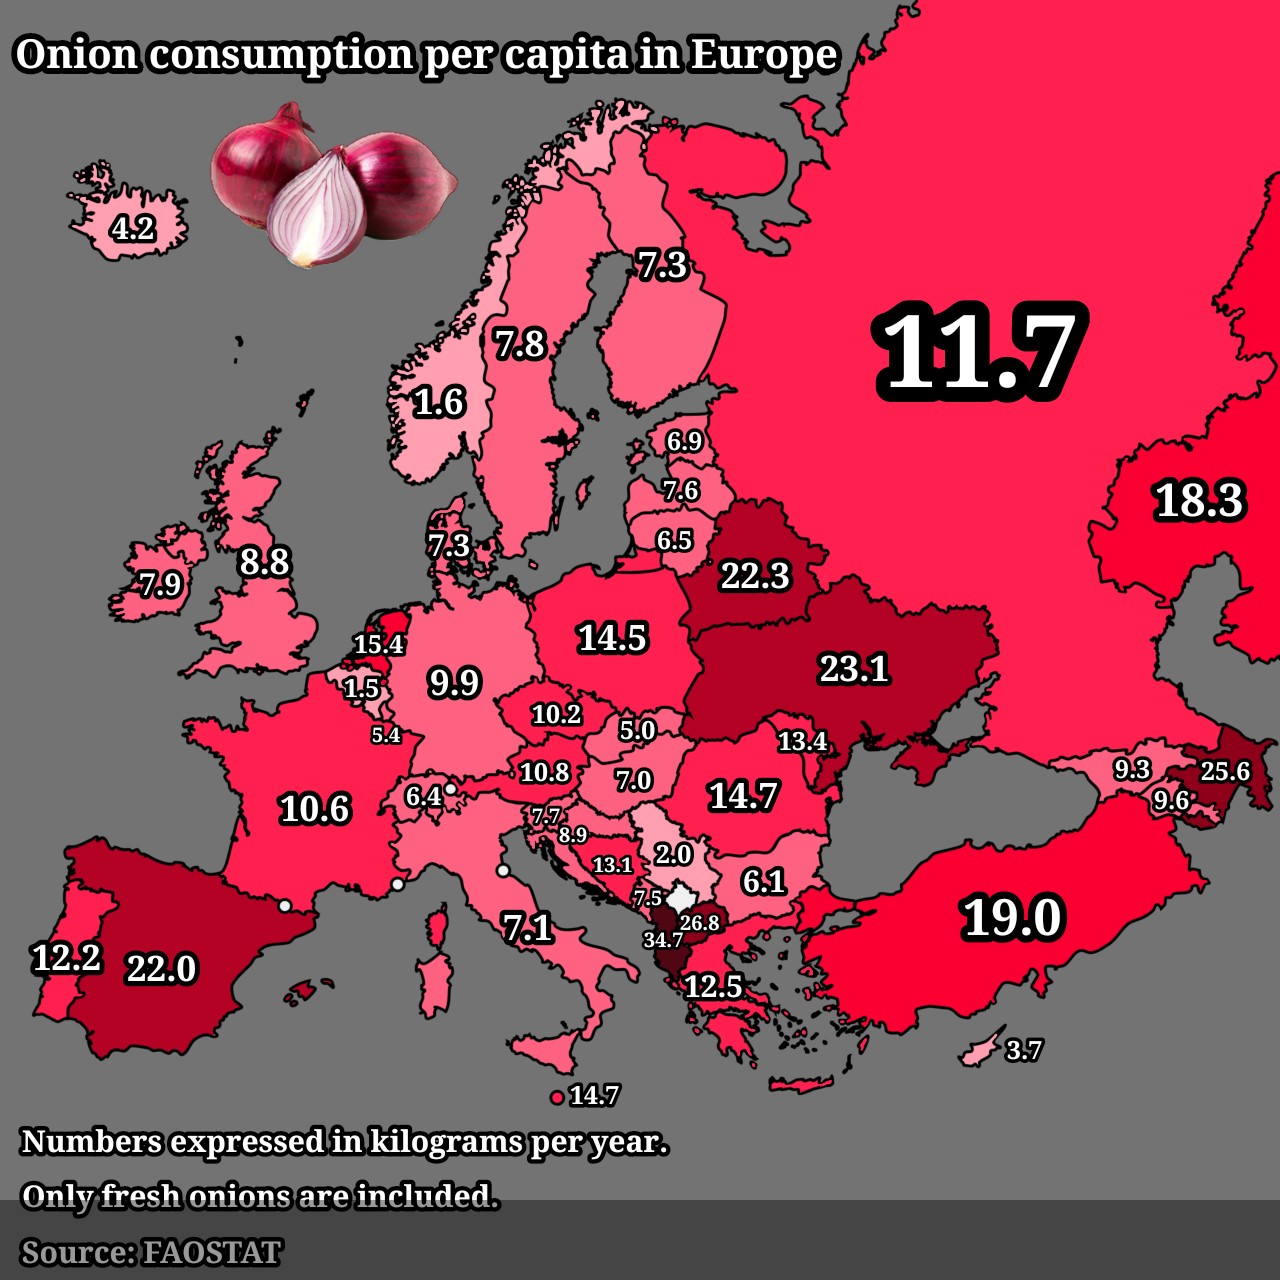
Onion Consumption Per Capita in Europe Map
The "Onion Consumption Per Capita in Europe Map" provides a visual representation of how much onions are consumed by ind...
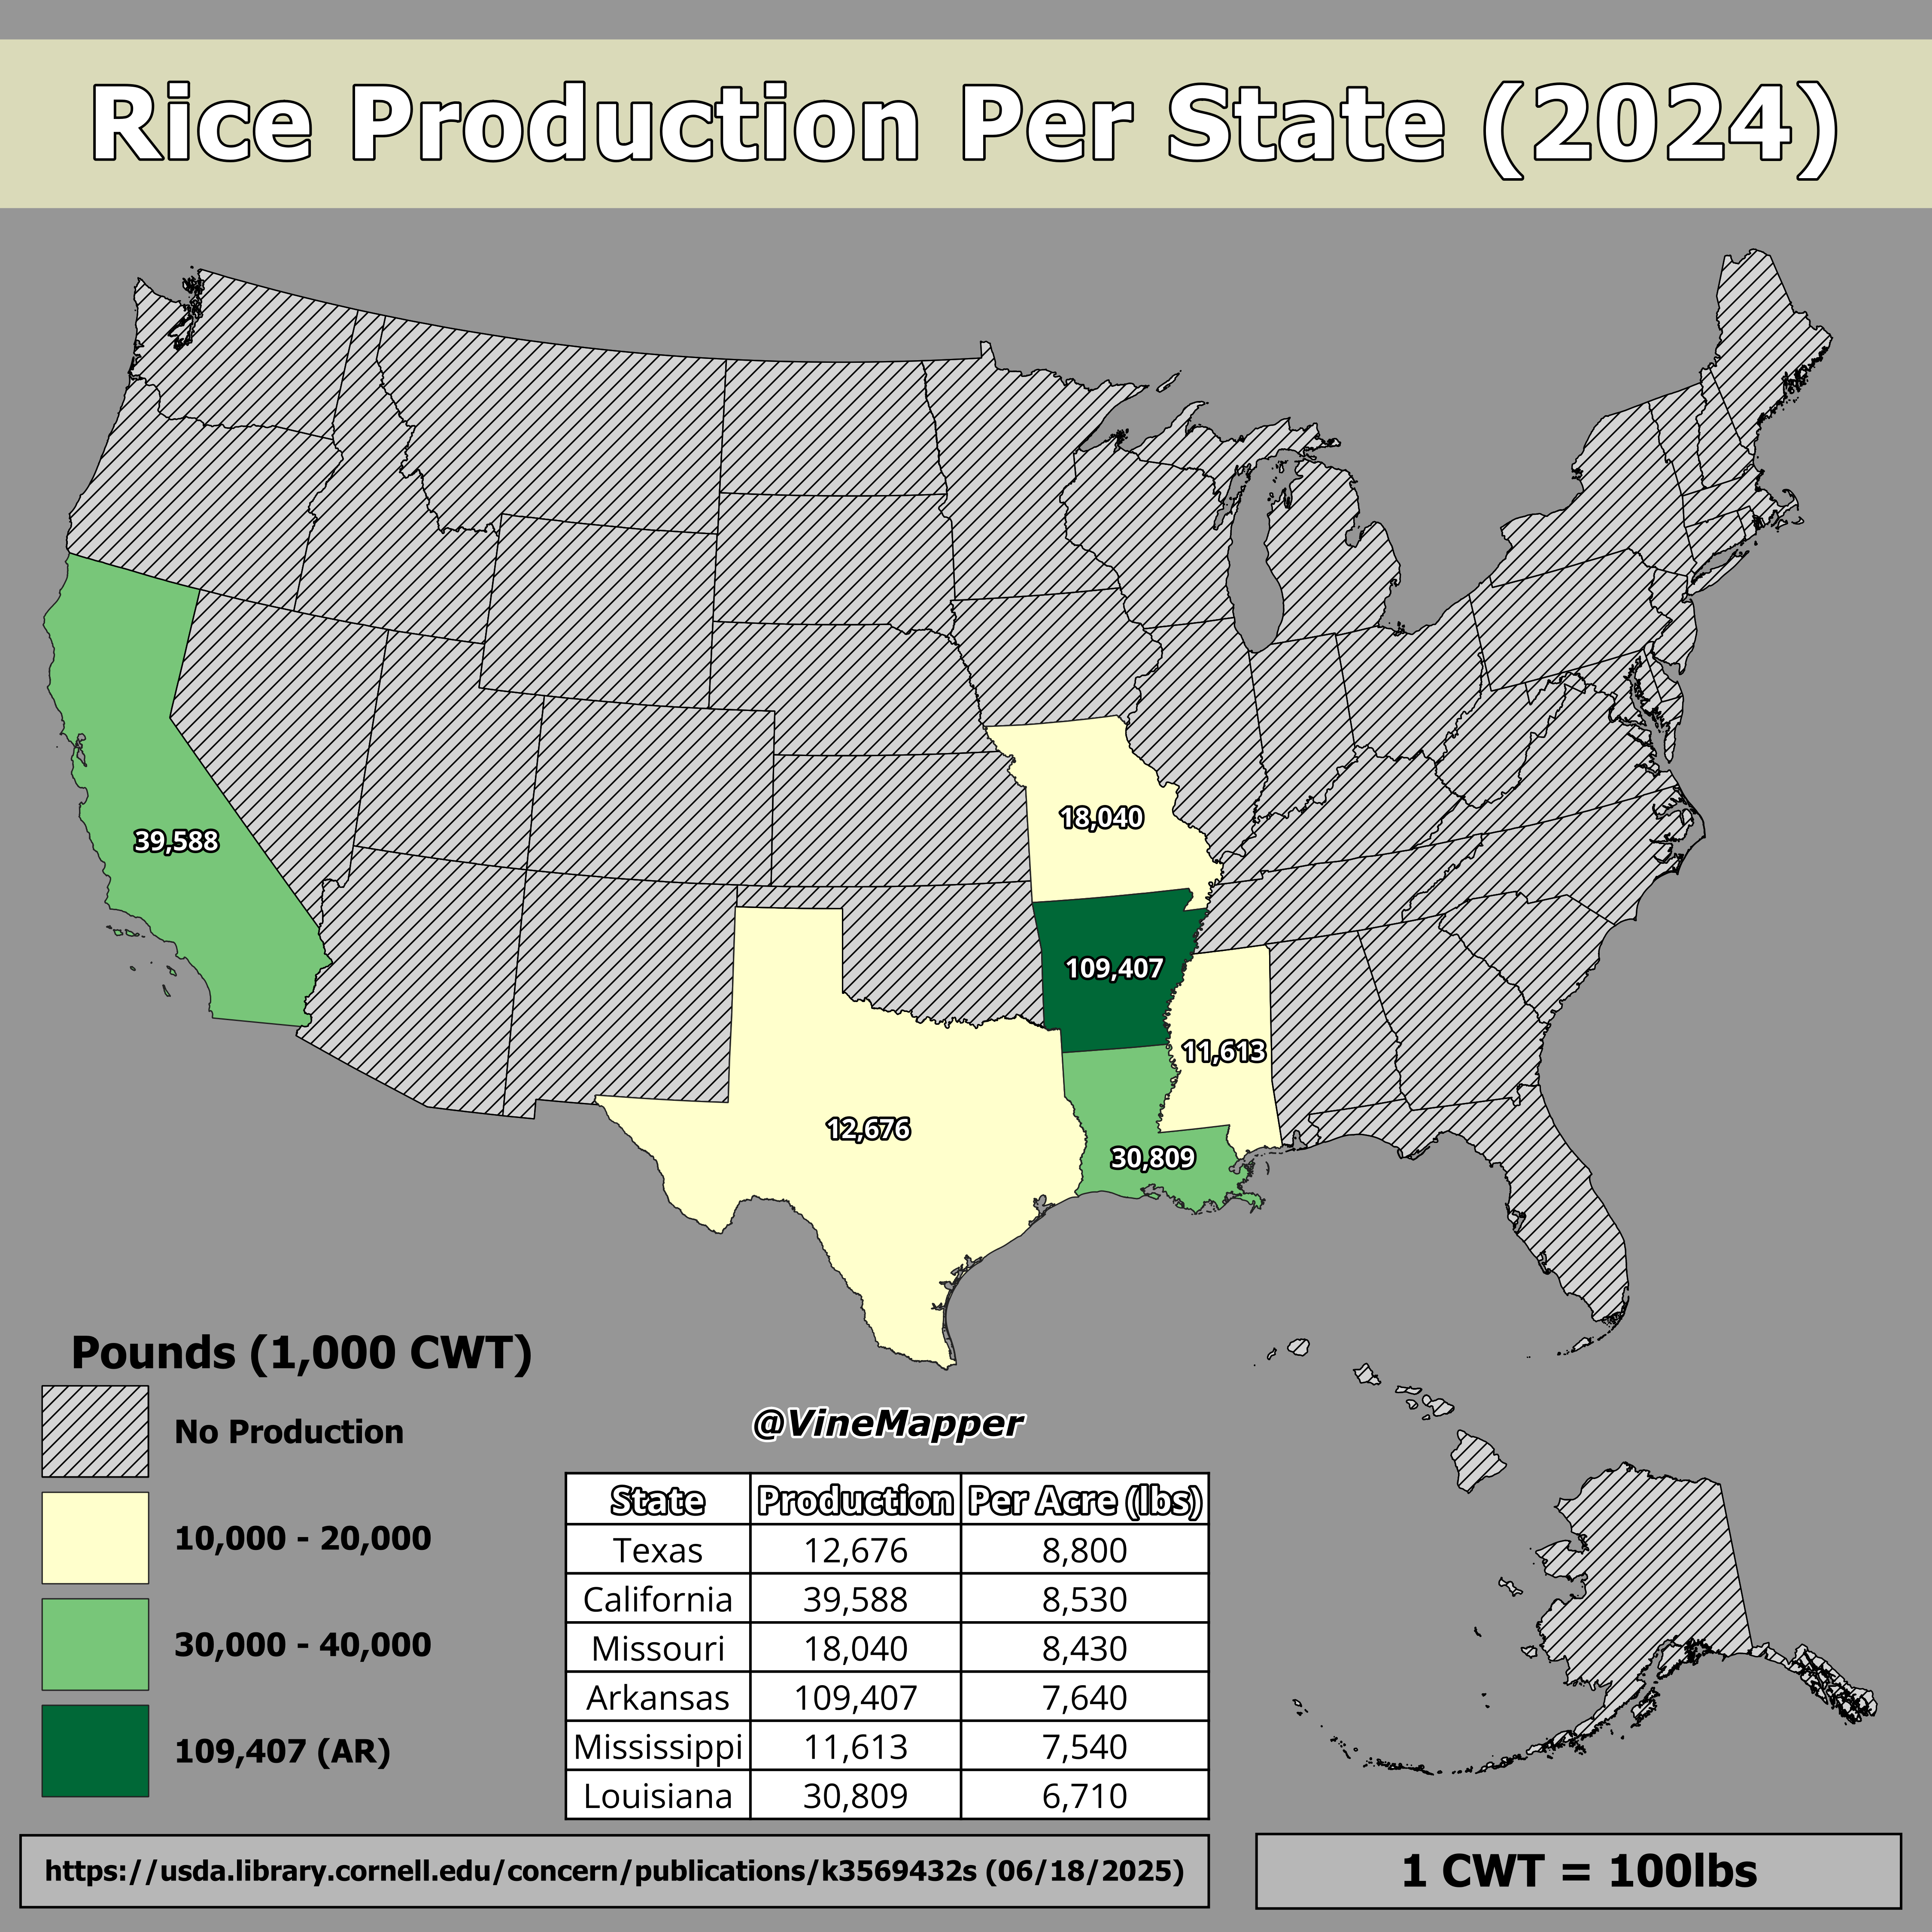
Rice Production Per State Map
The "Rice Production Per State Map" visually represents the volume of rice produced across different states in the Unite...
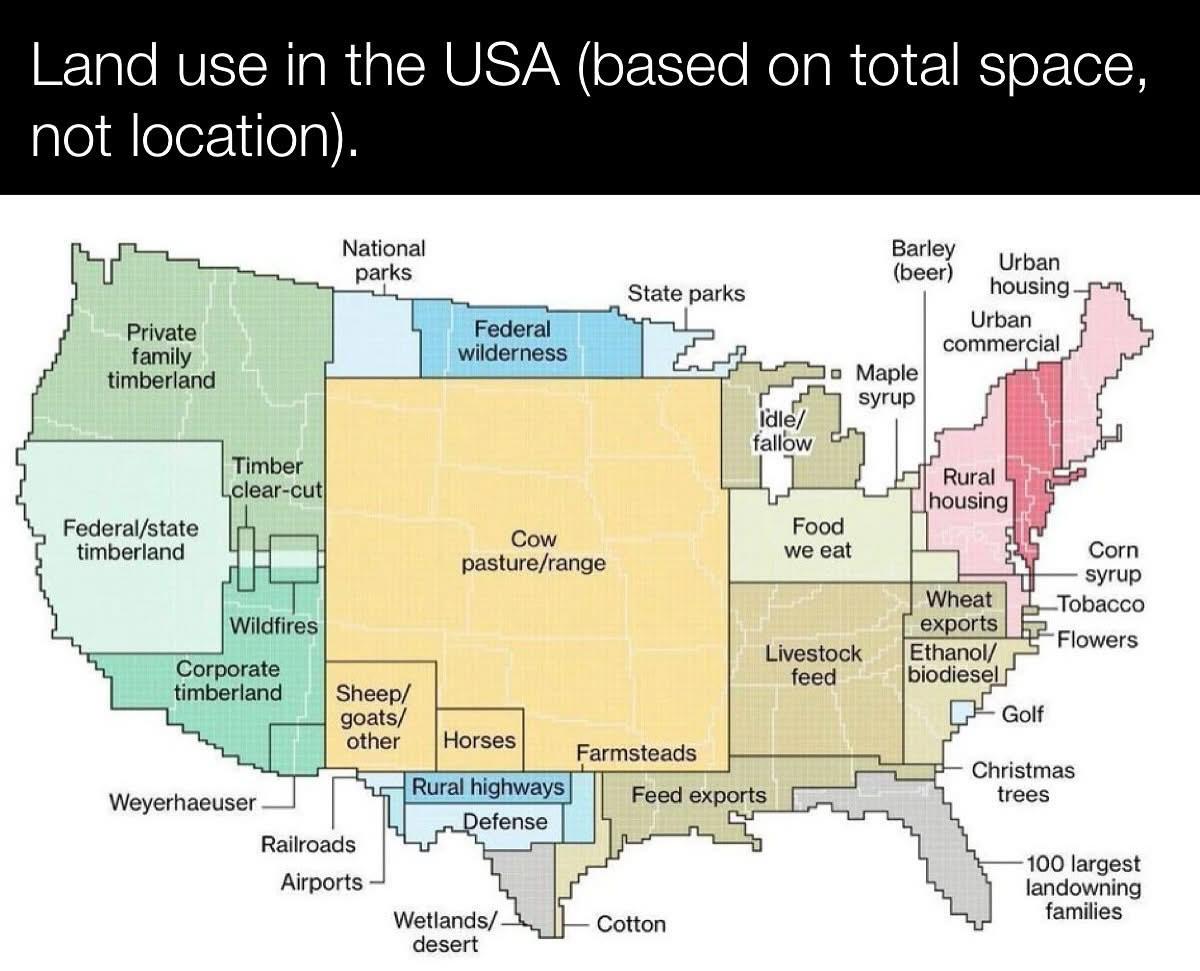
Land Use Map of the USA
The \...
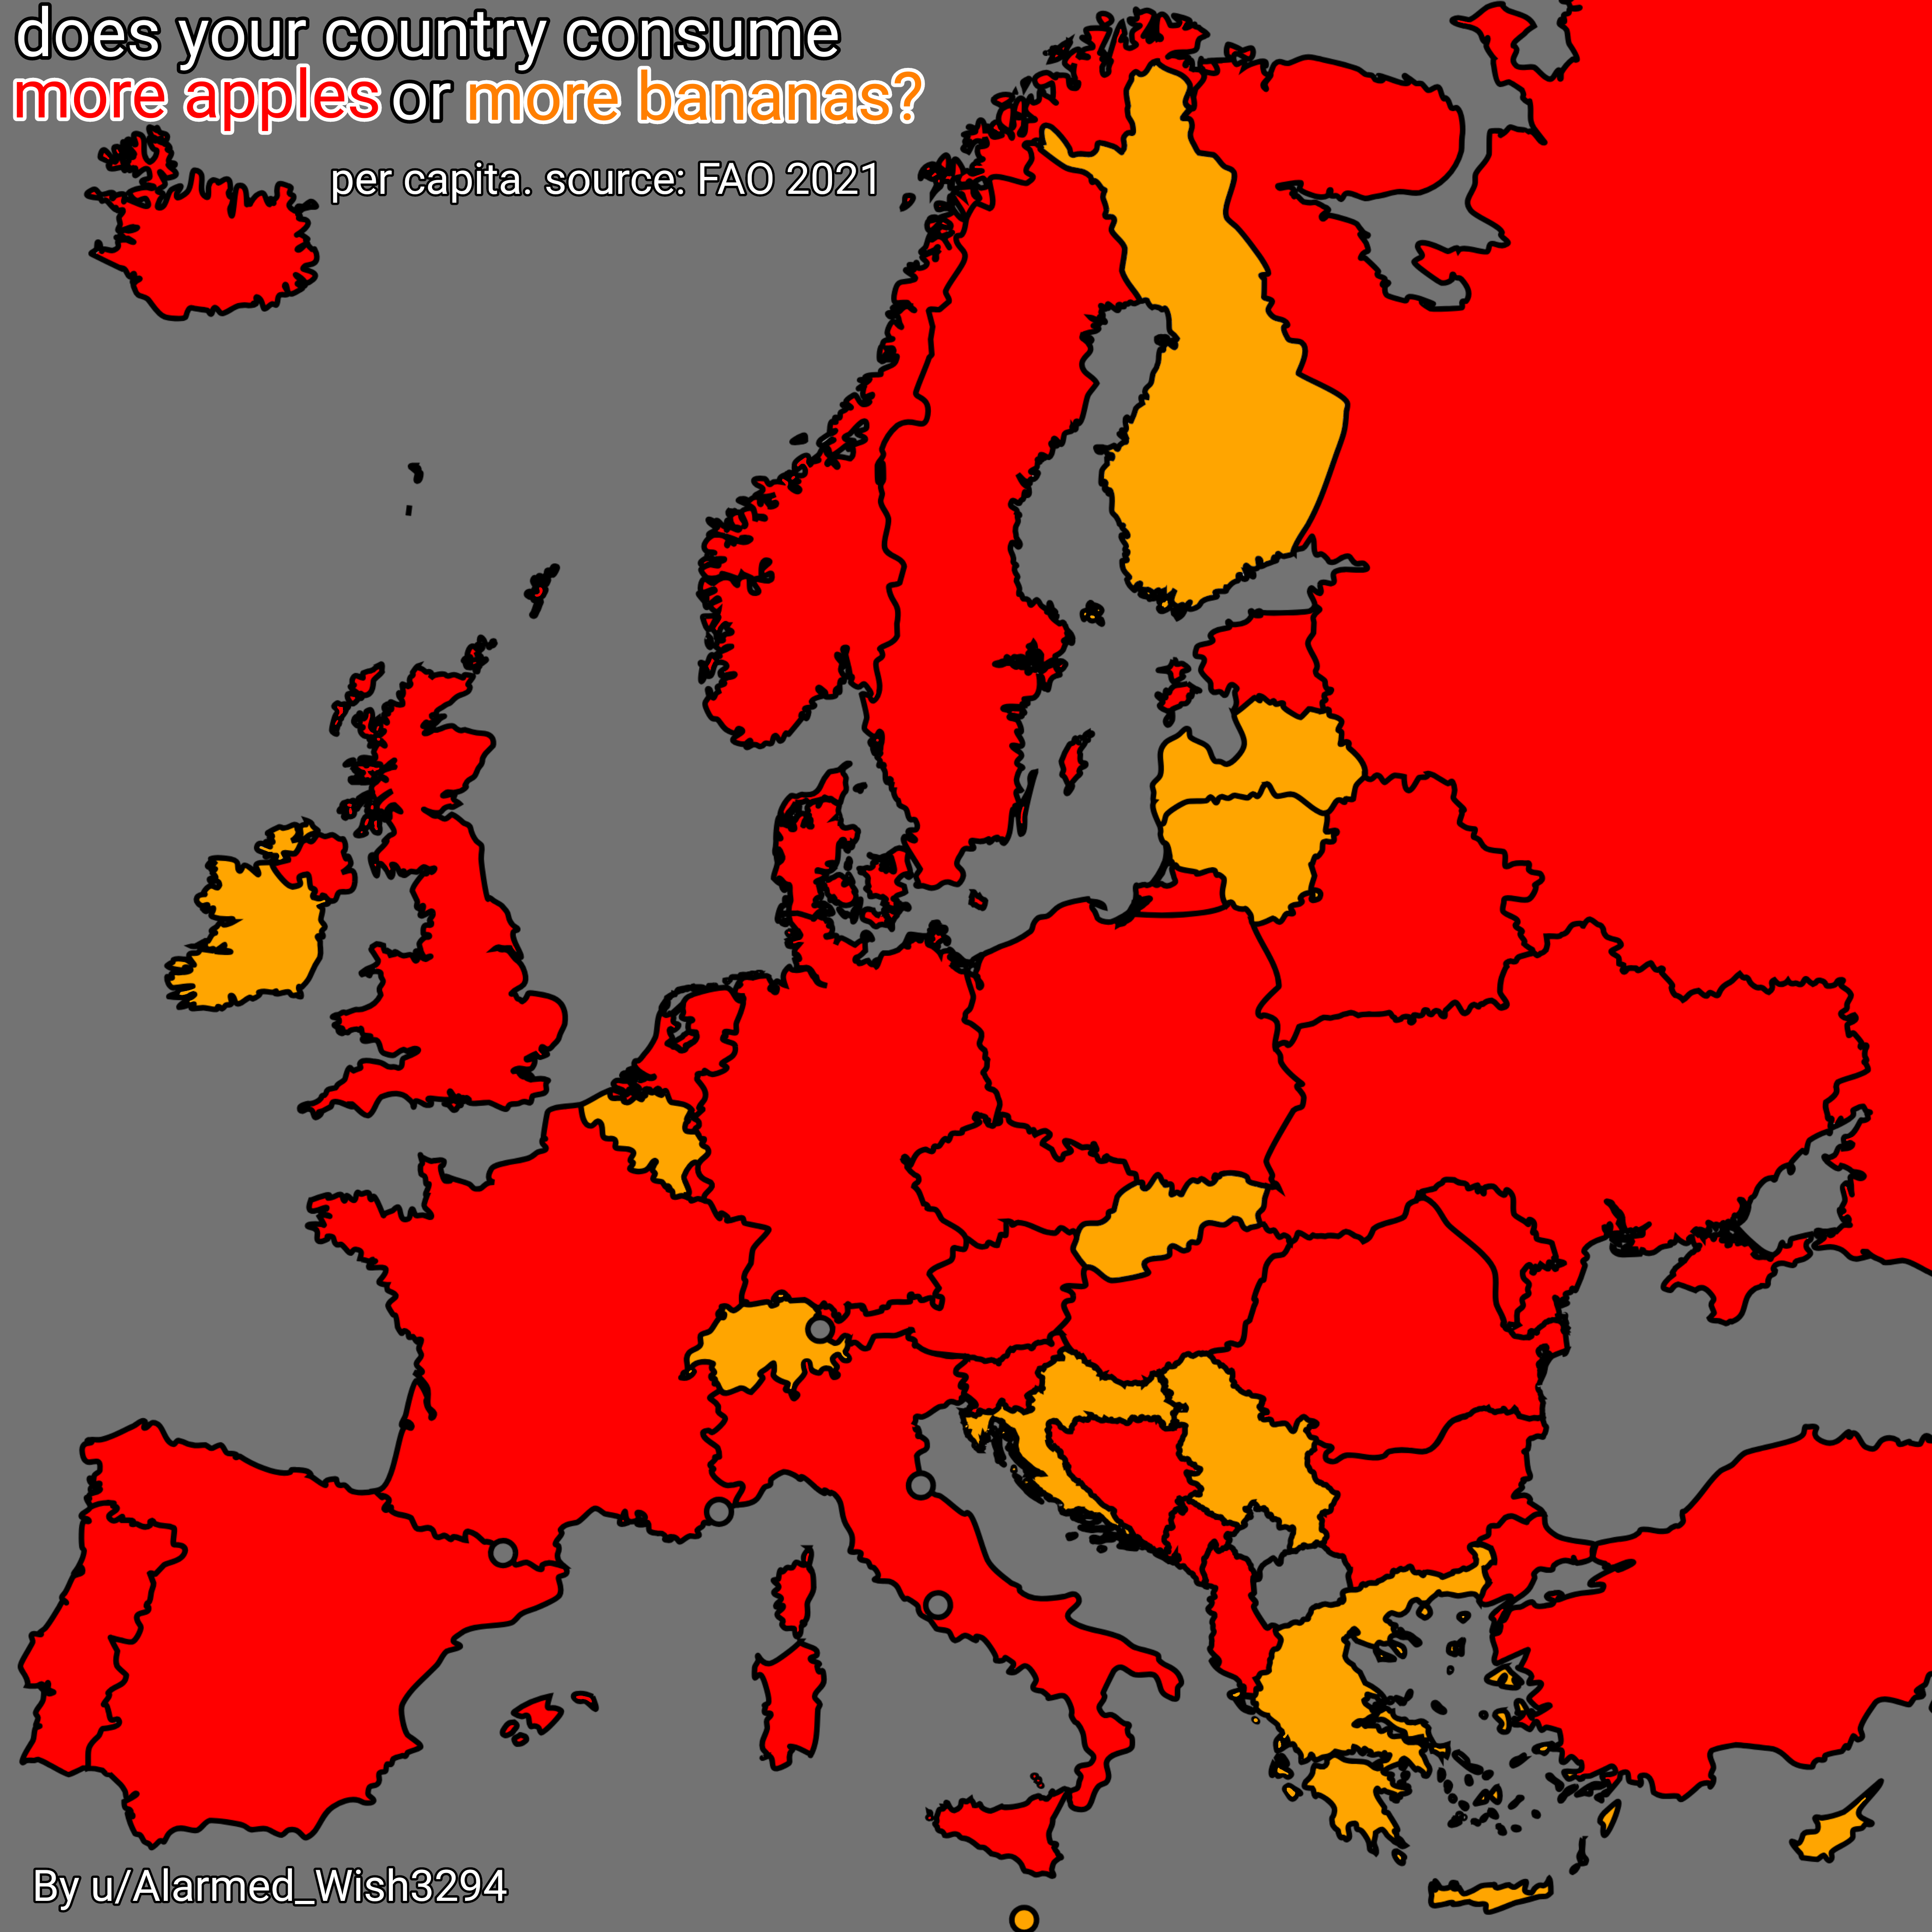
Apple vs Banana Consumption Map in Europe
This map visually depicts the per capita consumption of apples and bananas across various European countries. It provide...
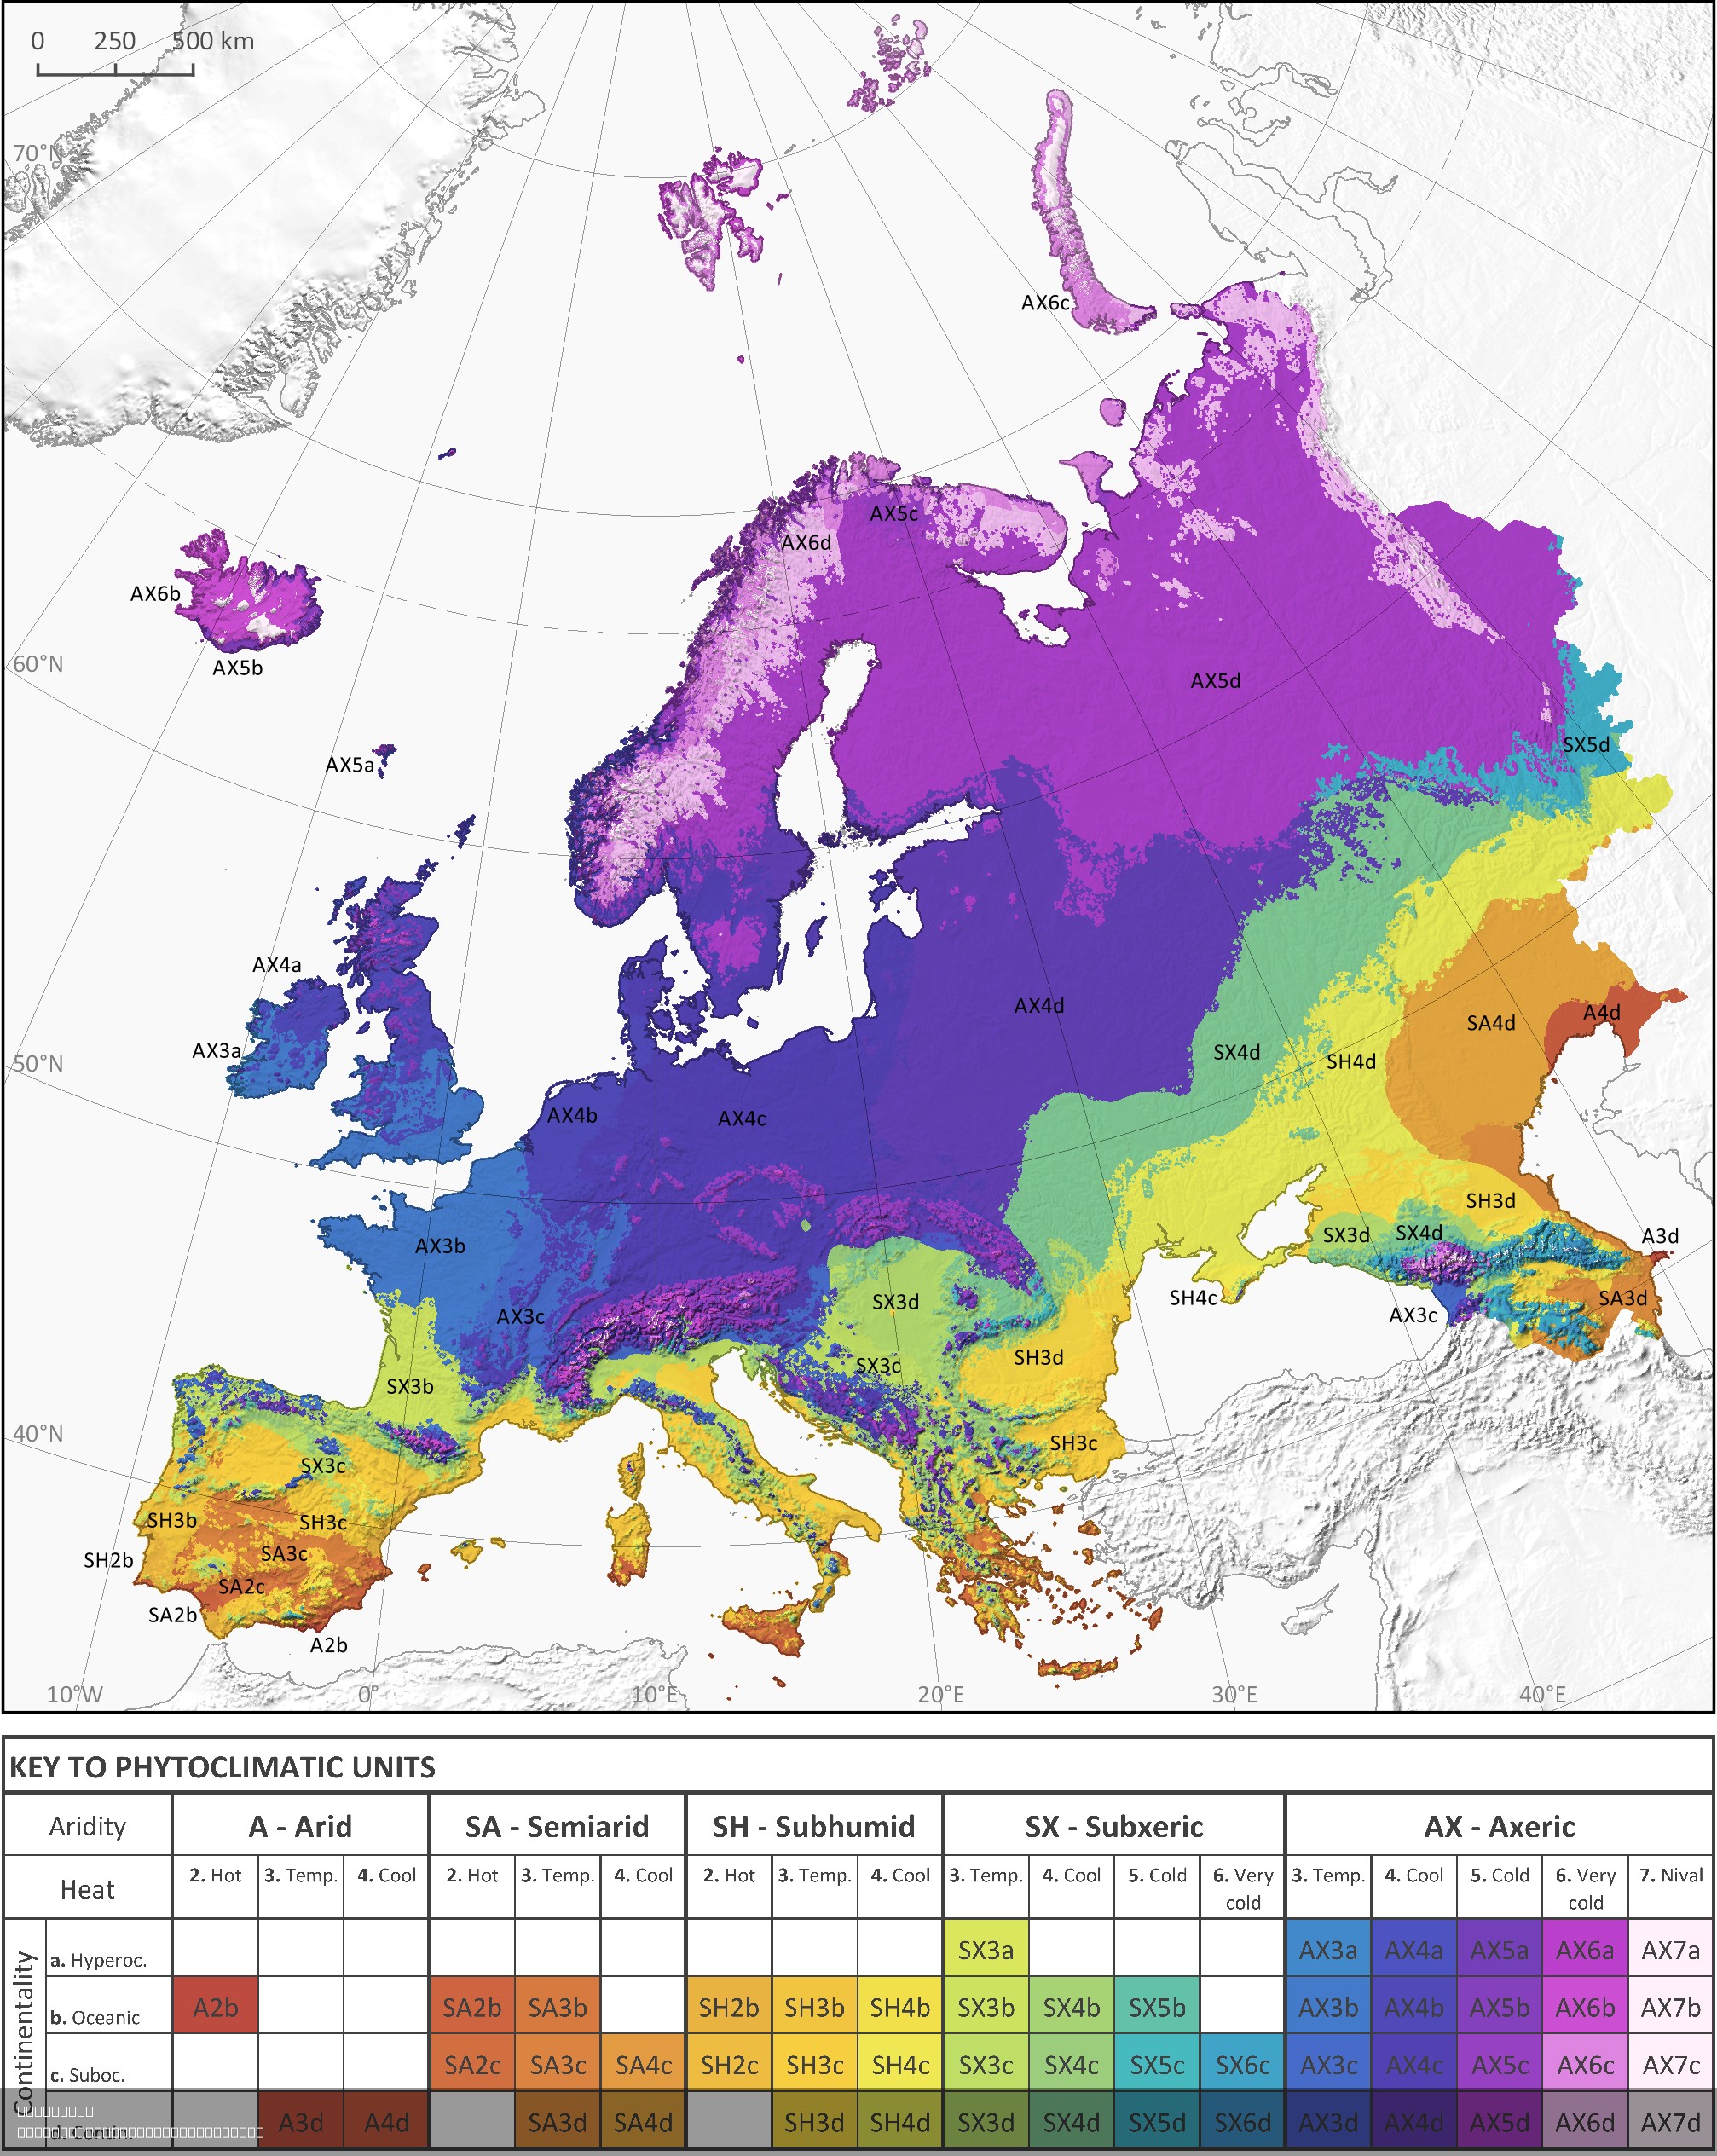
Phytoclimatic Map of Europe
The phytoclimatic map of Europe is a detailed visualization that illustrates the distribution of different plant communi...
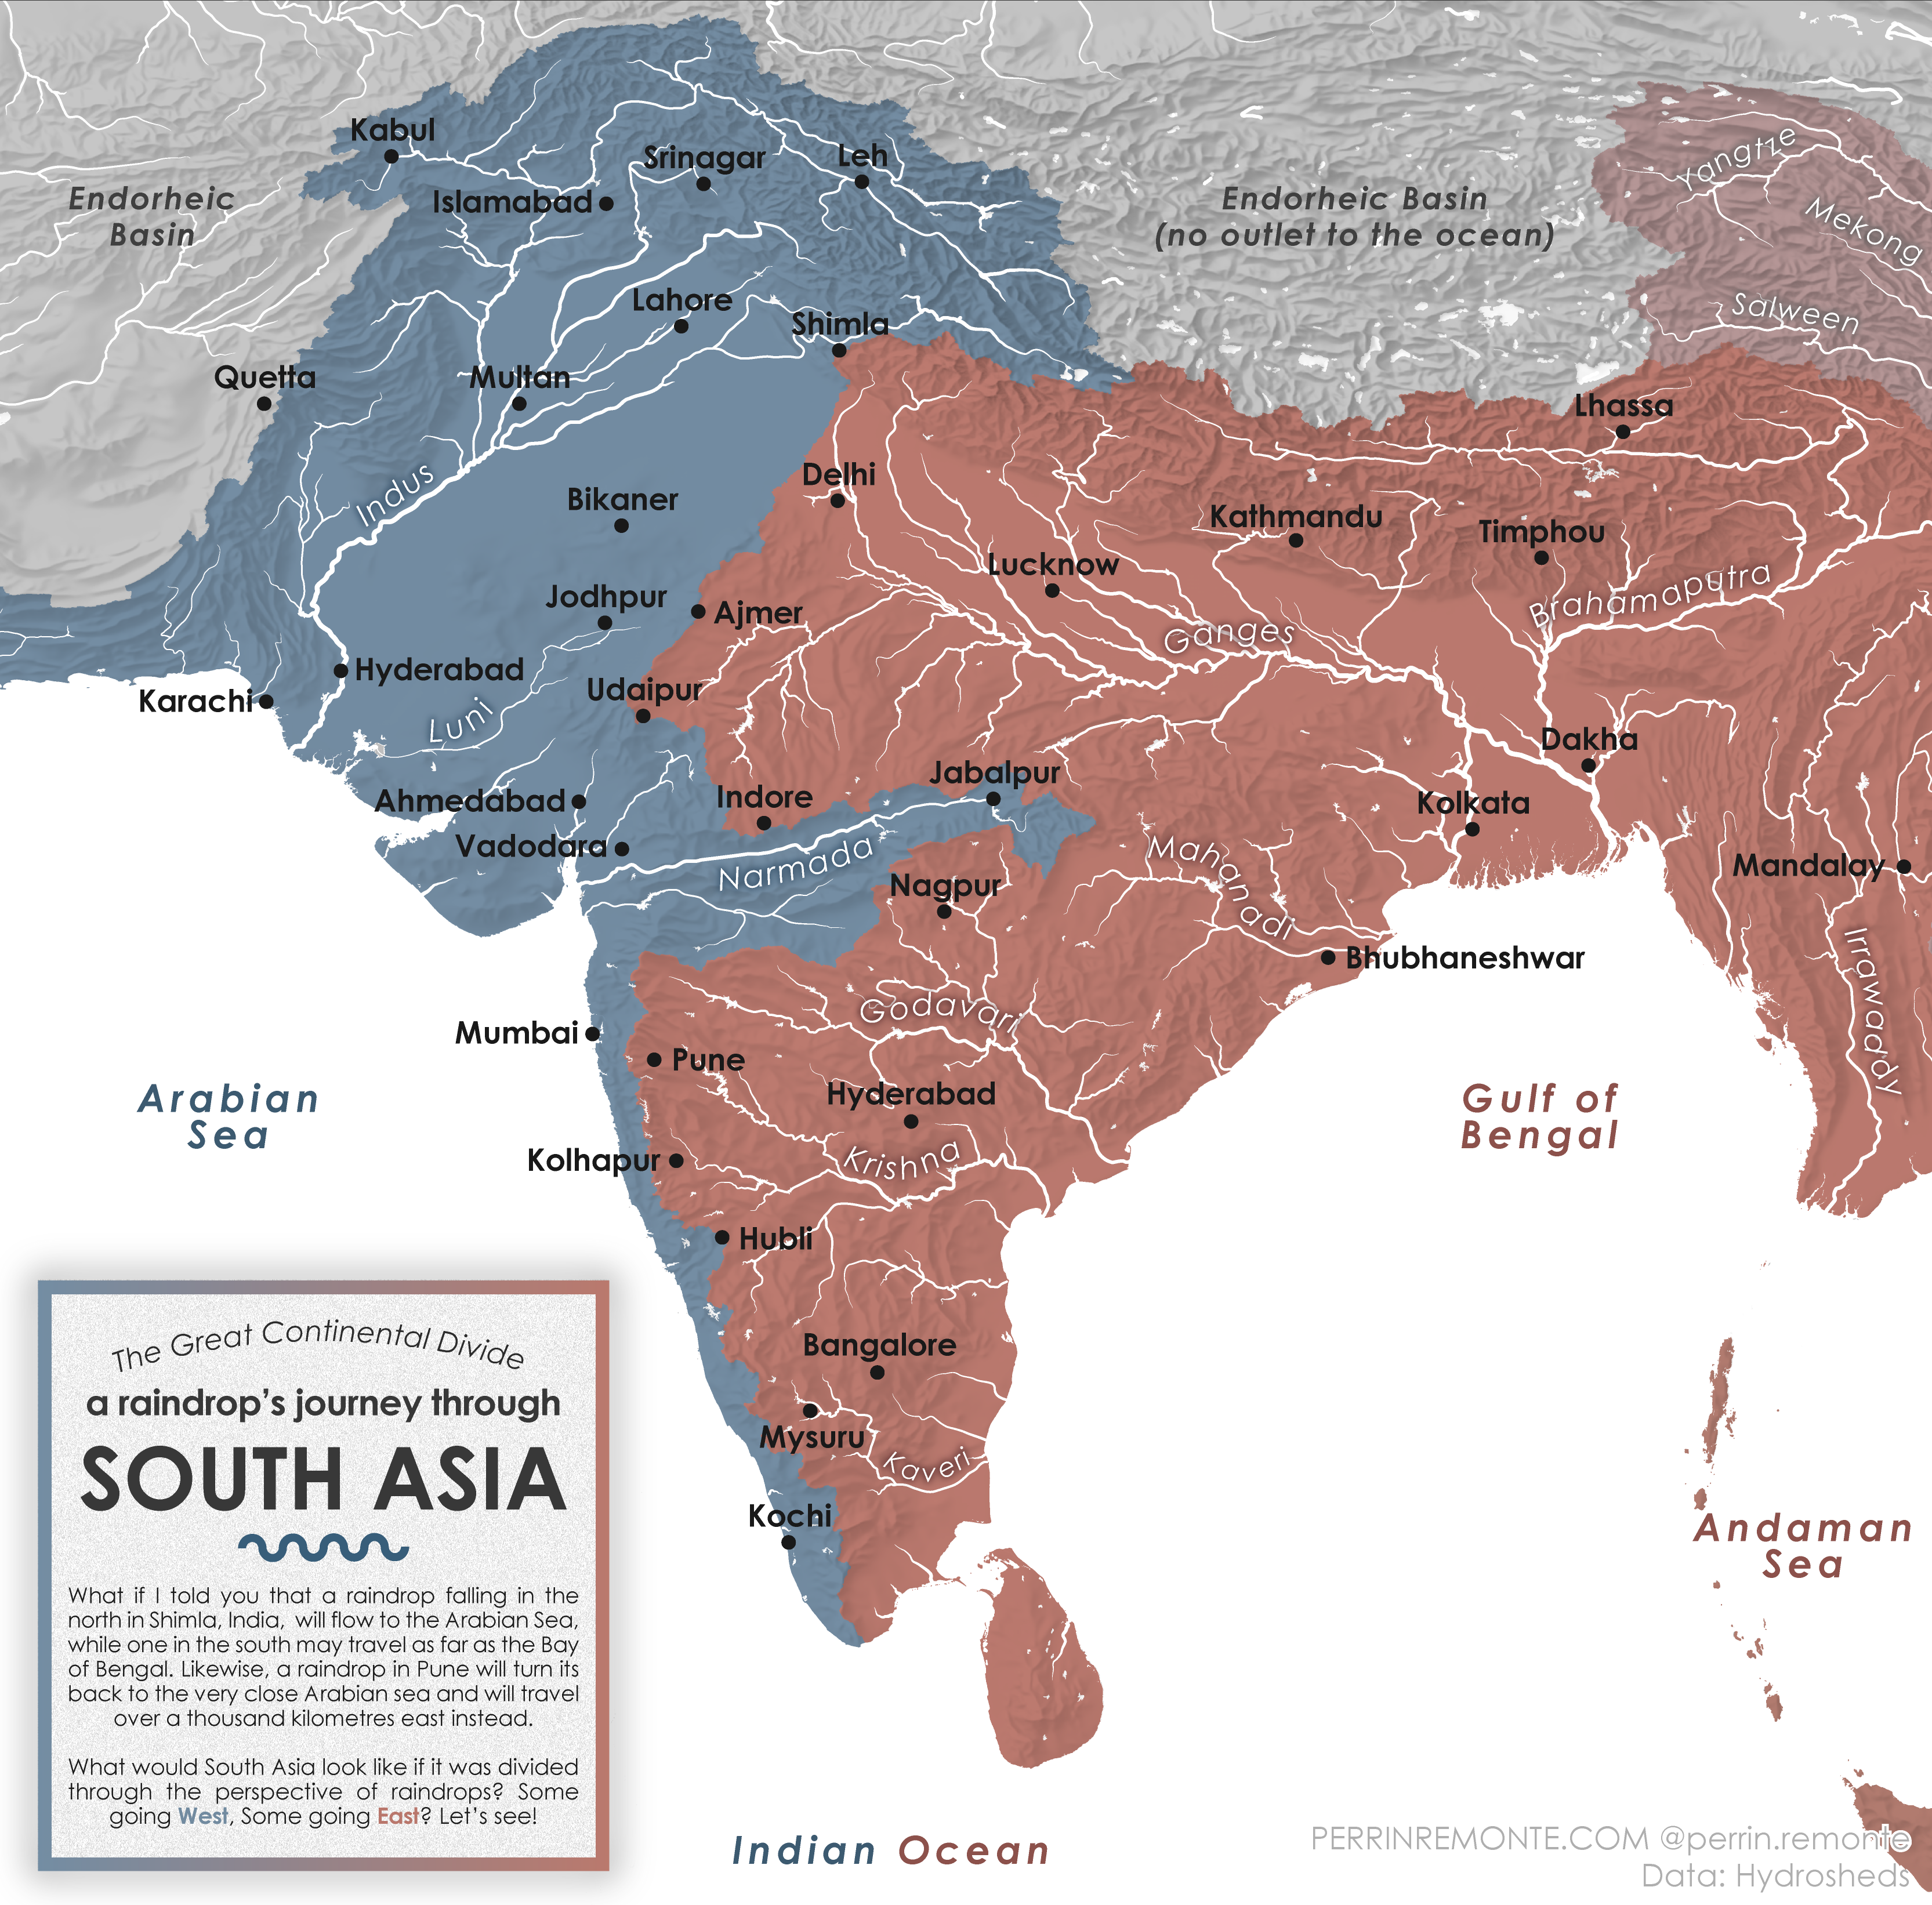
Water Cycle Journey Map of South Asia
The visualization titled "A Raindrop's Journey through South Asia" provides an intriguing look at the water cycle within...
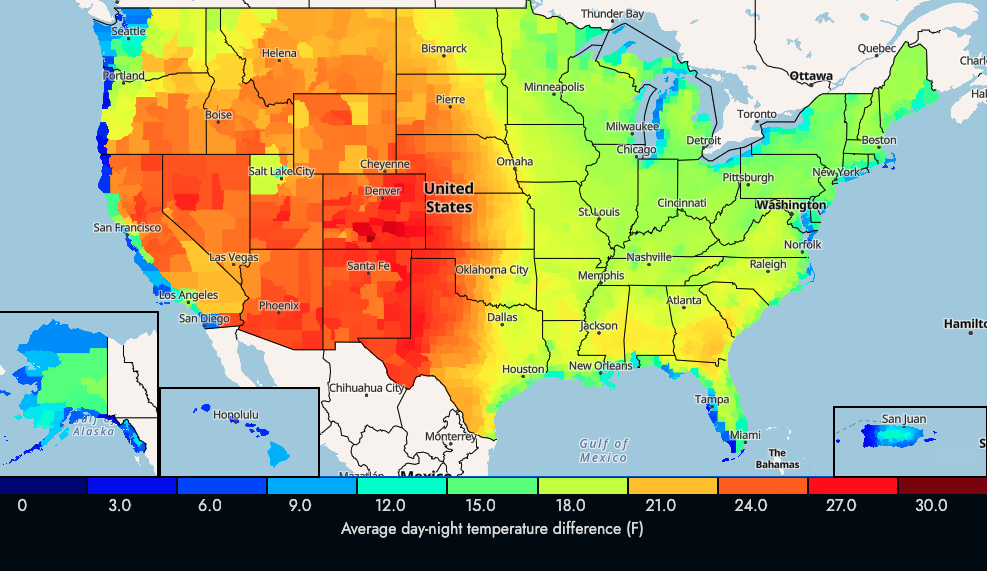
US Average Day-Night Temperature Change Map
The visualization titled "US Average Day-Night Temperature Change in F" illustrates the differences between daytime and ...
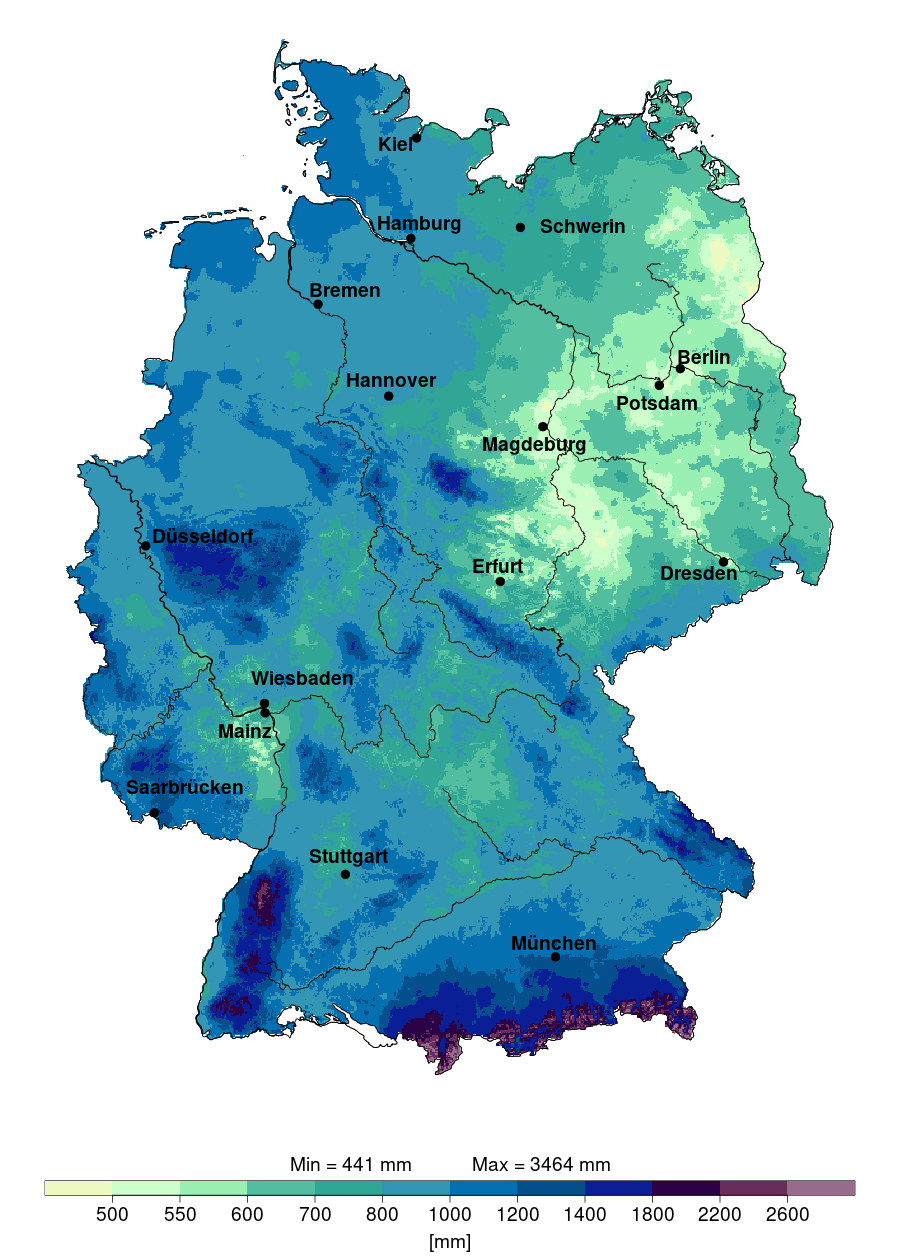
Annual Precipitation Map of Germany 2024
The "Annual Precipitation in Germany in 2024" map provides a detailed visualization of the expected rainfall distributio...
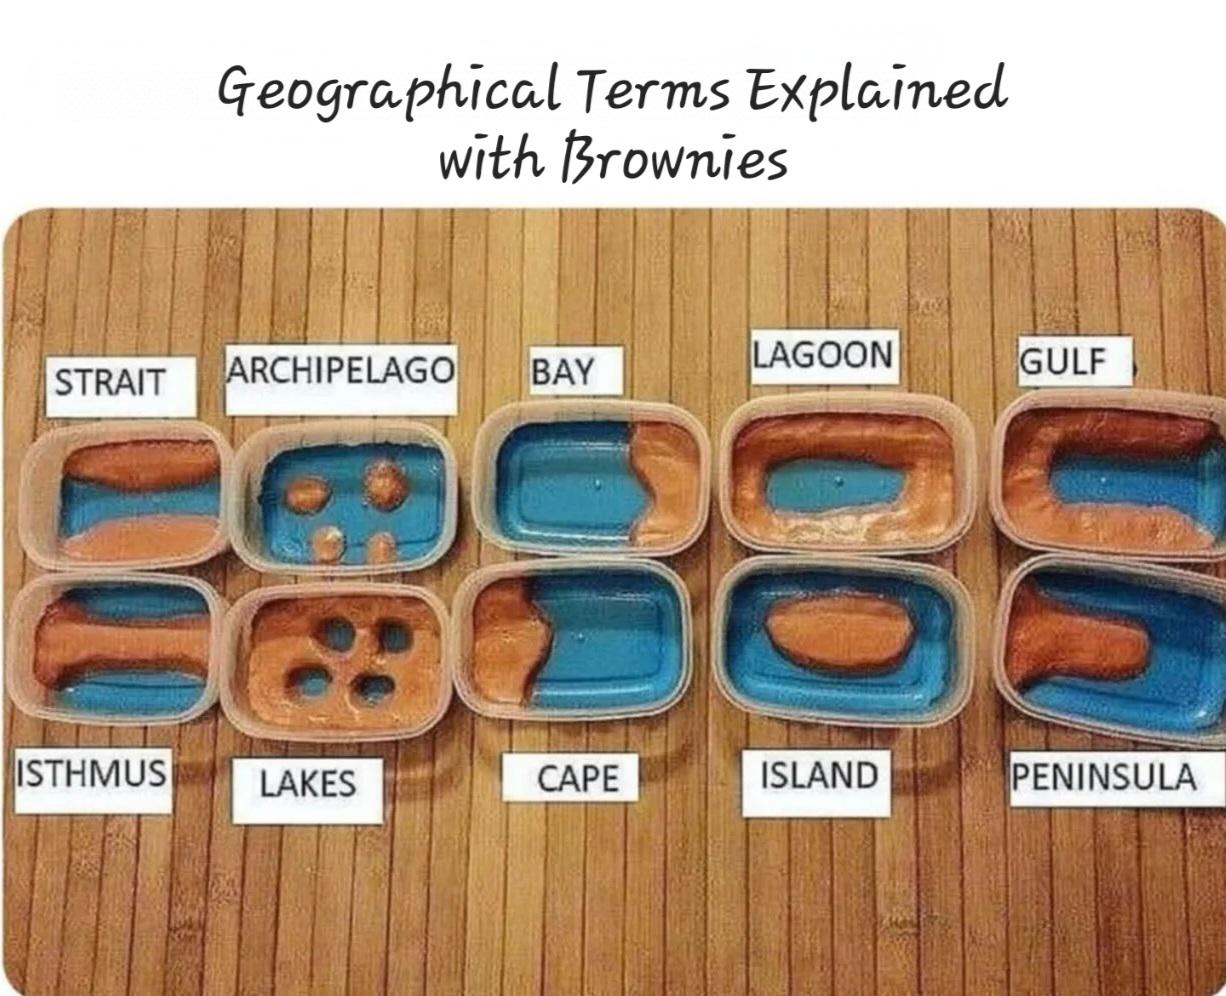
Food Distribution Map of the United States
The "Delicious and Informative!" map provides a comprehensive visualization of food distribution across the United State...

Paraíba River Valley Geography Map
The map of the Paraíba River Valley in Brazil provides a visual representation of this significant geographical feature,...
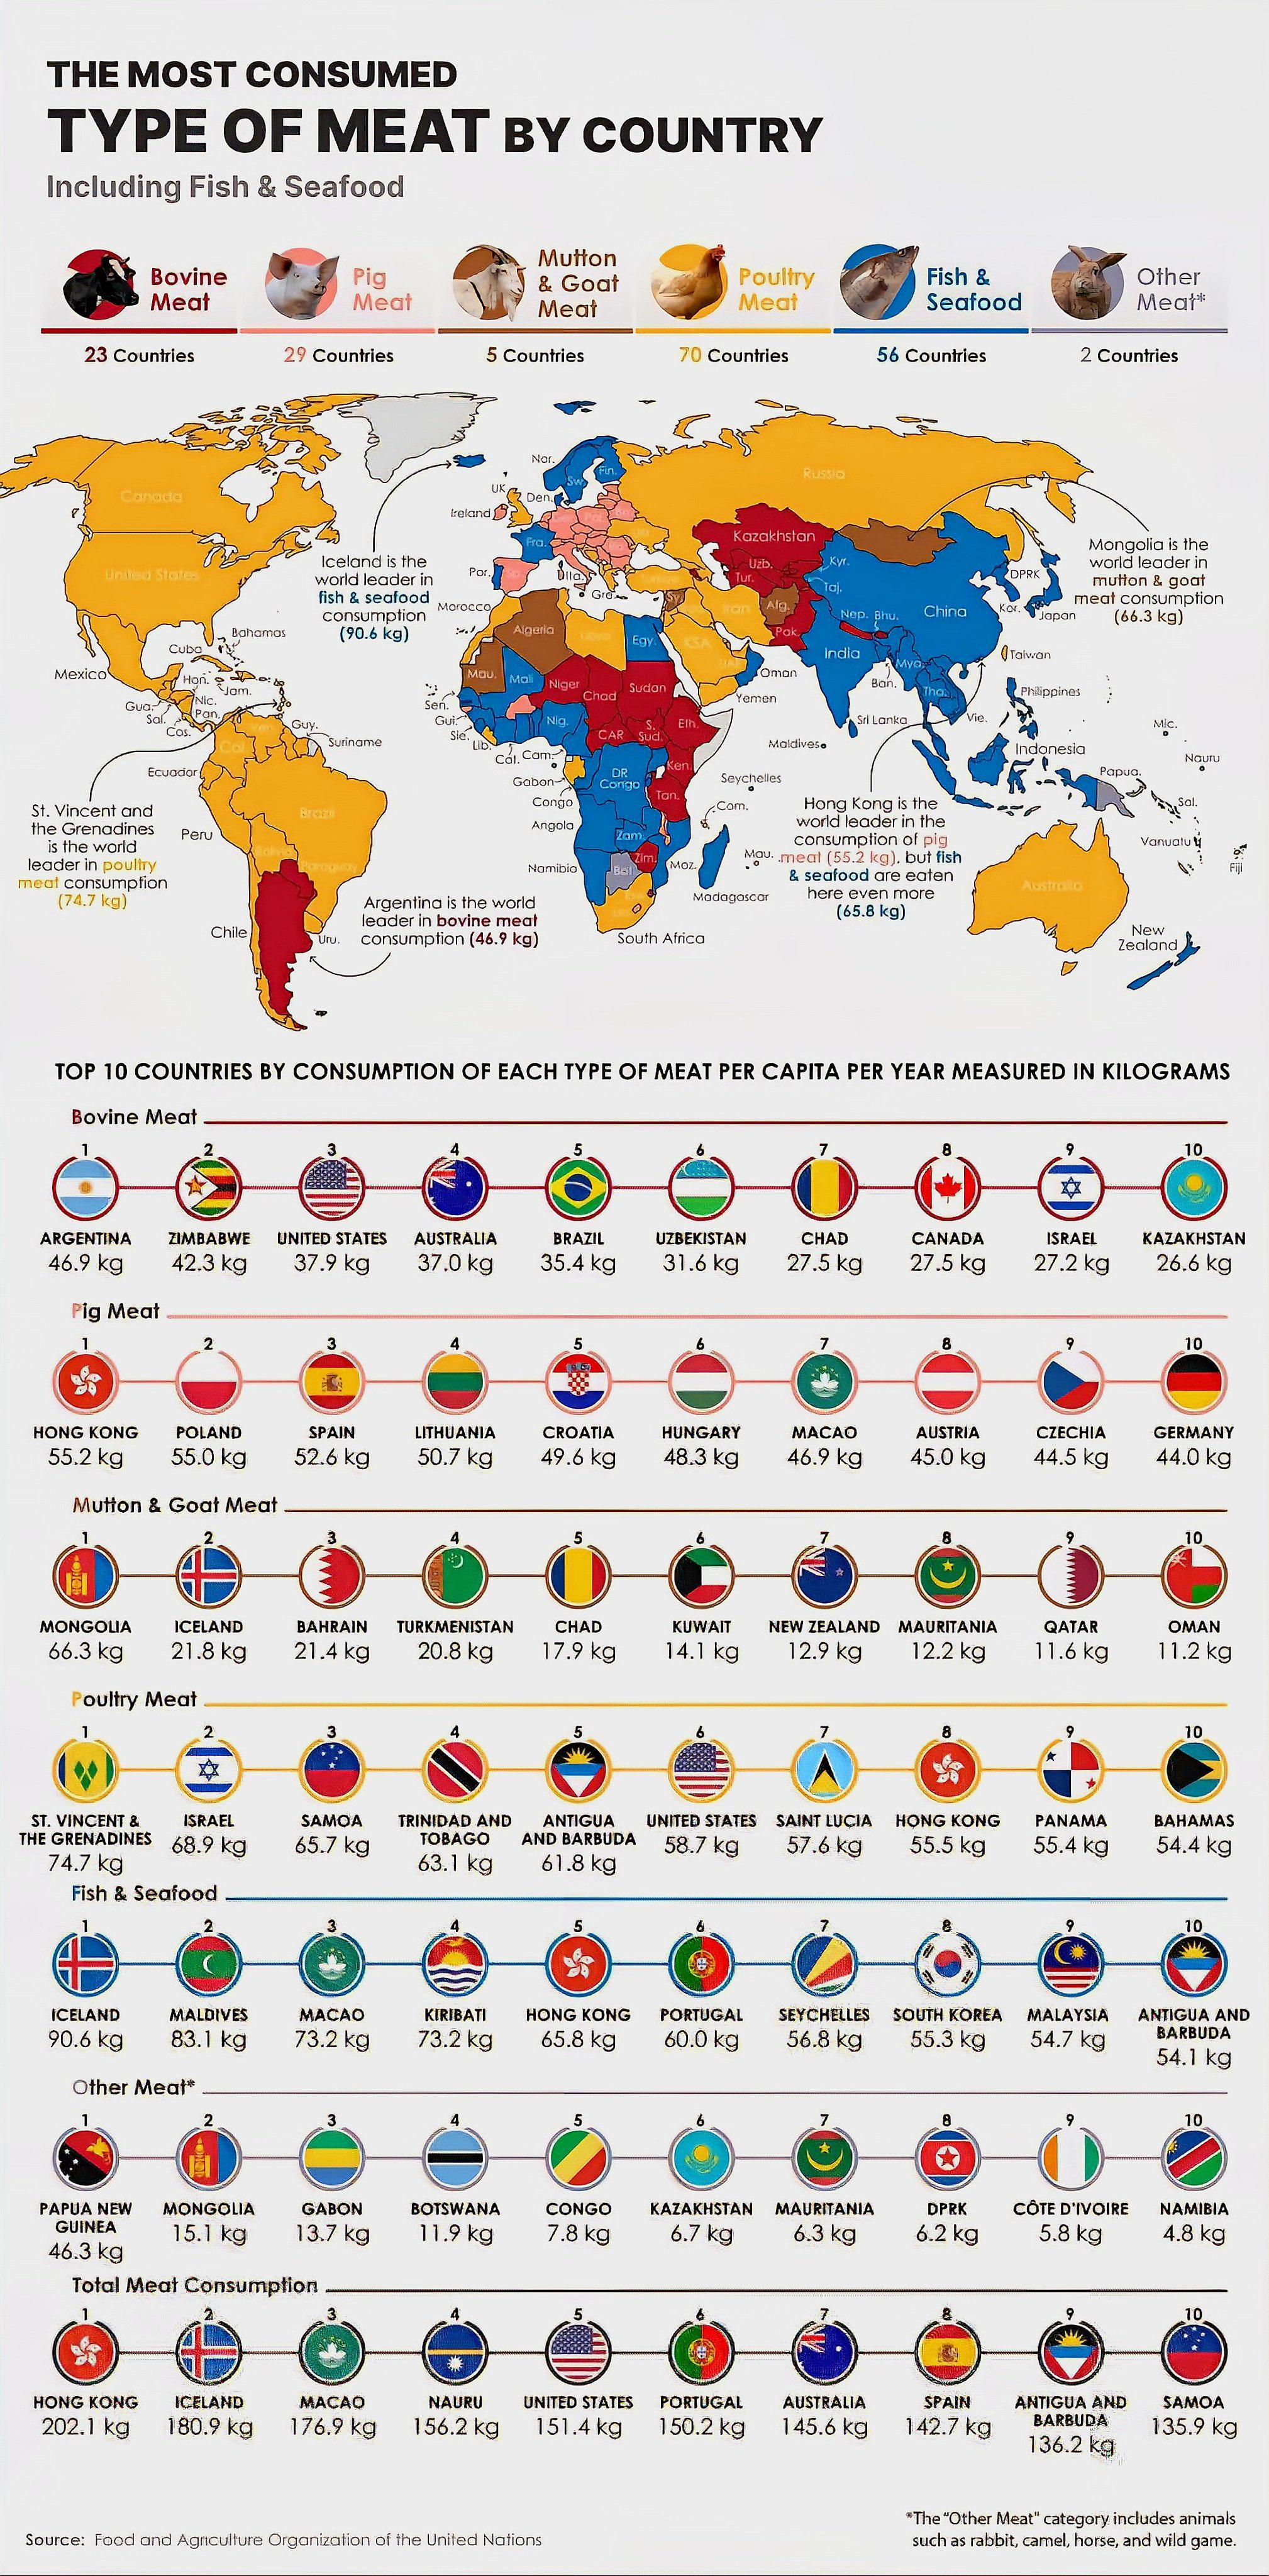
Most Consumed Meat by Country Map
This map provides a compelling visualization of the most consumed type of meat in various countries around the world. By...
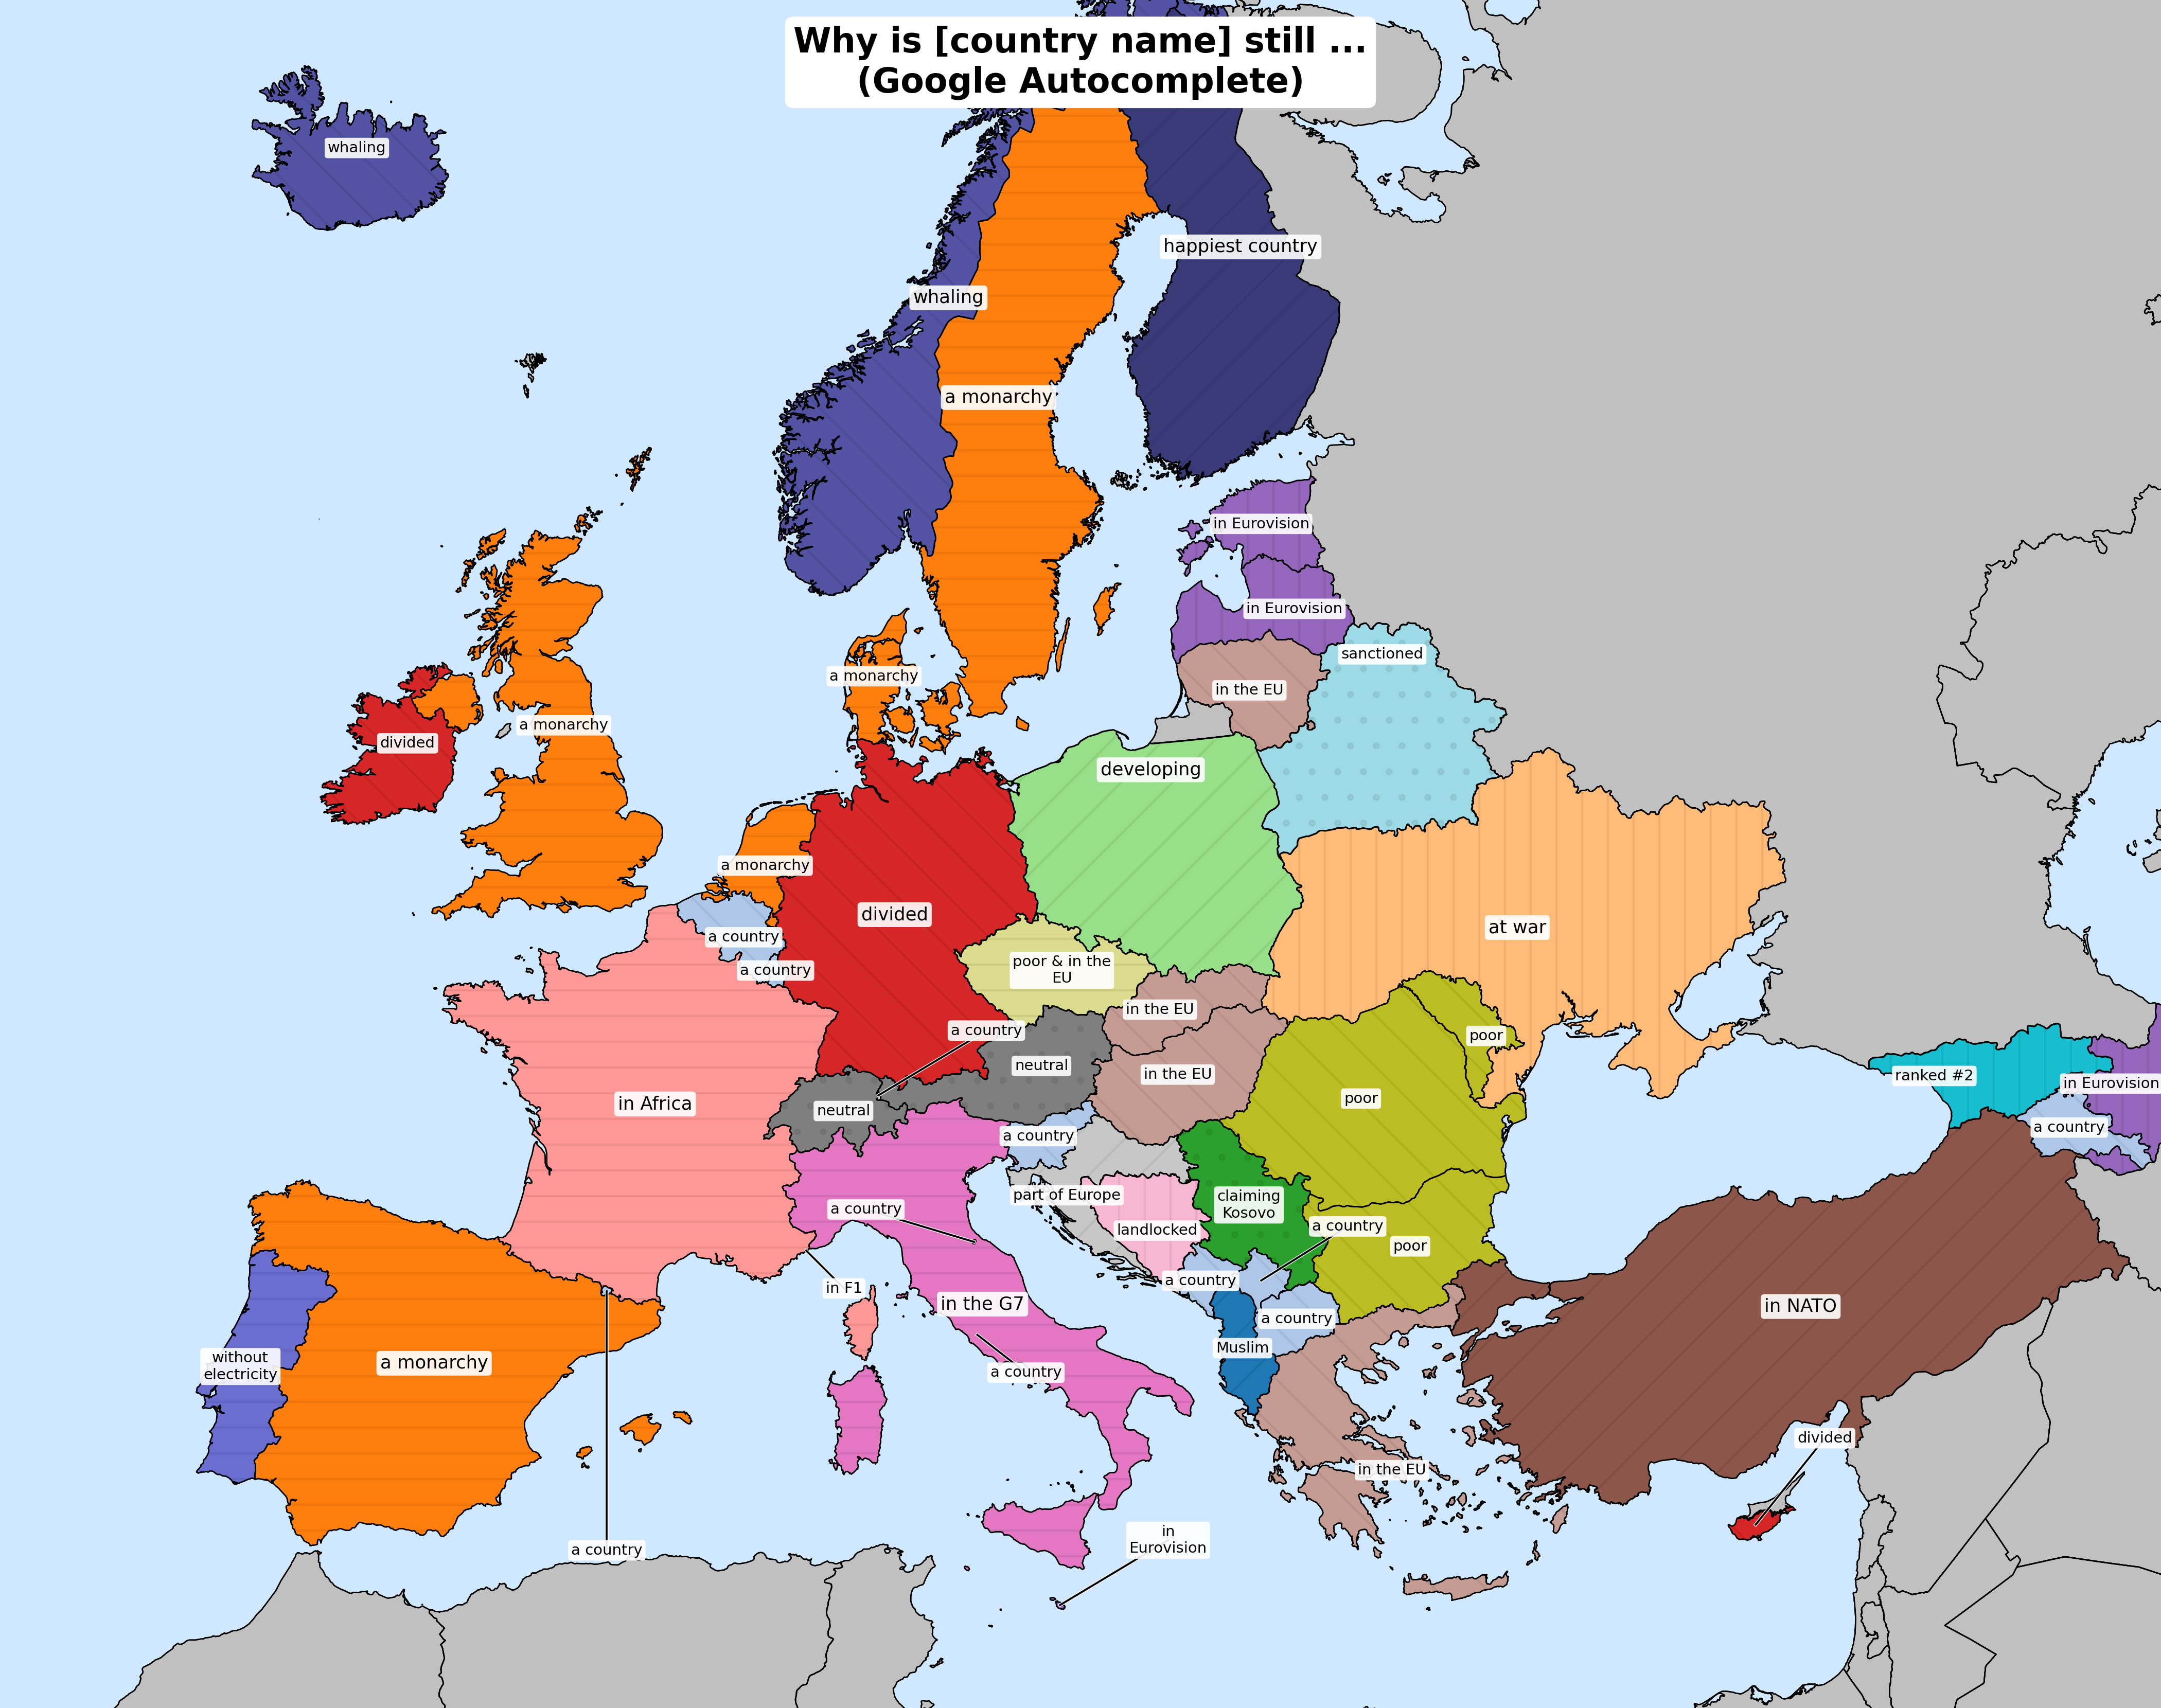
Economic Development Map of Haiti
Interestingly, Haiti ranks among the poorest countries in the Western Hemisphere, with a GDP per capita of around $1,200...
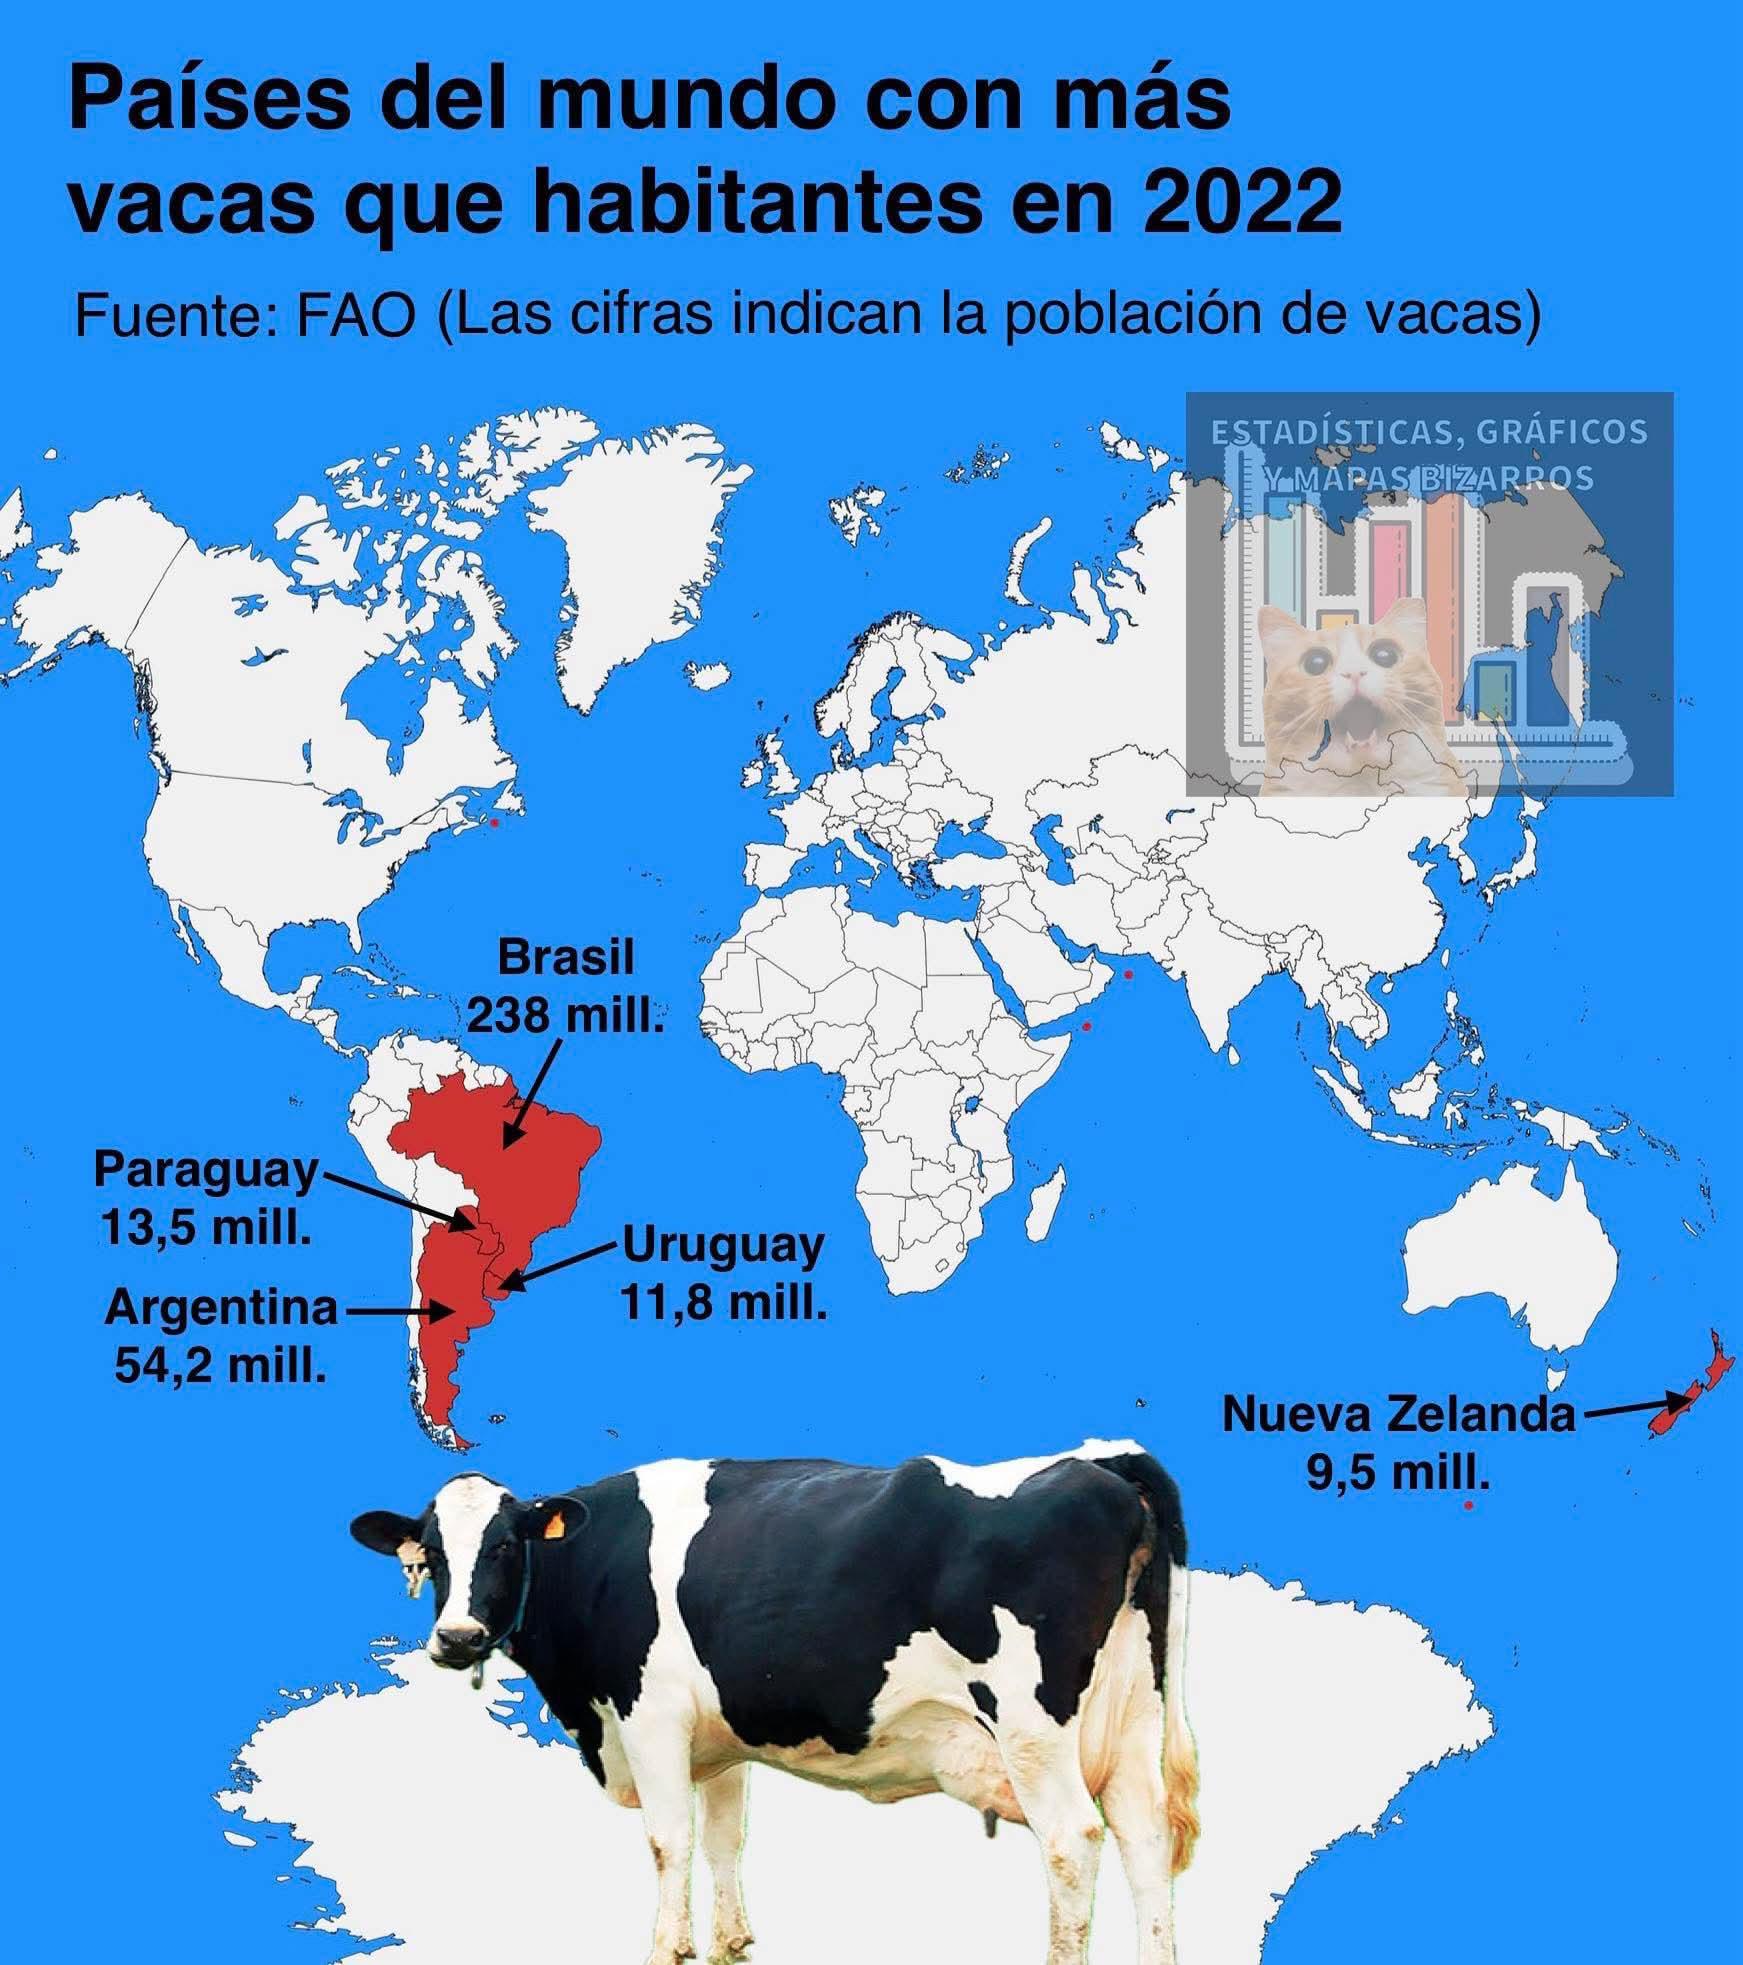
Map of Countries with More Cows than Humans
The visualization titled "Countries where they have more cows than humans" illustrates a fascinating aspect of global li...
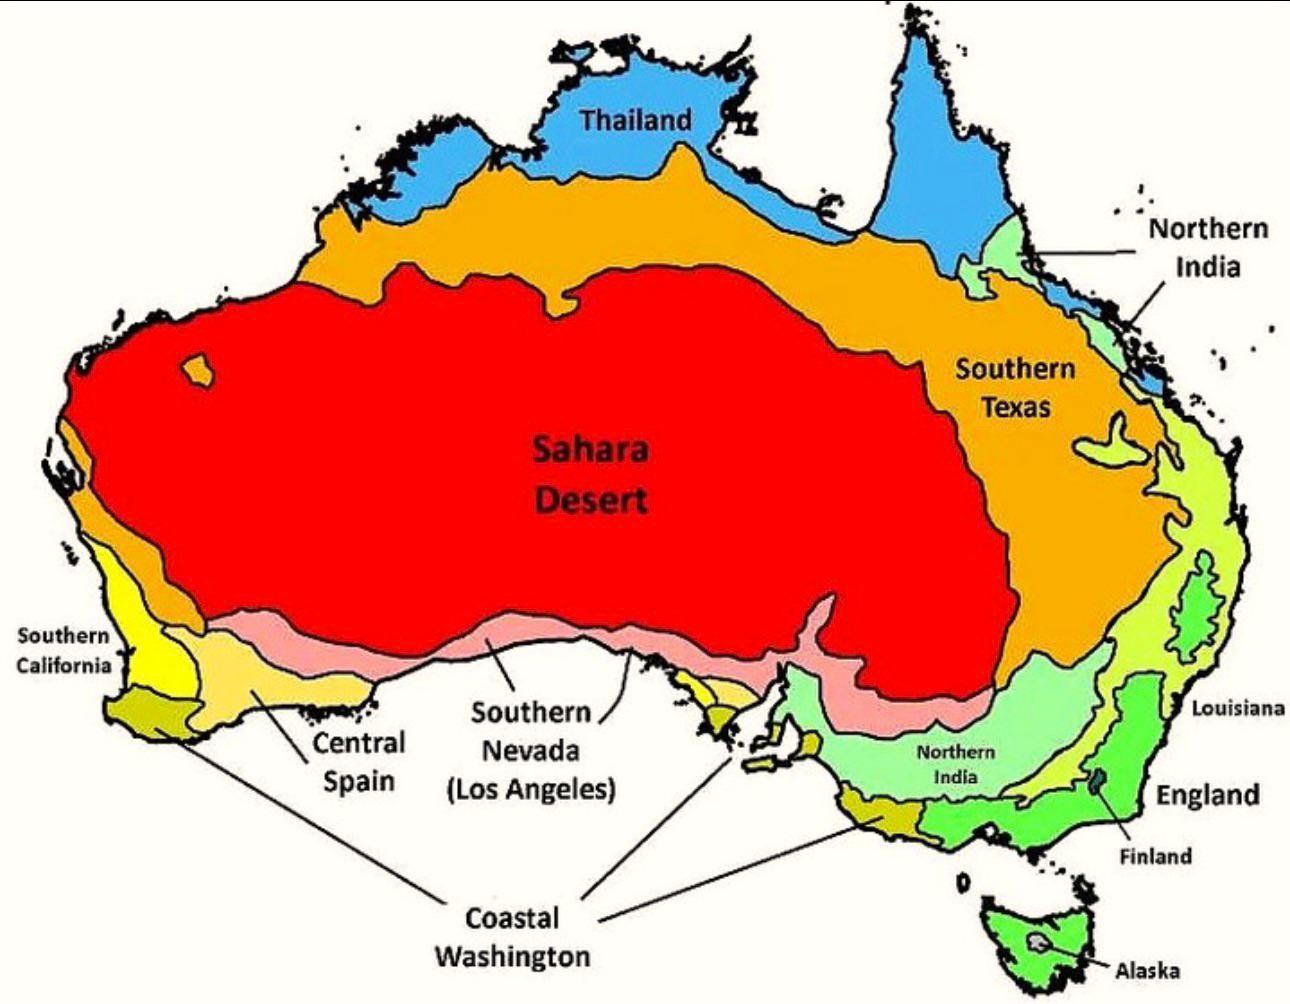
Australia’s Climate Compared to Other Countries Map
The map titled "Australia’s Climate Compared to Other Countries" provides a detailed look at how Australia's climate sta...
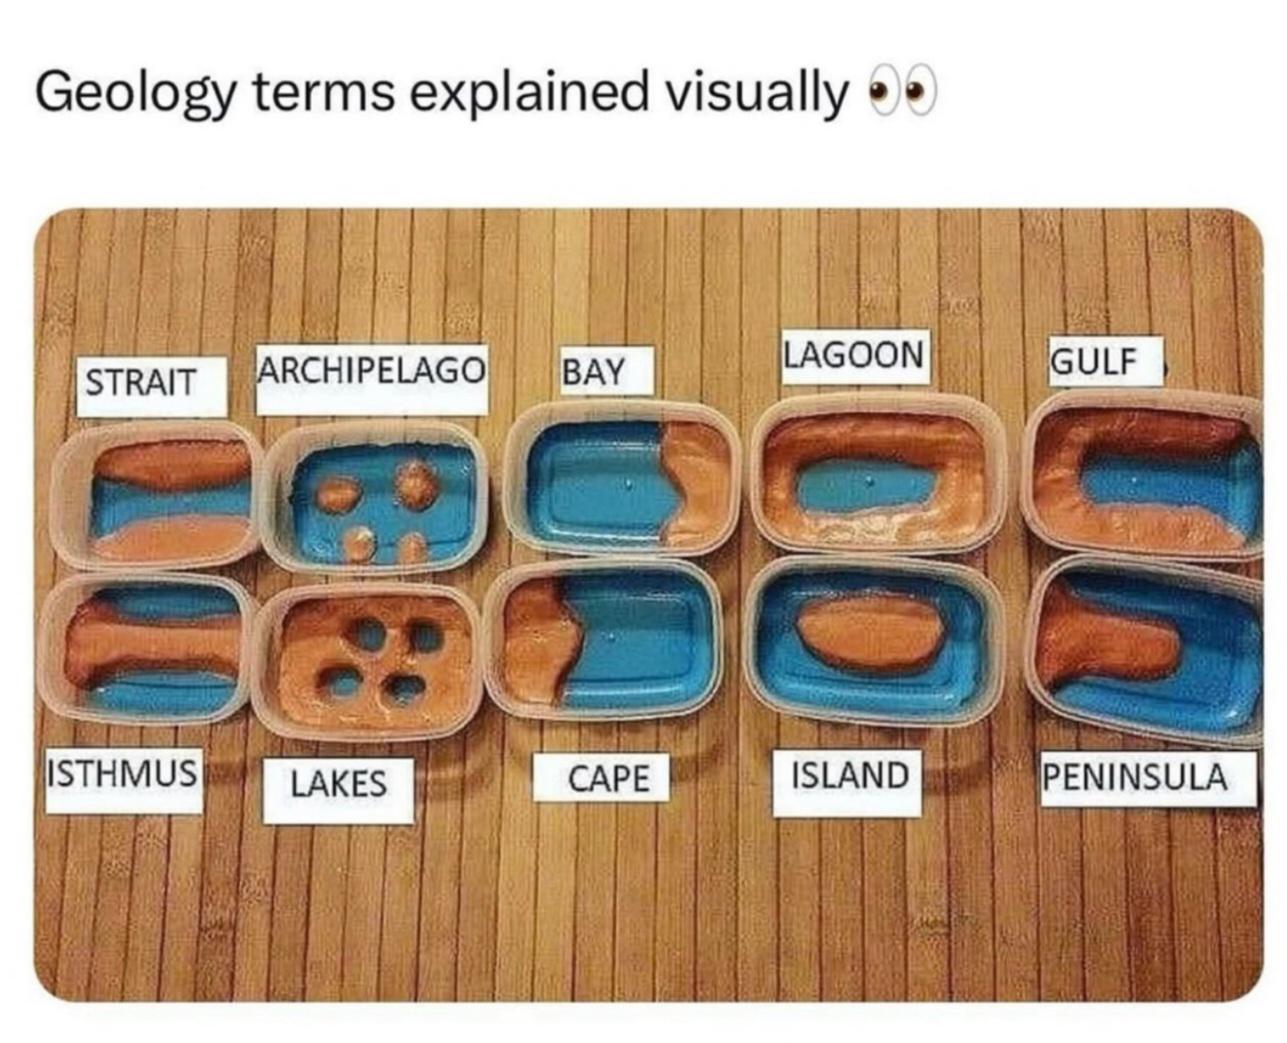
Food Production Map by Country
...
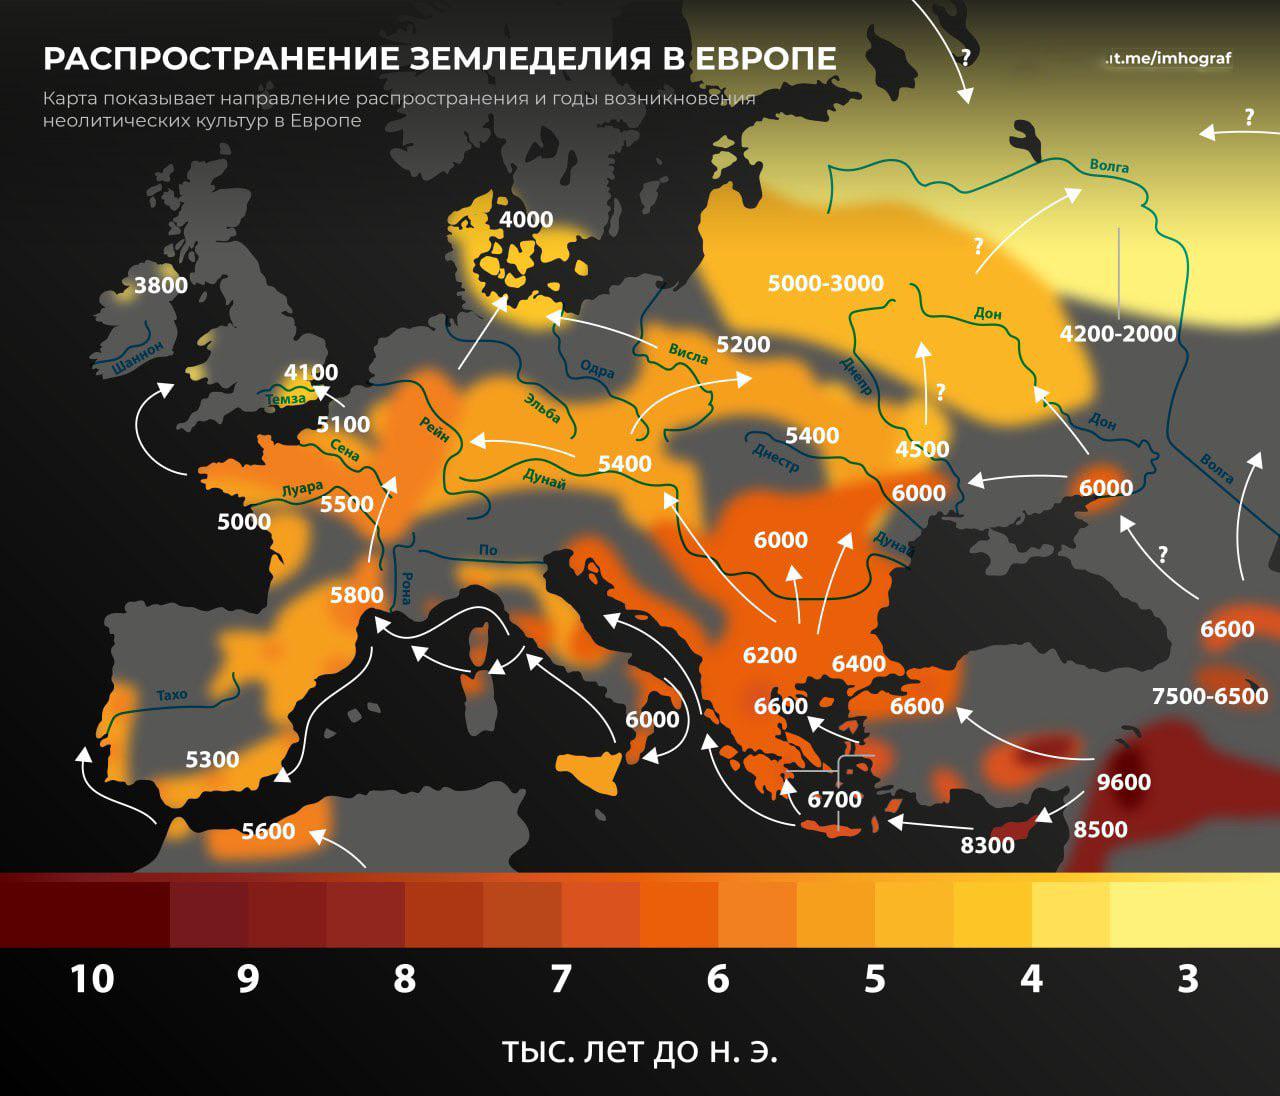
Agricultural Spread Across Europe Map
The "Spread of Agriculture Across Europe" map visualizes the distribution of agricultural practices and land use across ...
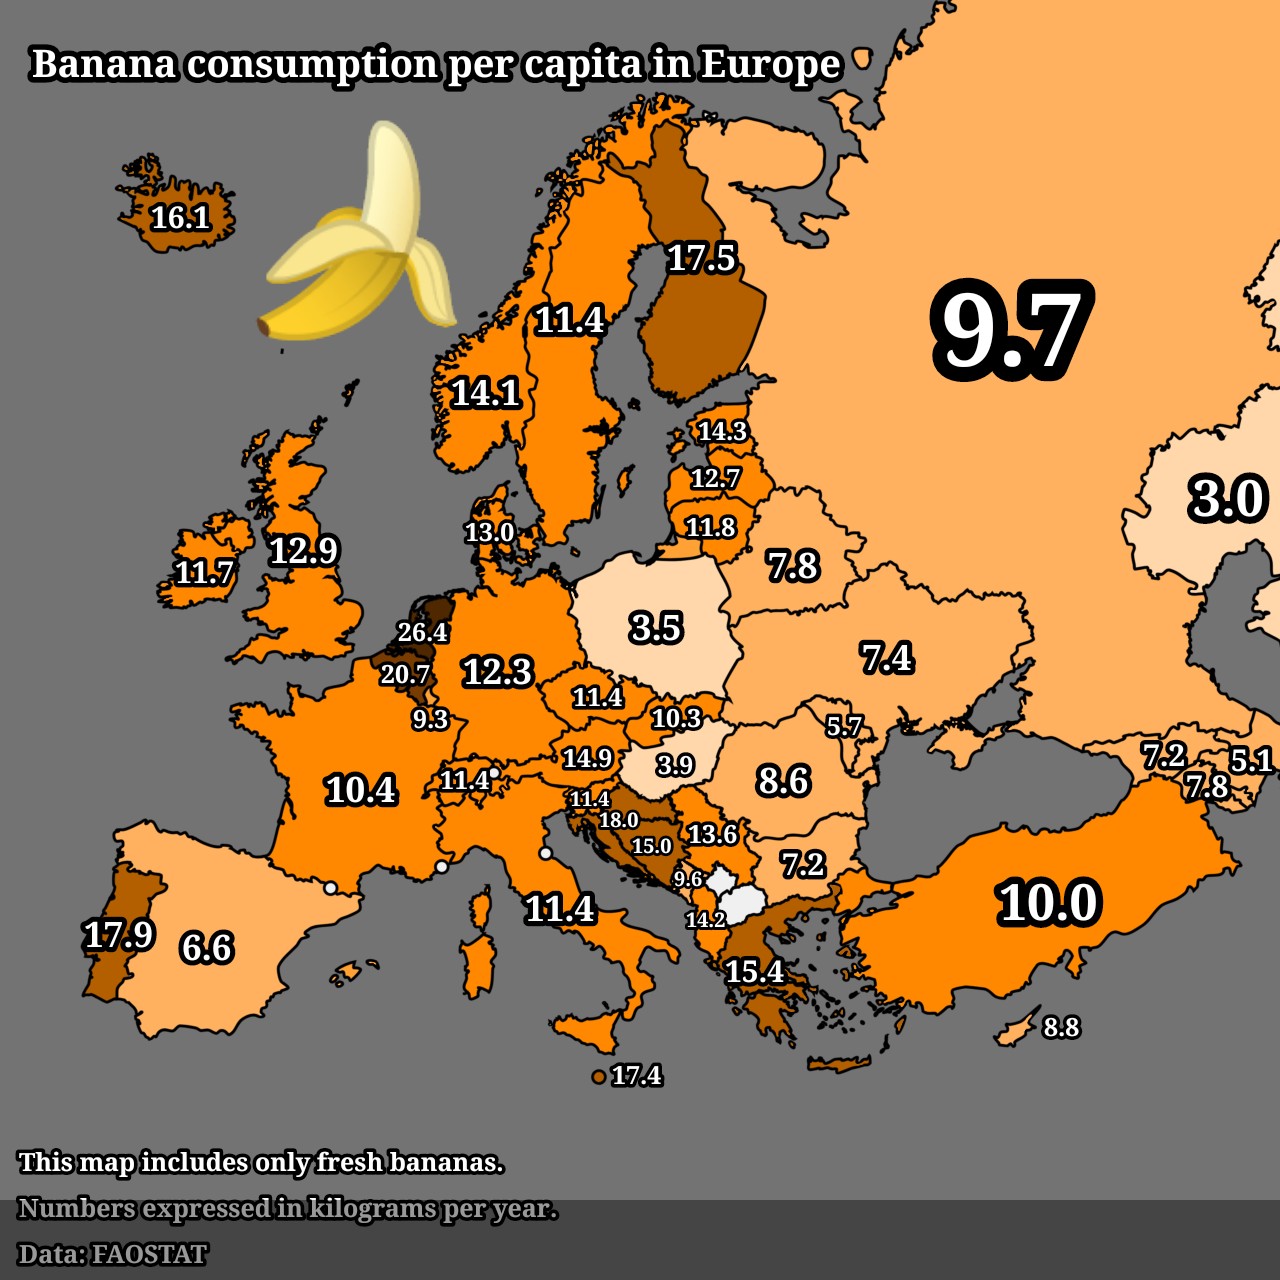
Banana Consumption Per Capita in Europe Map
The "Banana Consumption Per Capita in Europe" map provides a visual representation of the average banana consumption acr...
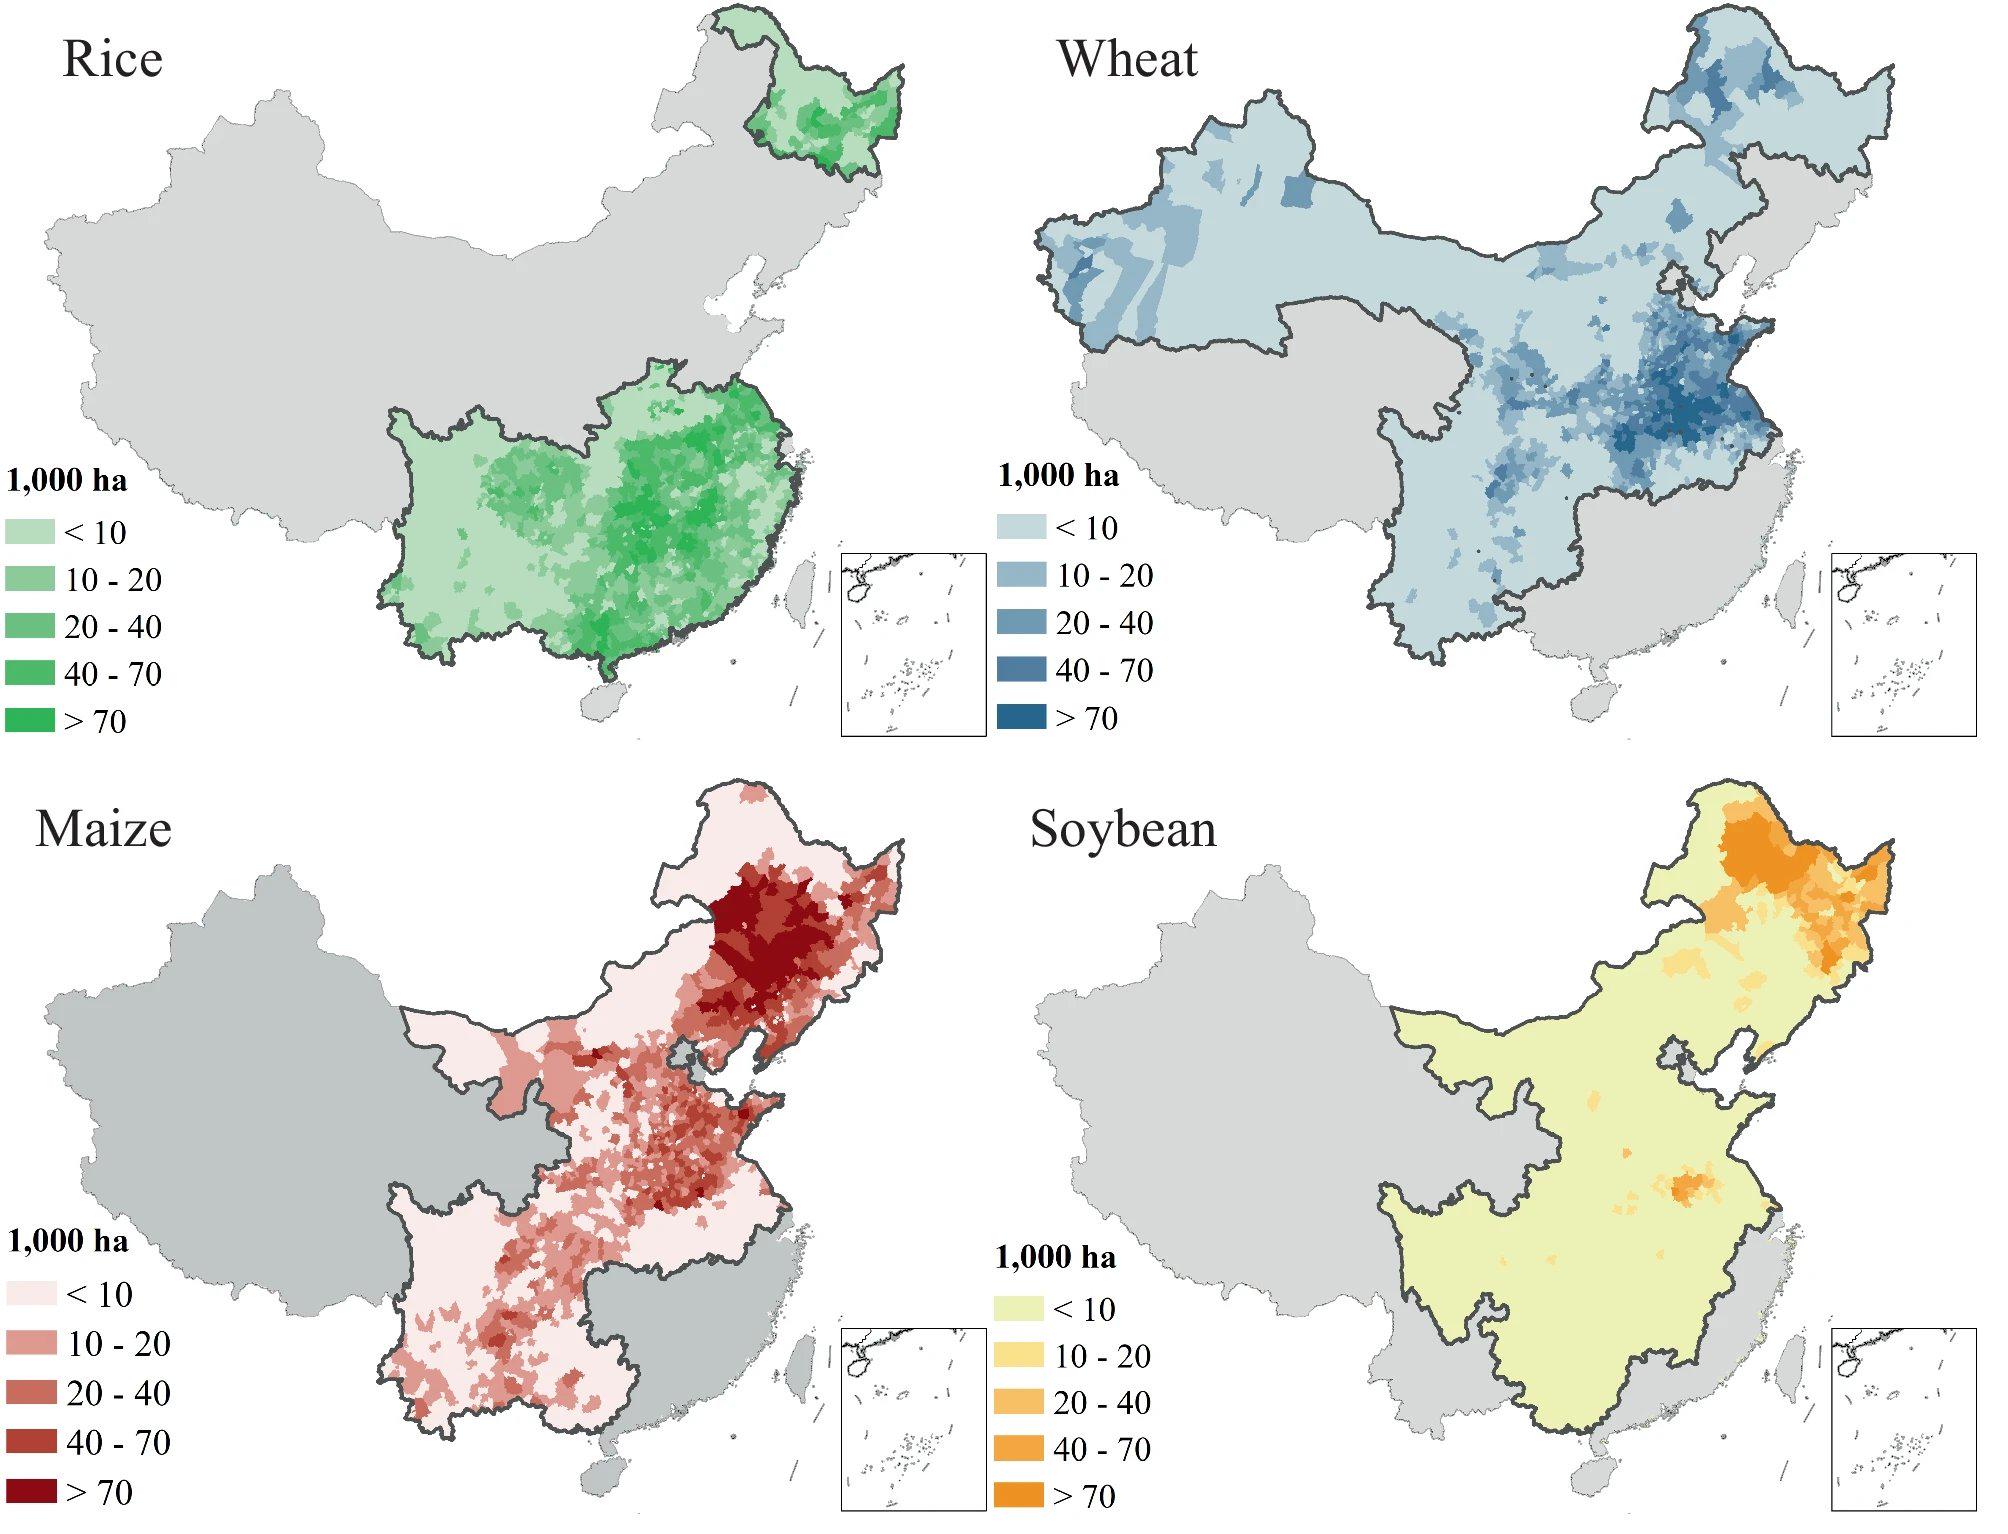
Major Crops Harvested in China Map
The "Major Crops Harvested in China Map" provides a detailed visualization of the primary agricultural products cultivat...
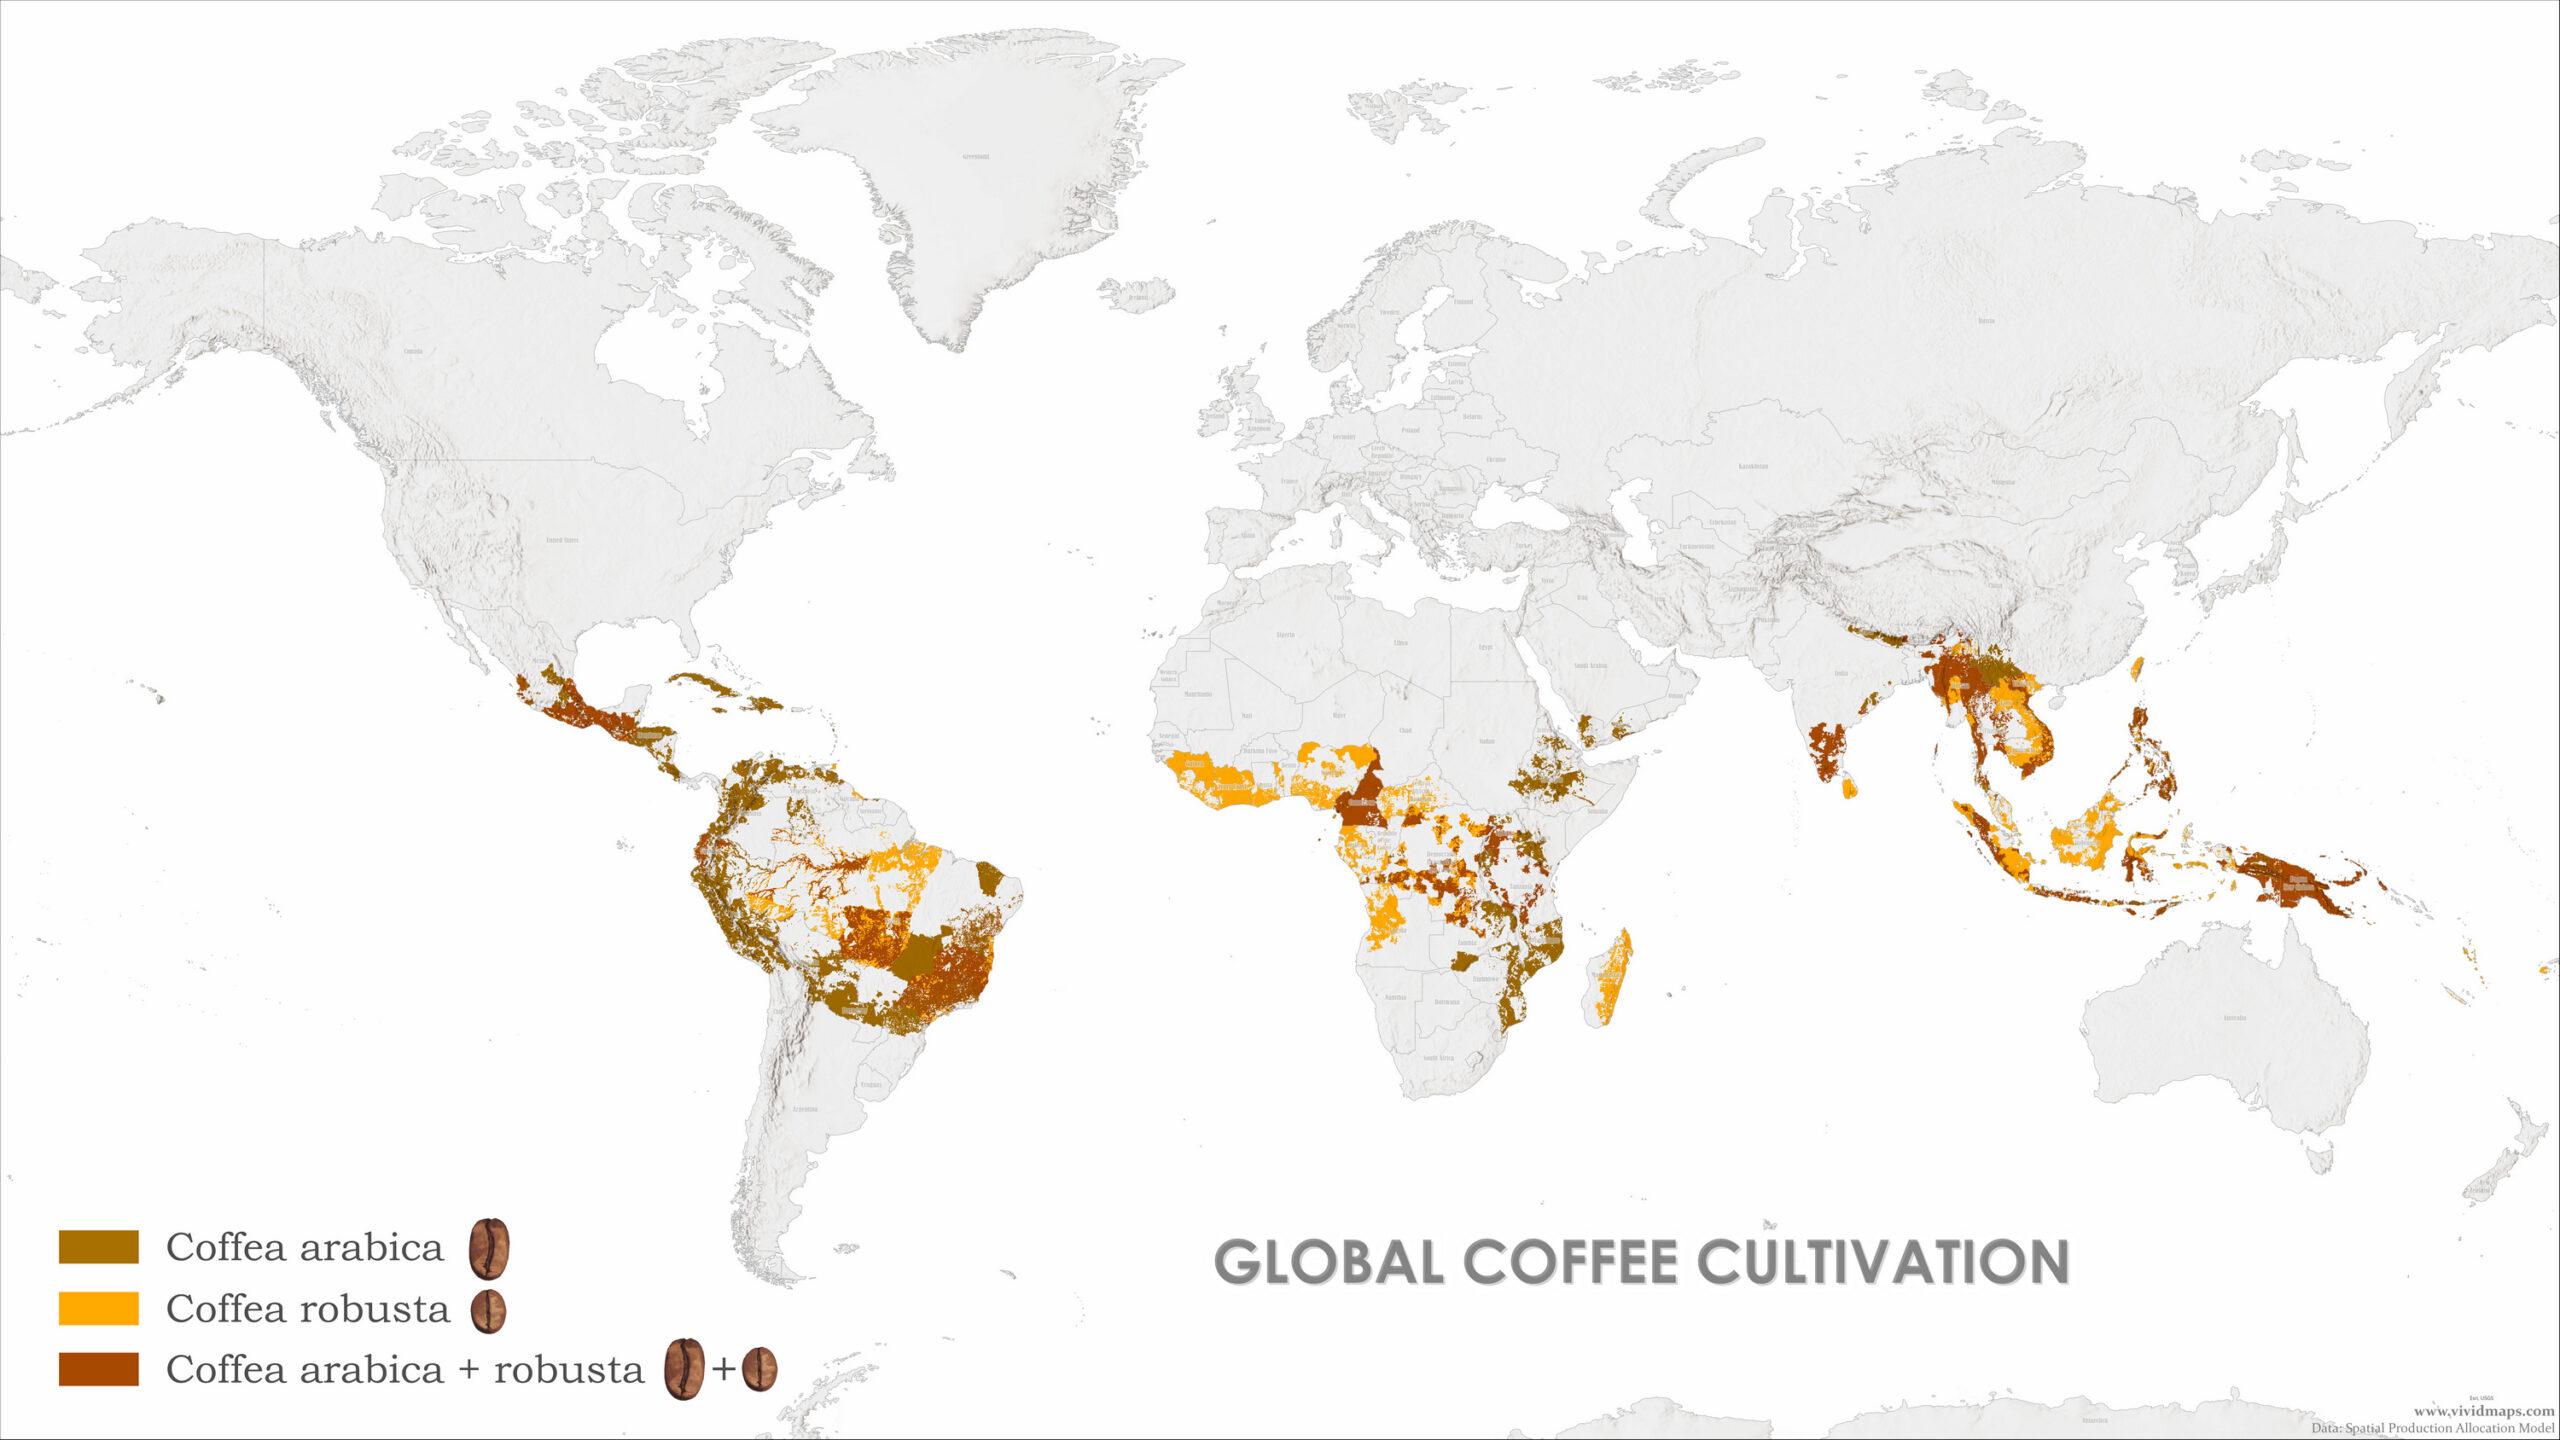
Coffee Species Distribution Map
The visualization titled \...
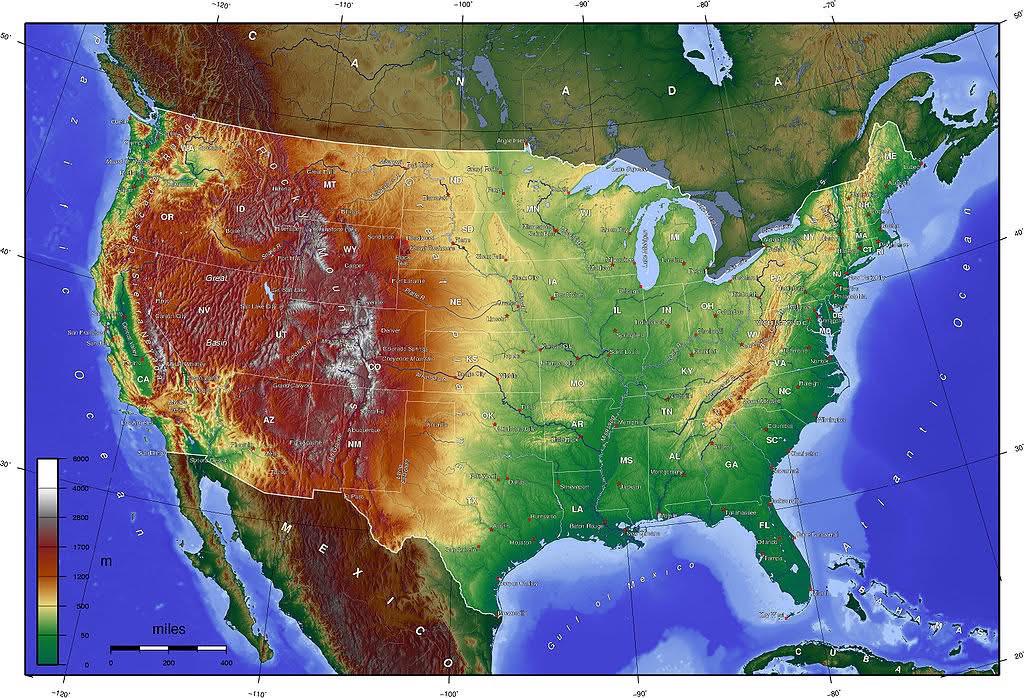
Topographic Map of the US
Transitioning from visualization to the actual topic, let’s delve deeper into the fascinating world of topography and it...
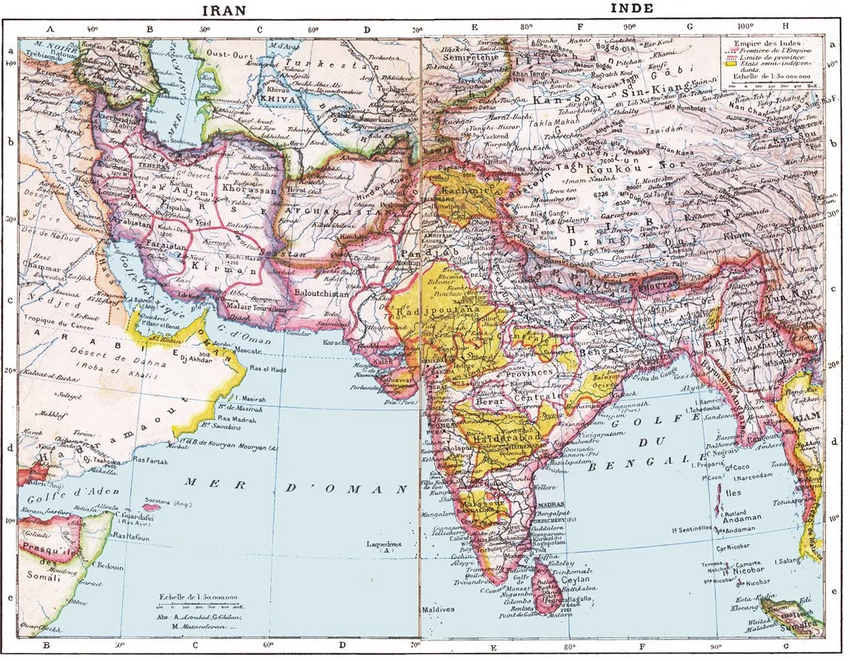
1907 French Colonial Map of South Asia
The 1907 French map of South Asia offers a detailed representation of the region during a pivotal time in its history. T...
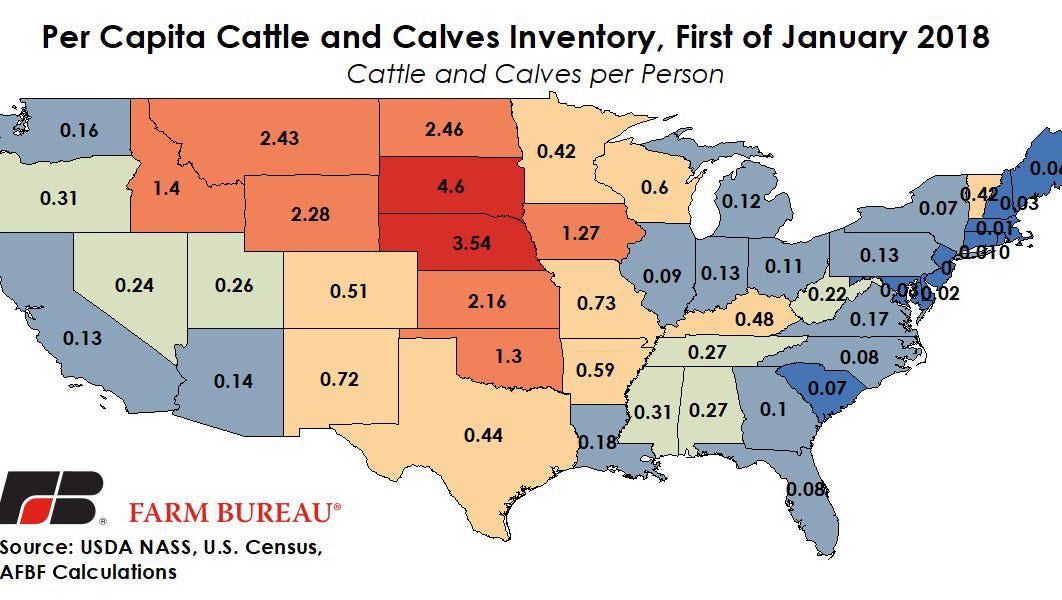
Number of Cows Per Person in Each State Map
The "Number of Cows Per Person in Each State" map provides an insightful visualization of how the cattle population in e...