US Average Day-Night Temperature Change Map

Marcus Rodriguez
Historical Geography Expert
Marcus Rodriguez specializes in historical cartography and geographic data analysis. With a background in both history and geography, he brings unique...
Geographic Analysis
What This Map Shows
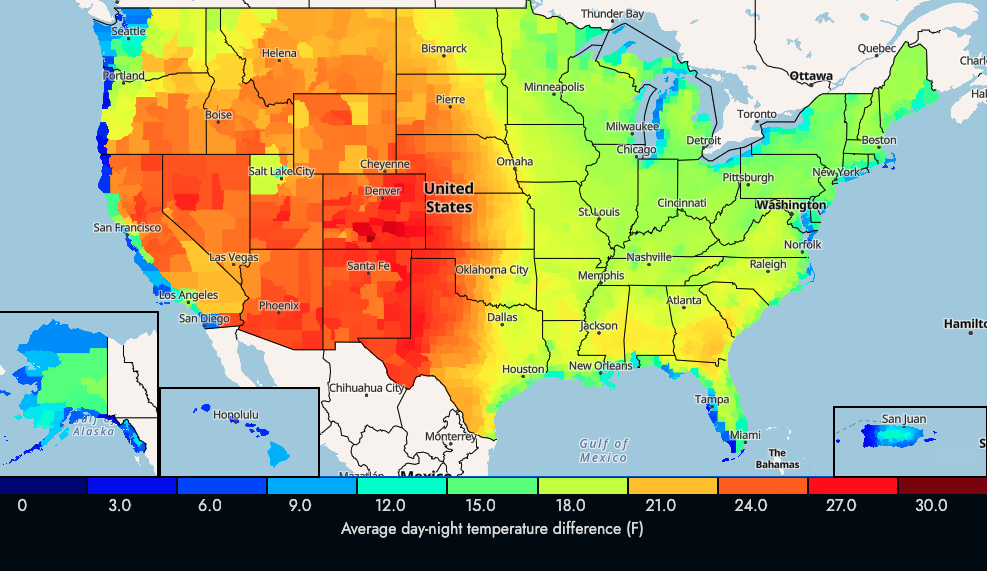
The visualization titled "US Average Day-Night Temperature Change in F" illustrates the differences between daytime and nighttime temperatures across the United States. By focusing on the temperature fluctuations within a 24-hour cycle, this map provides a clear picture of how much temperatures can vary from day to night in various regions. This information is crucial for understanding local climate patterns, agricultural practices, and energy consumption needs.
Deep Dive into Temperature Variations
Temperature variations between day and night, known in meteorology as diurnal temperature variation, can provide essential insights into a region's climate. During the day, the sun heats the Earth's surface, causing temperatures to rise significantly. At night, however, without the sun's warmth, these temperatures can drop sharply. Understanding these variations is vital for various sectors, including agriculture, urban planning, and energy consumption.
Interestingly, regions with high diurnal temperature variations often have dry climates, such as deserts. For example, in the Southwestern United States, places like Arizona experience extreme temperature differences—hot days can soar above 100°F, while nights can plummet to the 60s°F. This significant shift can affect crop growth, as certain plants require specific temperature ranges to thrive. In contrast, areas with a more moderate climate, like coastal regions, often see smaller differences, which can support a more stable ecosystem.
Moreover, diurnal temperature changes can impact energy consumption patterns. For instance, in places with high daytime temperatures, the demand for air conditioning spikes during the day, while heating needs may arise at night. This demand influences energy production and consumption strategies and highlights the importance of energy-efficient practices in managing temperature-related energy use.
Regional Analysis
Examining the map reveals distinct patterns across different regions of the U.S. The western states, particularly the arid Southwest, show marked day-night temperature differences. For example, cities like Las Vegas and Phoenix can have temperature variances of 30°F or more, especially during summer months. In contrast, the Northeast and Southeast regions, characterized by more humid conditions, experience lower temperature fluctuations, often ranging between 10°F and 20°F.
In the Midwest, variations can also be notable, particularly in states like North Dakota and South Dakota where the continental climate leads to significant temperature swings. These variations can influence agricultural practices, as farmers must adapt their planting and harvesting schedules based on predicted temperature changes.
Interestingly, urban areas often display different patterns when compared to their rural counterparts. Cities like New York and Los Angeles have been found to have a smaller day-night temperature variation due to the urban heat island effect, where buildings and paved surfaces retain heat. This phenomenon can lead to milder nighttime temperatures compared to surrounding rural areas, impacting everything from energy use to local wildlife.
Significance and Impact
Understanding the day-night temperature changes is not just an academic exercise; it has real-world implications. As climate change continues to affect weather patterns, monitoring these temperature variations becomes increasingly important. For example, regions that traditionally experience high diurnal temperature differences may find these patterns altered, leading to challenges in agriculture and water resources. Have you noticed how certain crops are more sensitive to temperature shifts? Farmers are already adapting to these changes by selecting more resilient plant varieties.
Moreover, knowing about temperature variations can aid in disaster preparedness. For instance, areas prone to extreme heat during the day may face increased health risks, particularly among vulnerable populations. By understanding these patterns, communities can implement cooling centers and public health campaigns to mitigate these risks.
In conclusion, the US Average Day-Night Temperature Change Map is a valuable tool for understanding the complexities of temperature variations across the country. As we continue to navigate the impacts of climate change, insights gained from such maps will become crucial for environmental management, urban planning, and public health initiatives. What changes do you think we might see in the coming years as temperatures continue to fluctuate?
Visualization Details
- Published
- September 29, 2025
- Views
- 52
Comments
Loading comments...