temperature Maps
6 geographic visualizations tagged with "temperature"
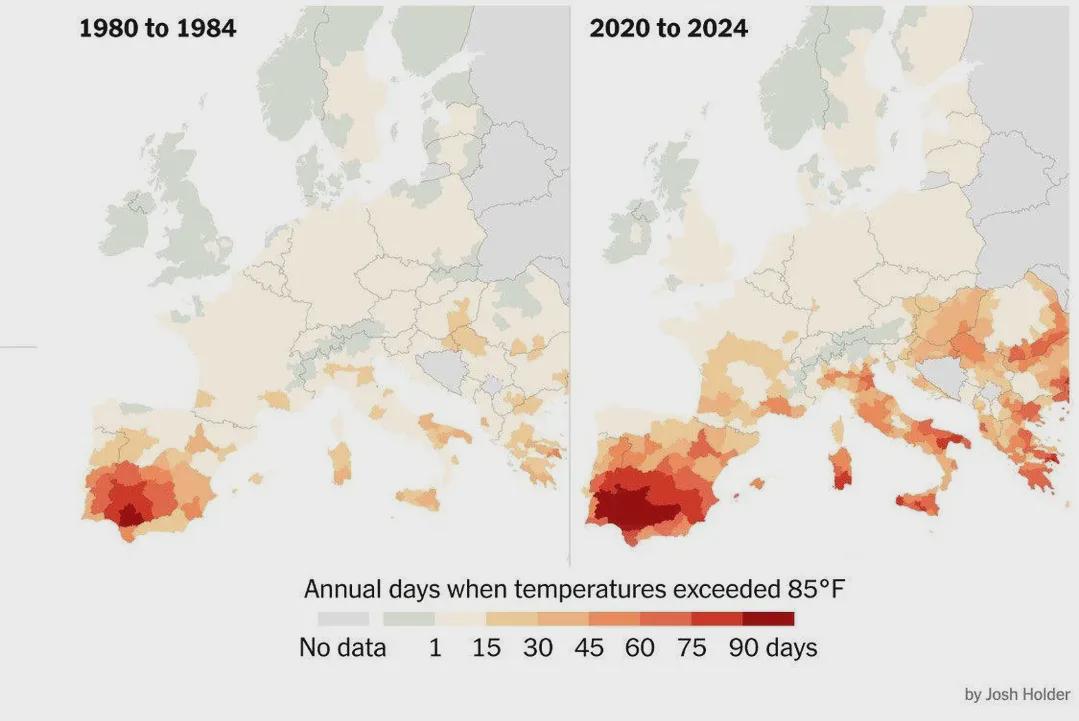
Days Over 30ºC in Europe Map
The visualization titled "Number of Days per Year When Temperatures Exceeded 30ºC (85°F) in Europe" provides a comprehen...
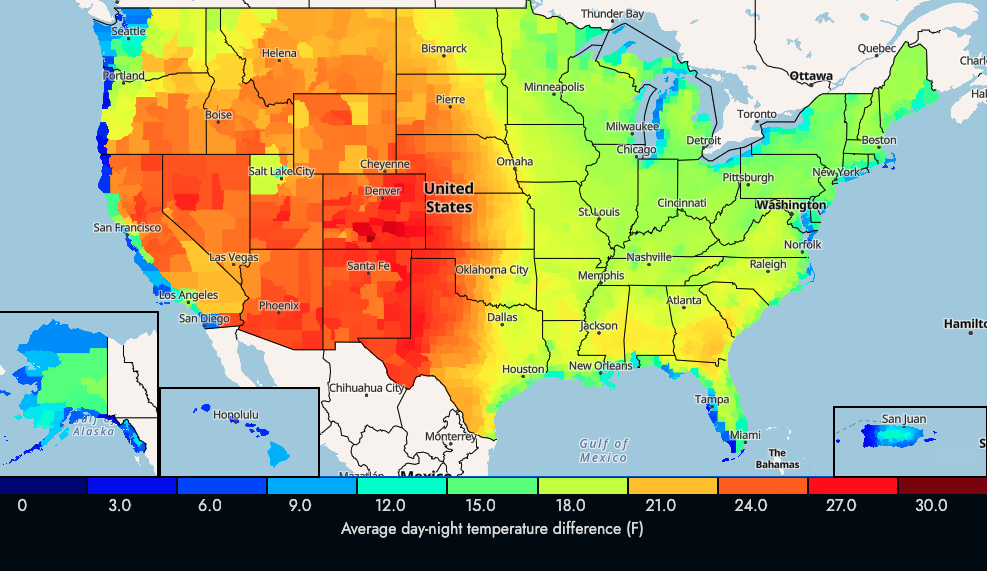
US Average Day-Night Temperature Change Map
The visualization titled "US Average Day-Night Temperature Change in F" illustrates the differences between daytime and ...
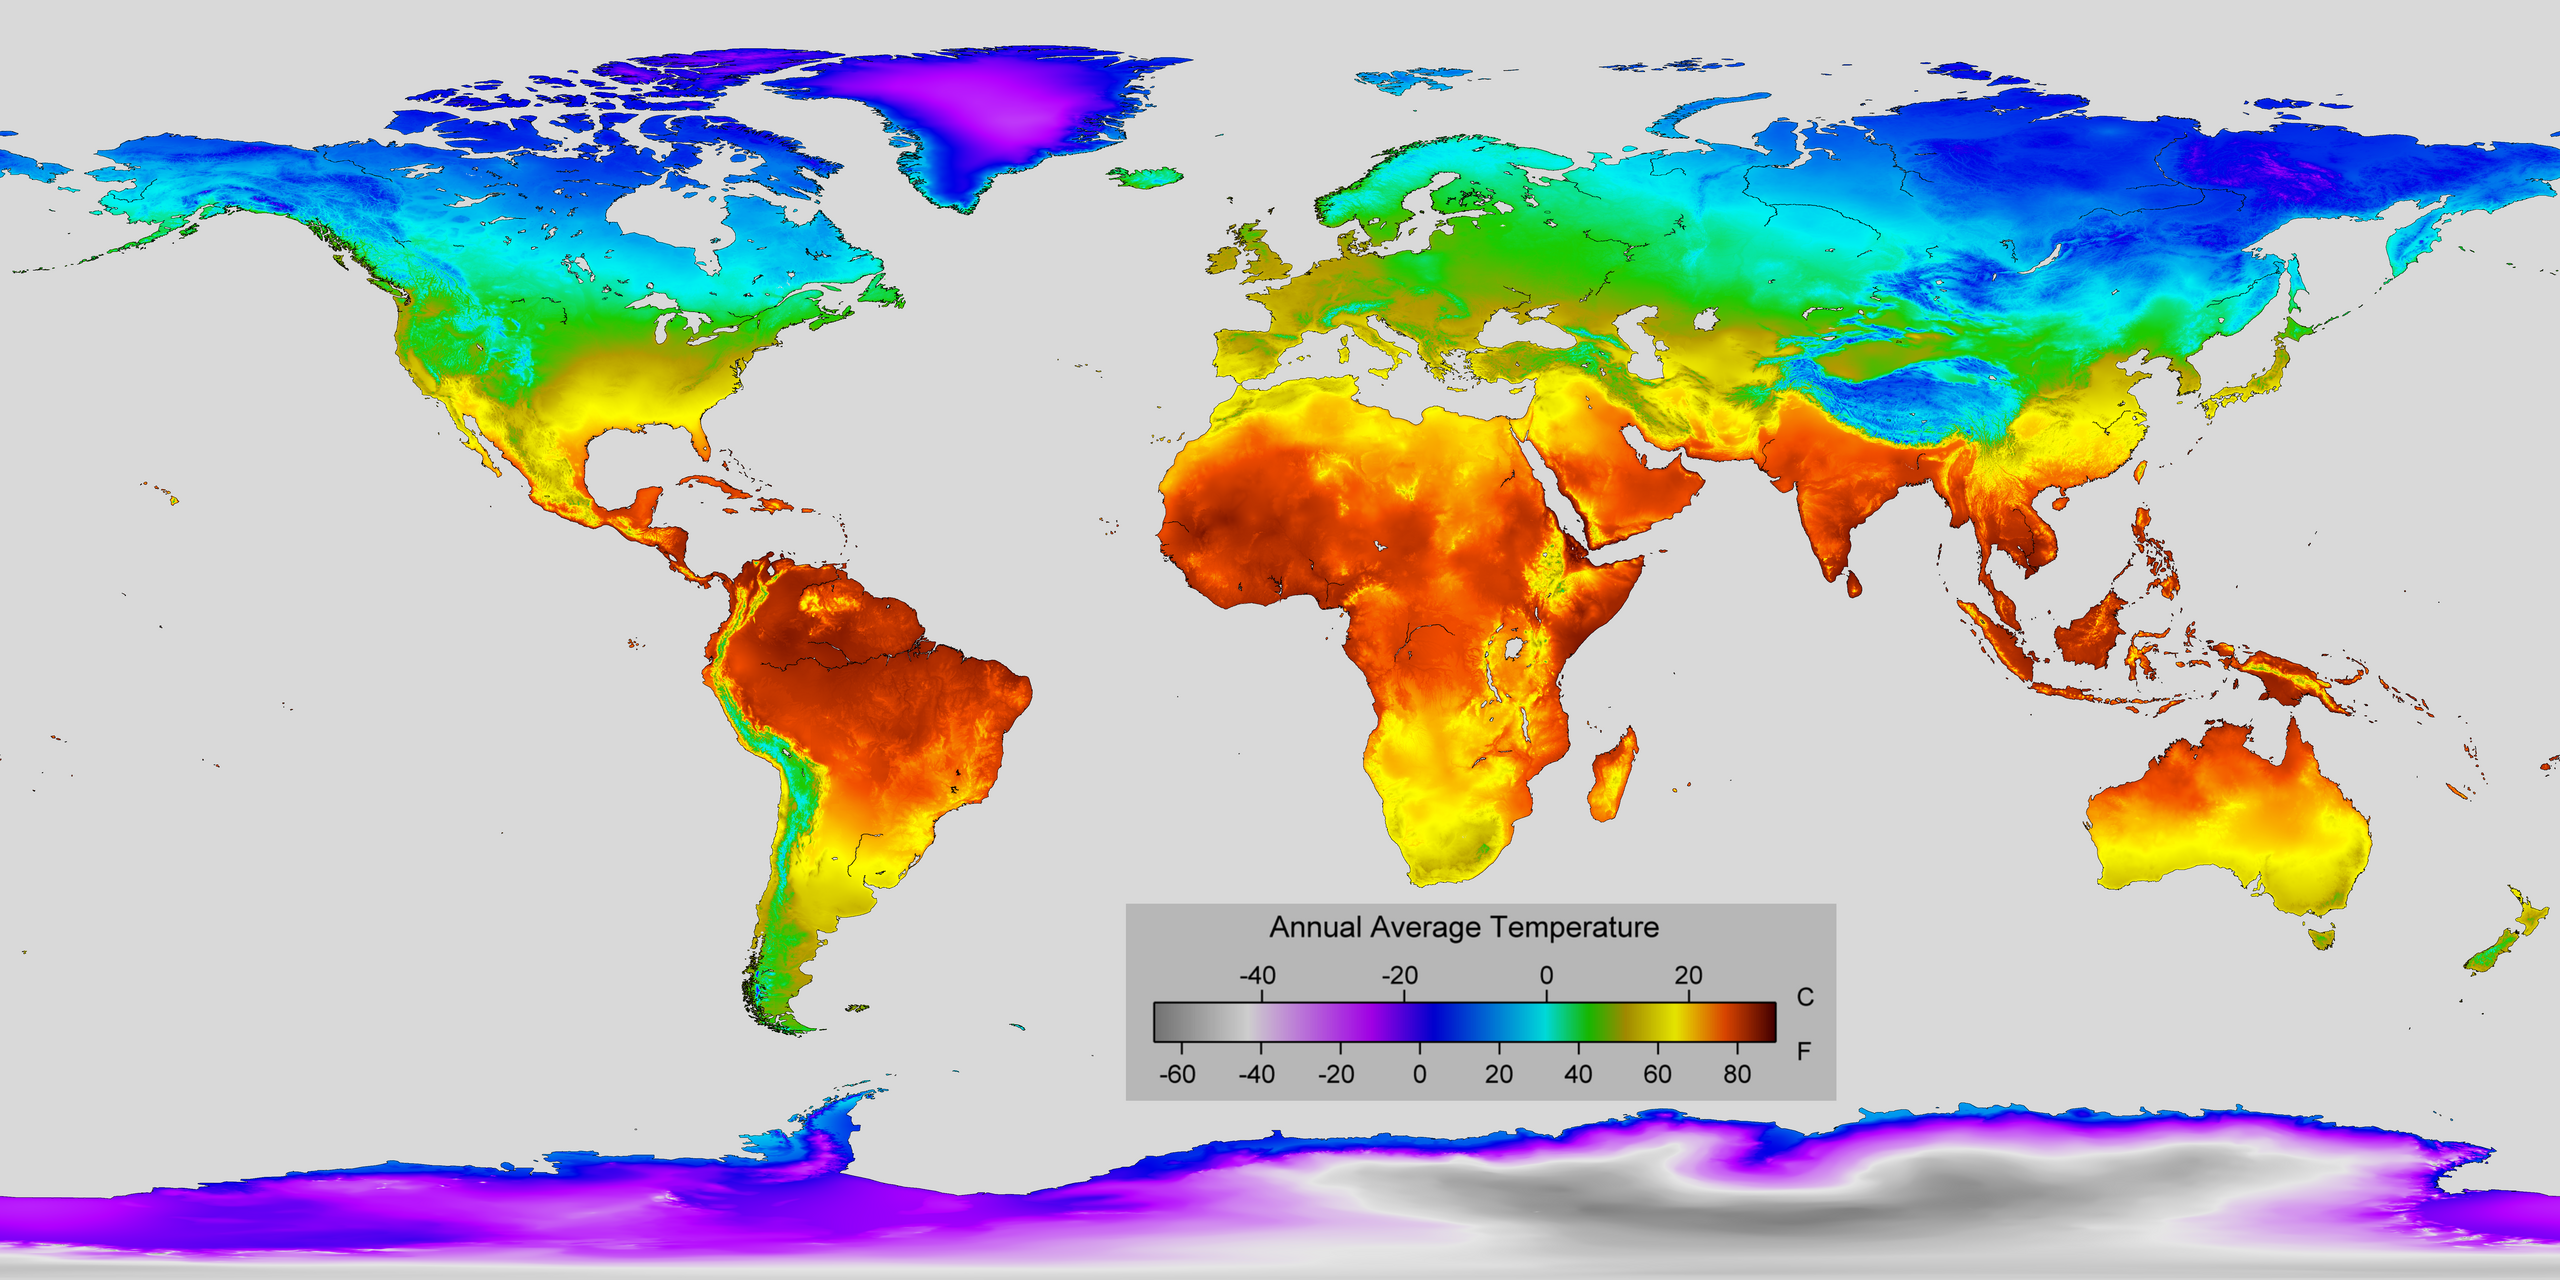
Average Annual Temperature World Map
The "Average Annual Temperature World Map" provides a comprehensive visual representation of temperature variations acro...
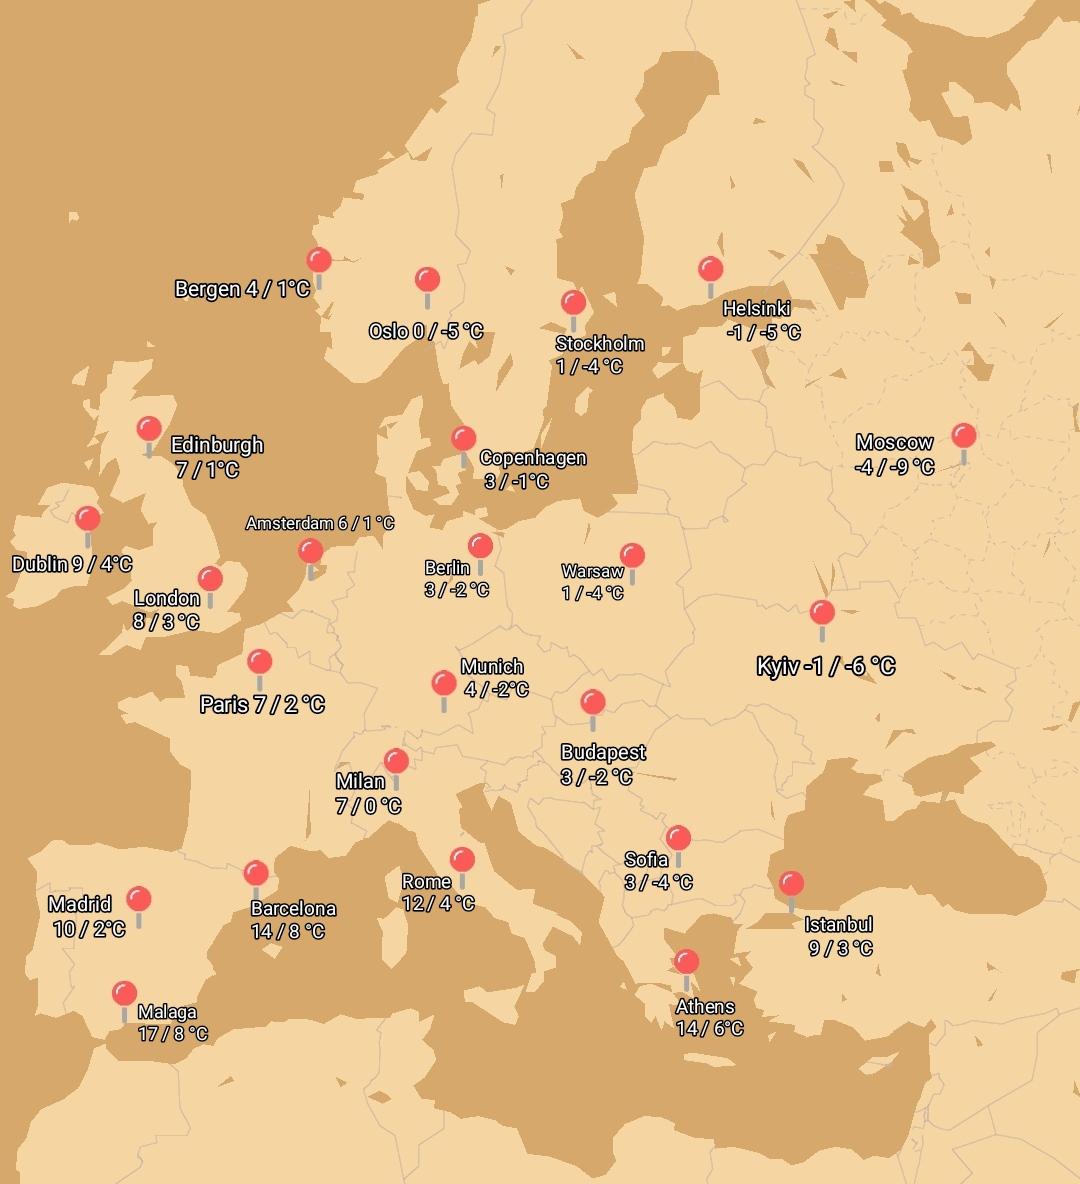
Average January High Low Temperature Map of European Cities
The visualization presents the average high and low temperatures in January across various European cities, providing a ...
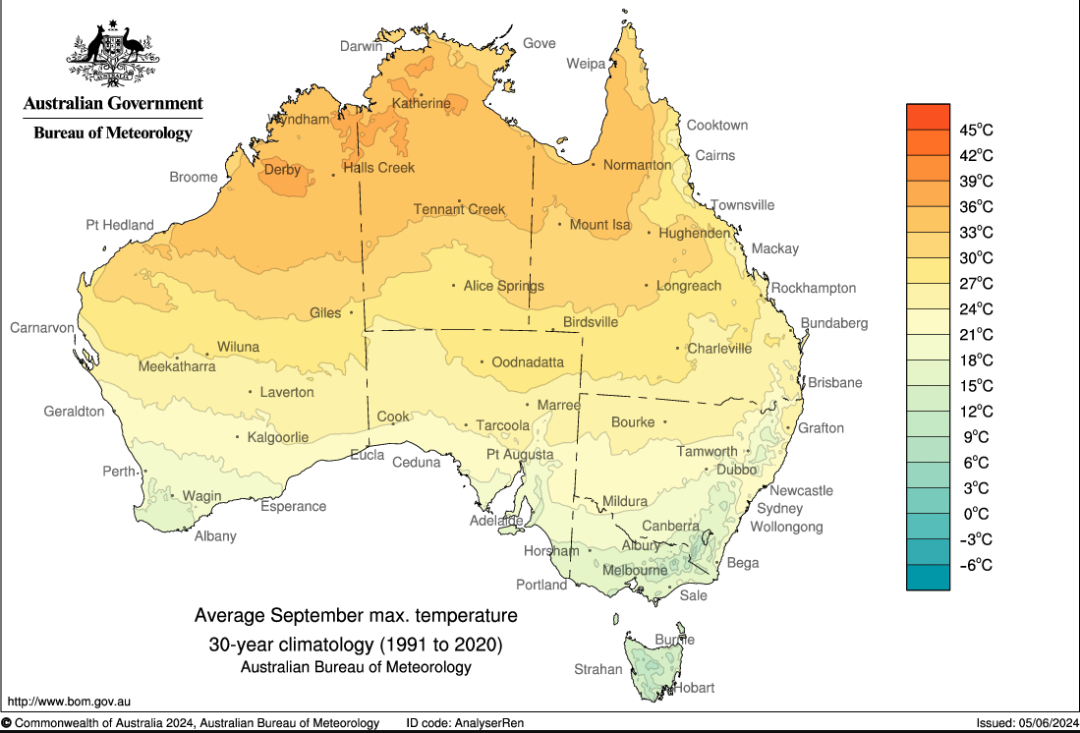
Average Maximum September Temperature Map of Australia
The "Average Maximum September Temperature in Australia" map provides a visual representation of the temperature variati...
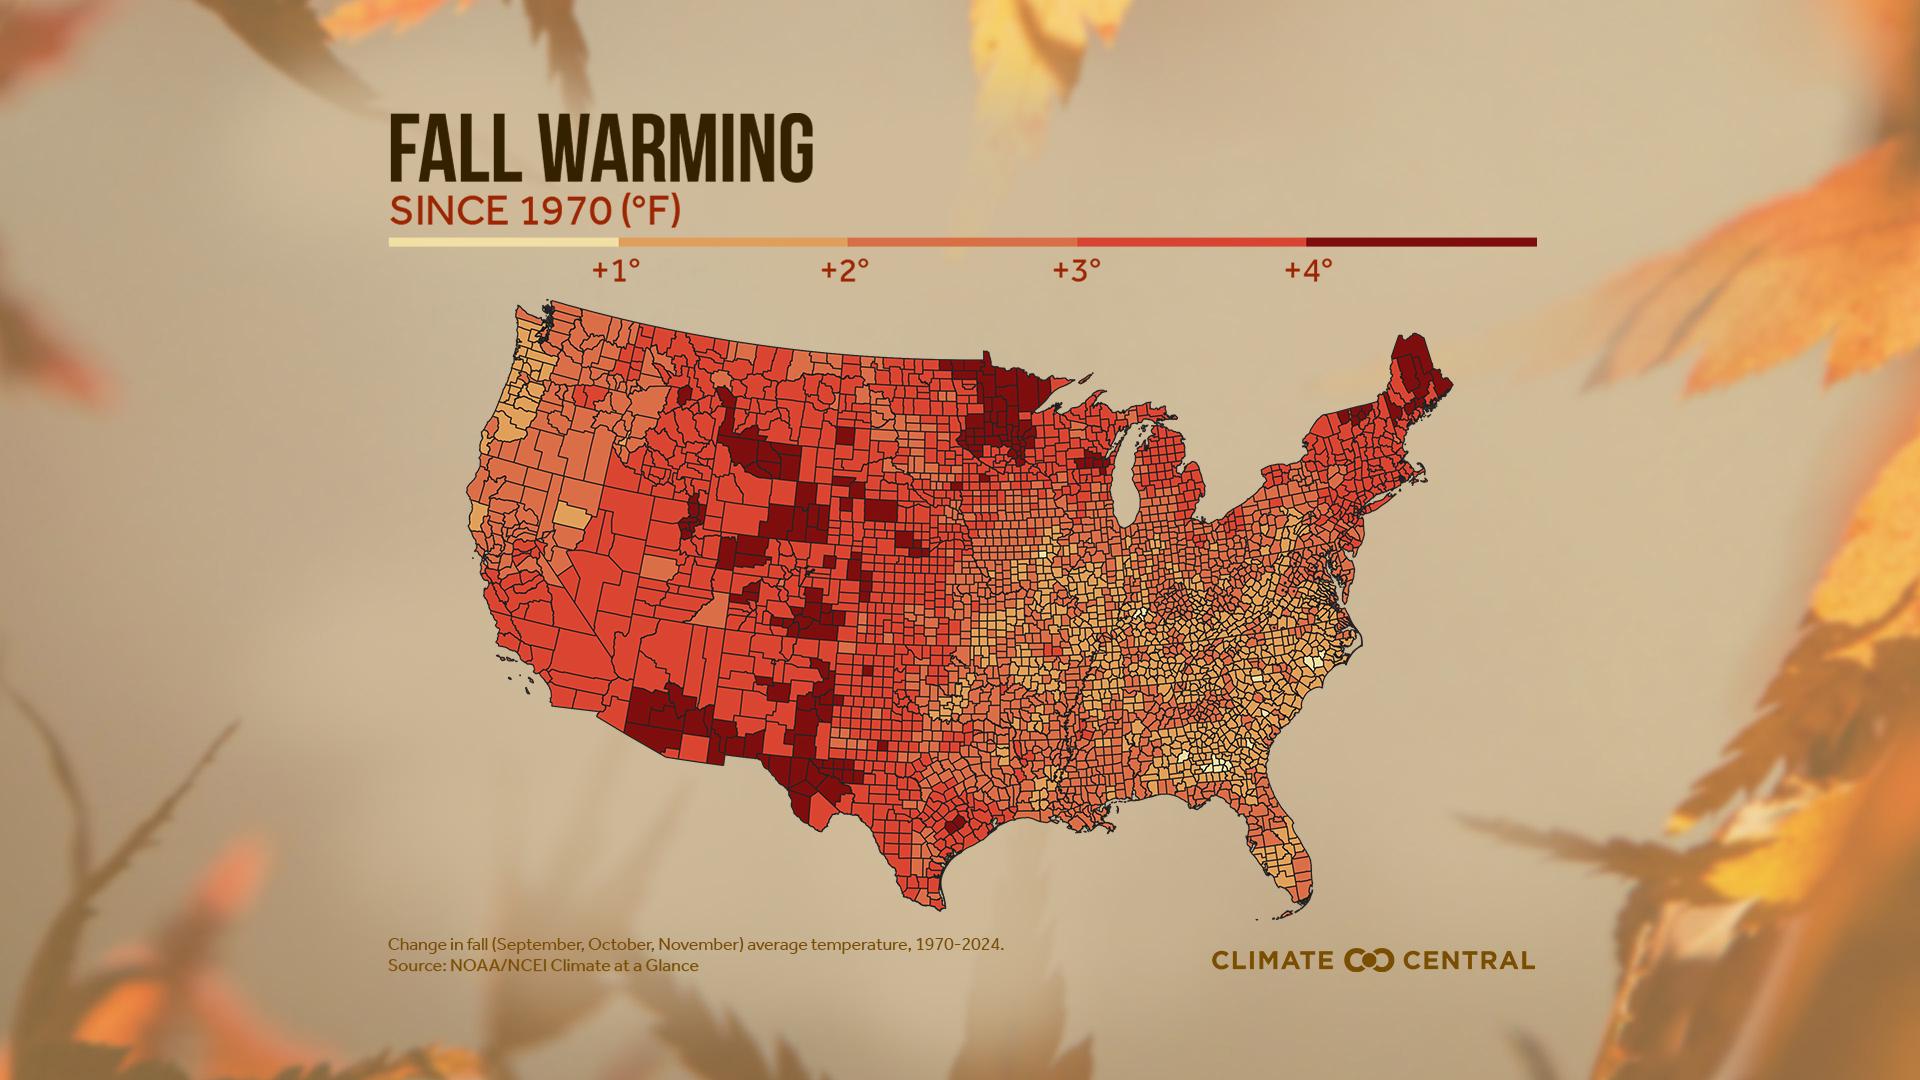
Average Fall Temperature Increase Since 1970 Map
The "Average Fall Temperature Increase Since 1970 Map" provides a visual representation of the changes in fall temperatu...