Average Maximum September Temperature Map of Australia

David Chen
Data Visualization Specialist
David Chen is an expert in transforming complex geographic datasets into compelling visual narratives. He combines his background in computer science ...
Geographic Analysis
What This Map Shows
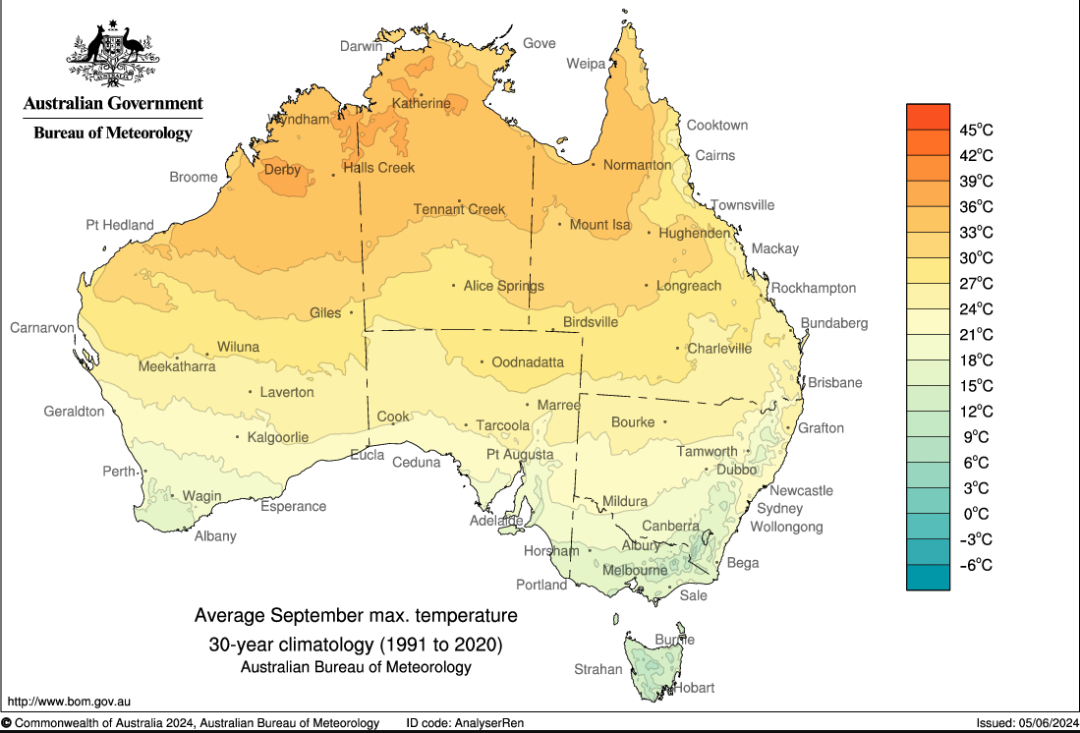
The "Average Maximum September Temperature in Australia" map provides a visual representation of the temperature variations across the continent during the month of September. Utilizing data sourced from the Bureau of Meteorology, this map highlights the average maximum temperatures reached in various regions of Australia, offering valuable insights into the climatic conditions experienced at the onset of spring.
As September marks the transition from winter to spring in Australia, it's crucial to understand how this shift impacts temperature patterns. The map illustrates a gradient of temperatures, with warmer regions typically found in the northern parts of the country and cooler temperatures recorded in the southern regions. This visualization not only helps us comprehend the seasonal climate changes but also serves as a useful tool for various applications, including agriculture, tourism planning, and environmental studies.
Deep Dive into Australia’s September Climate
September in Australia is characterized by a diverse climate that varies significantly from one region to another. The continent's size and geographical diversity lead to distinct weather patterns. For instance, tropical northern regions, such as Queensland and the Northern Territory, experience warm and humid conditions, with average maximum temperatures often exceeding 30°C (86°F). In contrast, southern regions, including Tasmania and parts of Victoria, tend to have much milder temperatures, usually hovering around 15°C to 20°C (59°F to 68°F).
Interestingly, September also marks the beginning of the wildflower season in Australia, particularly in Western Australia, where the warmer temperatures trigger a stunning display of blooms. This seasonal change not only attracts tourists but also significantly impacts local ecosystems. The increase in temperature can affect plant growth, animal behavior, and even the timing of seasonal migration patterns.
Furthermore, the average maximum temperatures in September can be influenced by various climatic factors, including ocean currents, prevailing winds, and regional geography. For instance, coastal regions may experience moderating influences from the ocean, resulting in less extreme temperature variations than inland areas. The Great Dividing Range also plays a crucial role in shaping local climates, creating rain shadows and varying temperatures on either side.
Regional Analysis
Examining the map closely reveals intriguing regional patterns. In the northern regions, such as Darwin, average maximum temperatures can reach around 33°C (91°F), making it one of the hottest areas in September. This is contrasted by southern cities like Hobart, where temperatures average around 15°C (59°F).
Central Australia, particularly the outback areas around Alice Springs, showcases a stark temperature difference with averages around 27°C (81°F) but can experience significant daily temperature fluctuations, sometimes swinging from warm days to much cooler nights. The southeastern coastal areas, including Melbourne and Sydney, typically record average maxima in the mid-20s°C (low 70s°F), making them popular destinations for springtime activities.
Moreover, the southeast generally receives more precipitation during this time, contributing to lush landscapes, while the arid interior remains dry and hot. The variation across regions emphasizes the importance of localized weather patterns, which can significantly affect agricultural practices and water resources.
Significance and Impact
Understanding the average maximum temperatures of September in Australia is more than an academic exercise; it has real-world implications. For farmers, predicting temperature trends is essential for crop planning and management. Warmer temperatures may lead to earlier planting seasons, but they can also increase the risk of heat stress on crops, impacting yield.
Tourism is another sector that relies heavily on seasonal weather patterns. The pleasant spring weather in September draws visitors to Australia’s many natural attractions, influencing the economy positively. However, with climate change leading to more extreme weather events, the implications of temperature variations are becoming increasingly critical. The rise in average temperatures can exacerbate drought conditions, affecting water supply and biodiversity.
Additionally, urban planning and infrastructure development are deeply influenced by seasonal temperature trends. Understanding these patterns helps cities prepare for heatwaves and manage energy consumption effectively. As we move forward, ongoing research and monitoring of Australia's climatic conditions will be essential in addressing the challenges posed by climate variability and ensuring sustainable development.
In summary, the Average Maximum September Temperature Map of Australia is not merely a tool for viewing climate data; it is a reflection of the intricate relationship between geography, ecology, and human activities that shape our world. As we continue to study these patterns, we can better equip ourselves to navigate the complexities of our environment and its ever-evolving climate.
Visualization Details
- Published
- September 25, 2025
- Views
- 68
Comments
Loading comments...