Average Fall Temperature Increase Since 1970 Map

David Chen
Data Visualization Specialist
David Chen is an expert in transforming complex geographic datasets into compelling visual narratives. He combines his background in computer science ...
Geographic Analysis
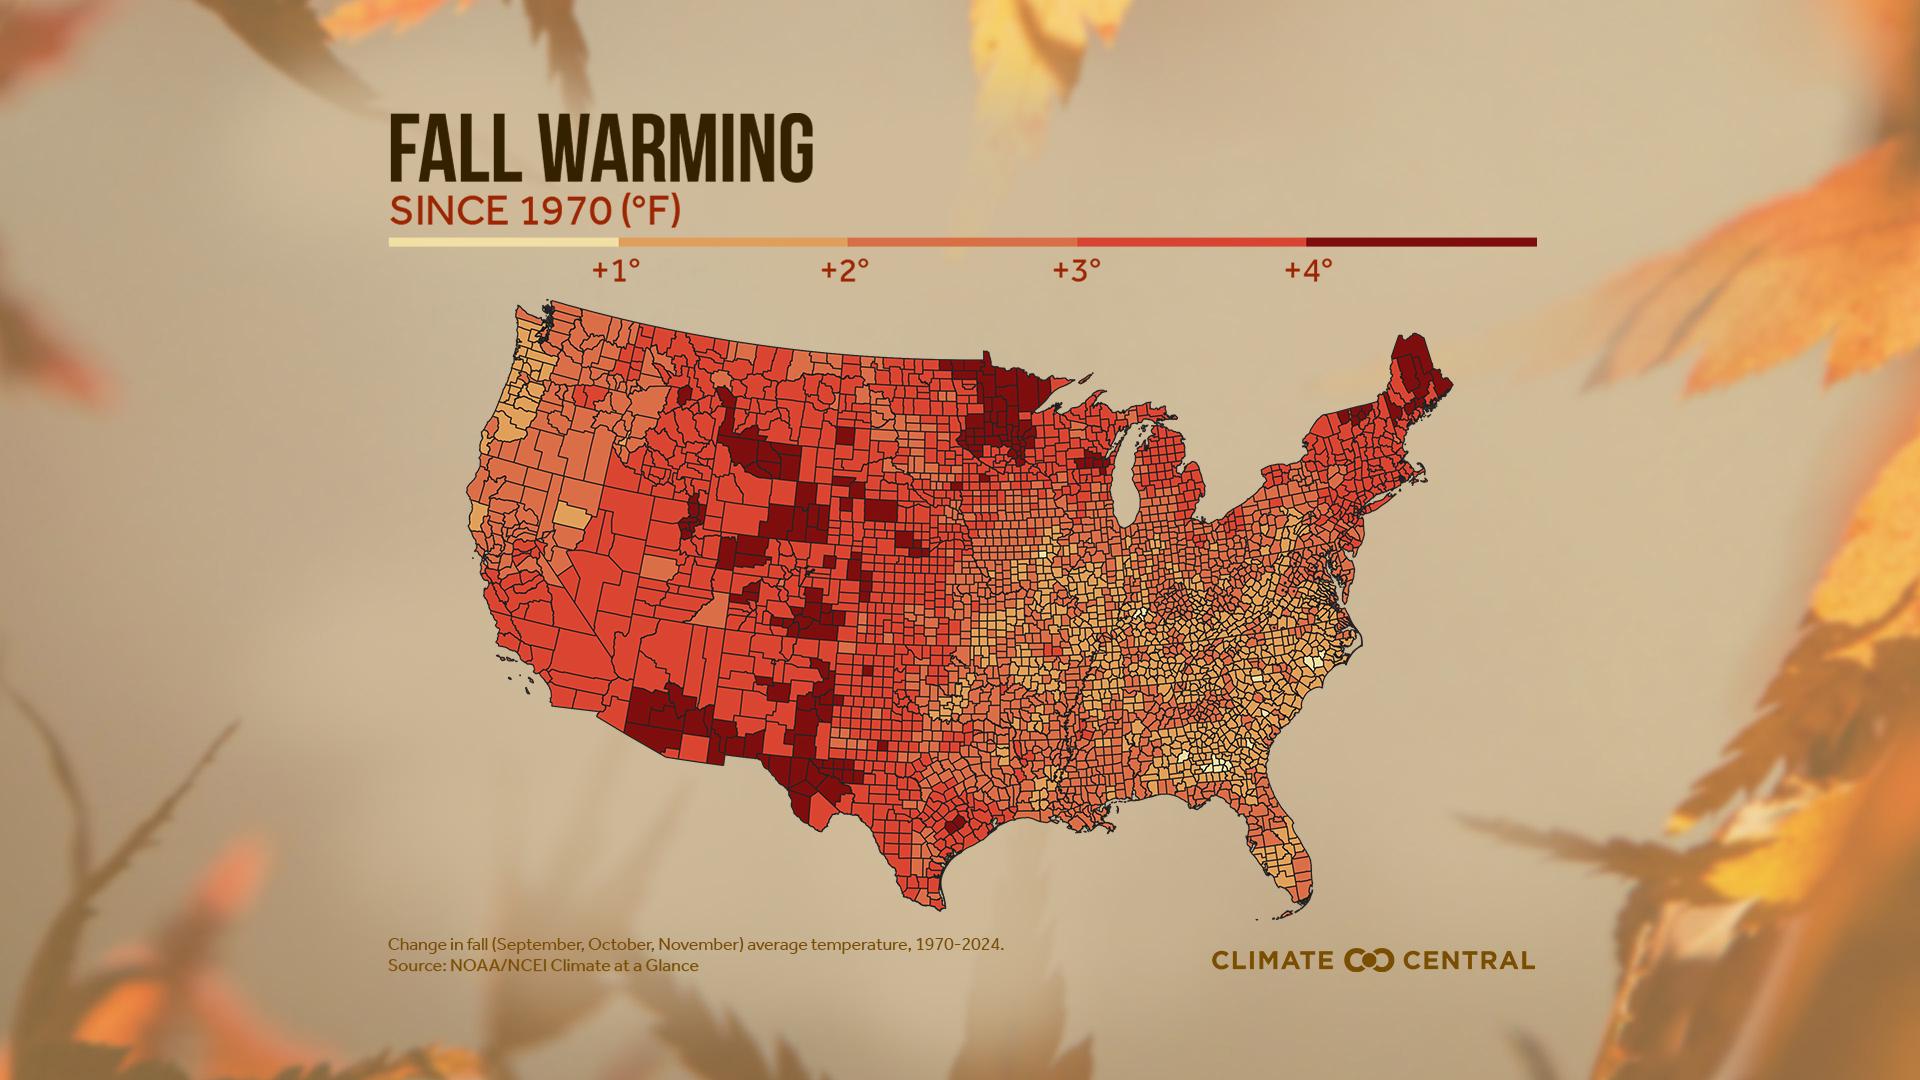
What This Map Shows
The "Average Fall Temperature Increase Since 1970 Map" provides a visual representation of the changes in fall temperatures across various regions over the past several decades. This map highlights how different areas have experienced varying degrees of warming during the fall months, which can have significant implications for ecosystems, agriculture, and human activities. As fall is traditionally viewed as a transitional season, the temperature fluctuations depicted on this map shed light on broader climate trends that are reshaping our planet.
Deep Dive into Temperature Changes
Temperature is a fundamental climate variable that affects every aspect of life on Earth. When we discuss average fall temperatures, we are particularly interested in how these changes impact natural ecosystems, agriculture, and even human health. Since 1970, numerous studies have documented a warming trend across the globe, with fall temperatures rising significantly in many regions. Interestingly, the fall season has seen a more pronounced increase than other seasons in some areas, primarily due to the complex interplay of climate change factors.
For instance, warmer fall temperatures can lead to altered plant growth cycles, affecting flowering times and fruiting seasons. This shift can disrupt local ecosystems, as species that rely on specific seasonal cues may struggle to adapt. Moreover, the increase in temperature can lead to a longer growing season, which might seem beneficial at first glance; however, it can also expose crops to late-season pests and diseases that were previously kept at bay by cooler weather.
According to the National Oceanic and Atmospheric Administration (NOAA), the average fall temperature in the contiguous United States has increased by approximately 2°F since 1970. This increase is not uniform; some regions have experienced temperature rises of over 4°F. In particular, the northeastern U.S. and parts of the Midwest have seen the most significant increases—regions that are home to vital agricultural production.
Interestingly, this temperature rise is linked to changes in atmospheric conditions, including greenhouse gas concentrations and land use changes. Urban areas tend to experience these changes more acutely due to the urban heat island effect, where built environments absorb and retain heat more than natural landscapes. This further emphasizes the need for urban planners and policymakers to consider climate trends in their development strategies.
Regional Analysis
When we look at the map, we can observe distinct regional patterns in fall temperature increases. For example, the Northeastern U.S. has experienced some of the highest increases, with states like New York and Massachusetts reporting average fall temperature rises of over 3°F. This trend can be attributed to a combination of factors, including increased urbanization and changes in land use.
Conversely, the Pacific Northwest has seen a more moderate increase, averaging around 1.5°F. This region's unique geography, with its mountains and coastlines, influences its climate patterns and may mitigate some of the temperature rise seen elsewhere. On the other hand, areas like the Southeastern U.S. have experienced warming trends that can exacerbate extreme weather events, such as hurricanes and tropical storms, further complicating the climate narrative.
Interestingly, regions that rely heavily on agriculture, such as the Midwest, are facing dual challenges: rising fall temperatures and unpredictable weather patterns. Farmers may need to adapt their planting and harvesting schedules to align with these new temperature norms, which could lead to economic shifts in the farming community.
Significance and Impact
Understanding the implications of changing fall temperatures is crucial for several reasons. Firstly, it highlights the urgency of addressing climate change and its broader impacts on our environment. As temperatures continue to rise, we may witness shifts in agricultural productivity, increased health risks due to heat exposure, and altered ecosystems that could threaten biodiversity.
Moreover, policymakers and communities need to take these trends into account when planning for the future. For instance, cities may need to rethink infrastructure, such as cooling centers during heat waves, or invest in sustainable agricultural practices to mitigate the potential adverse effects of rising temperatures.
Current projections suggest that if we do not take significant action to curb greenhouse gas emissions, average global temperatures could rise by another 2°F to 4°F by the end of the century. This warming could lead to more severe consequences, including increased flooding, droughts, and heatwaves. The need for climate resilience strategies becomes even more pressing as we navigate these changes.
In conclusion, the "Average Fall Temperature Increase Since 1970 Map" is not just a snapshot of changing temperatures; it serves as a call to action for communities, policymakers, and individuals alike. By understanding the intricacies of these temperature changes, we can better prepare for the challenges that lie ahead in our ever-evolving climate landscape.
Visualization Details
- Published
- September 2, 2025
- Views
- 86
Comments
Loading comments...