climate change Maps
110 geographic visualizations tagged with "climate change"
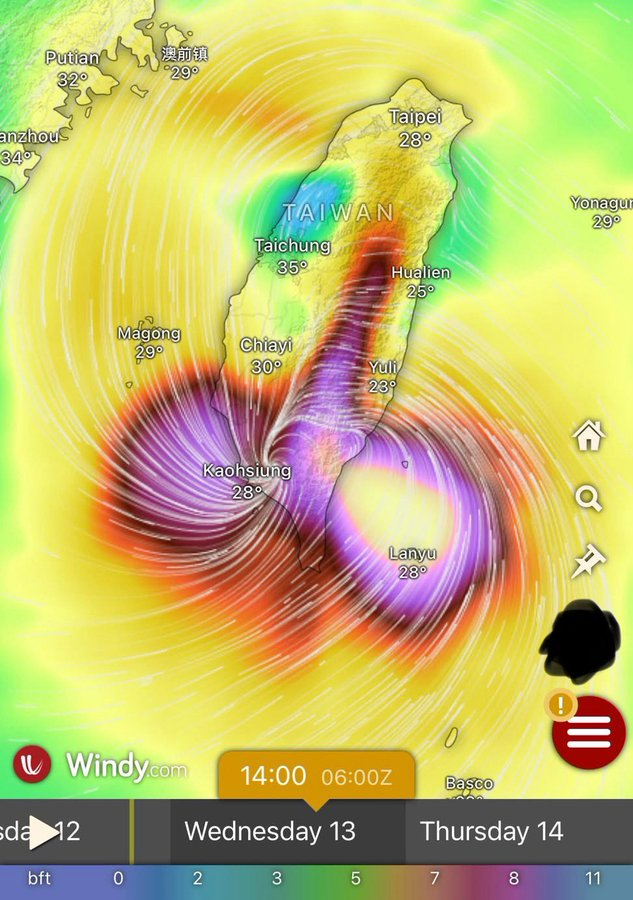
Typhoon Podul Atmospheric Map Over Taiwan and South China
Typhoon Podul, like many of its predecessors, has its origins in the western Pacific Ocean. As it moves towards Taiwan a...
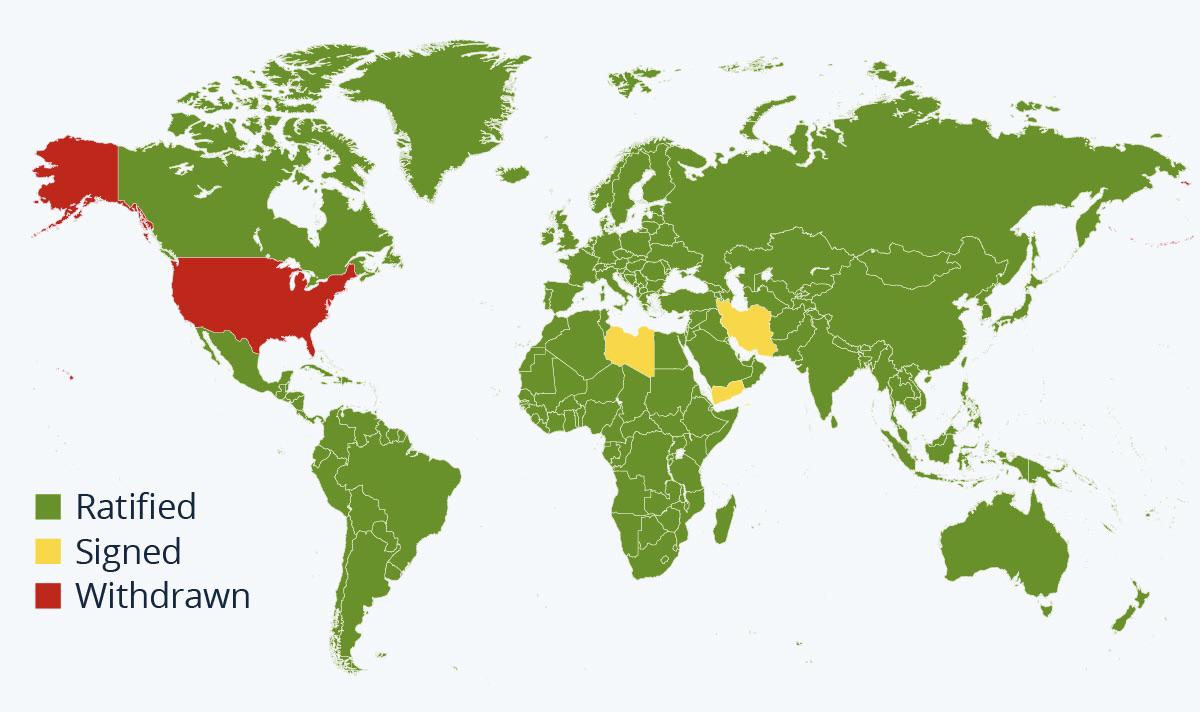
Map of Countries in the Paris Agreement
The visualization titled "A Map Of Every Country That Is In The Paris Agreement" succinctly illustrates the global commi...
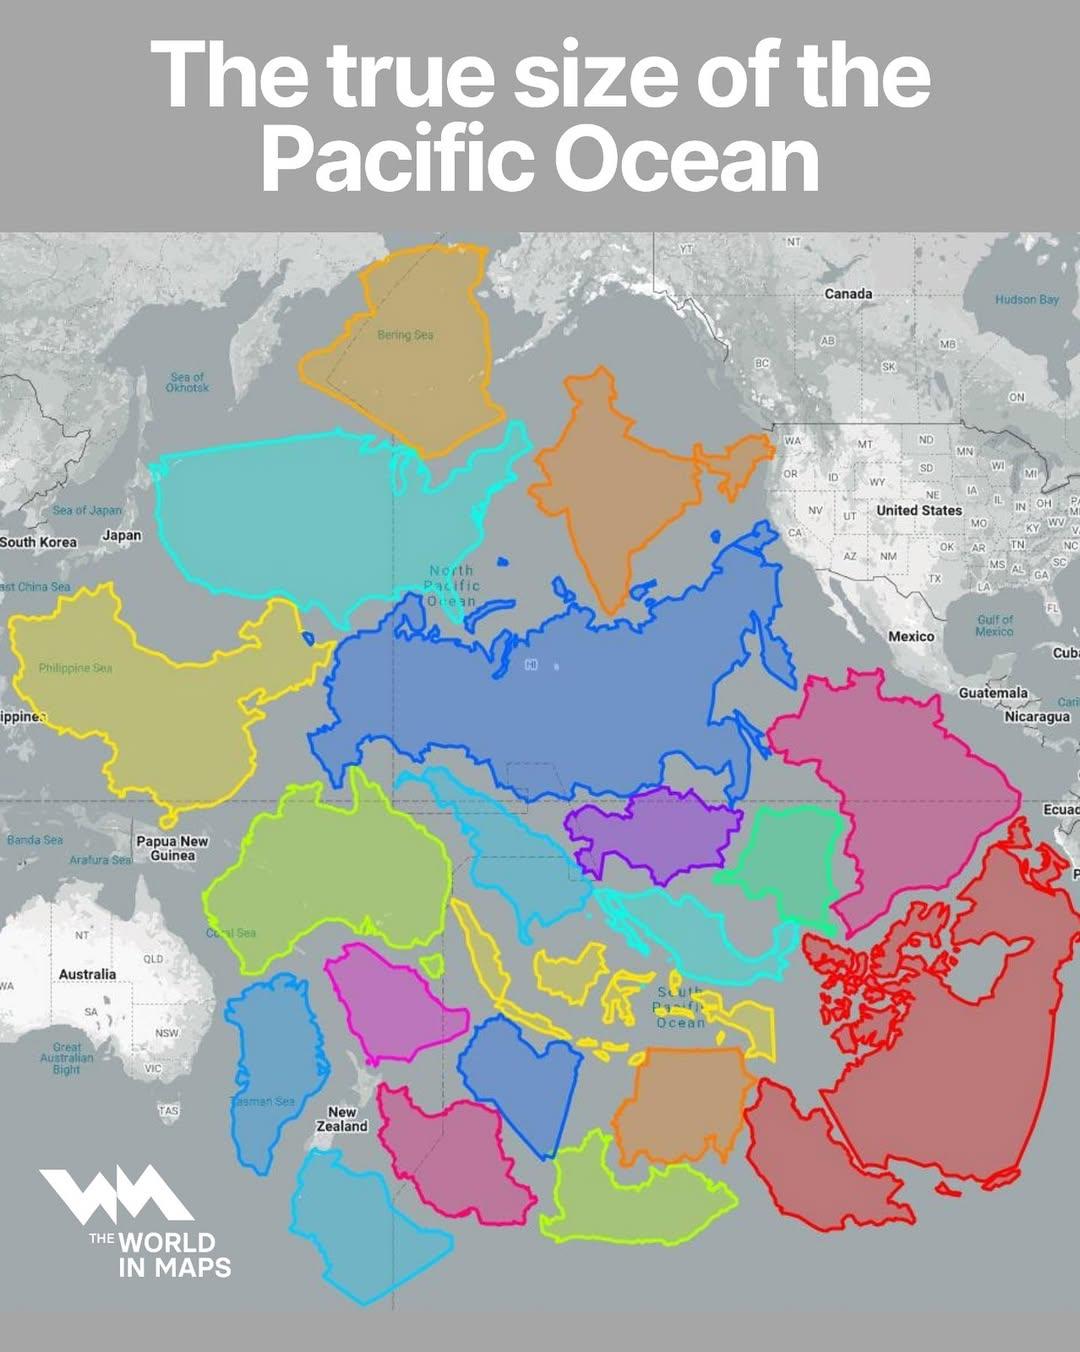
Map of the True Size of the Pacific Ocean
The visualization titled "The True Size of the Pacific Ocean" illustrates the vastness of the Pacific Ocean by accuratel...
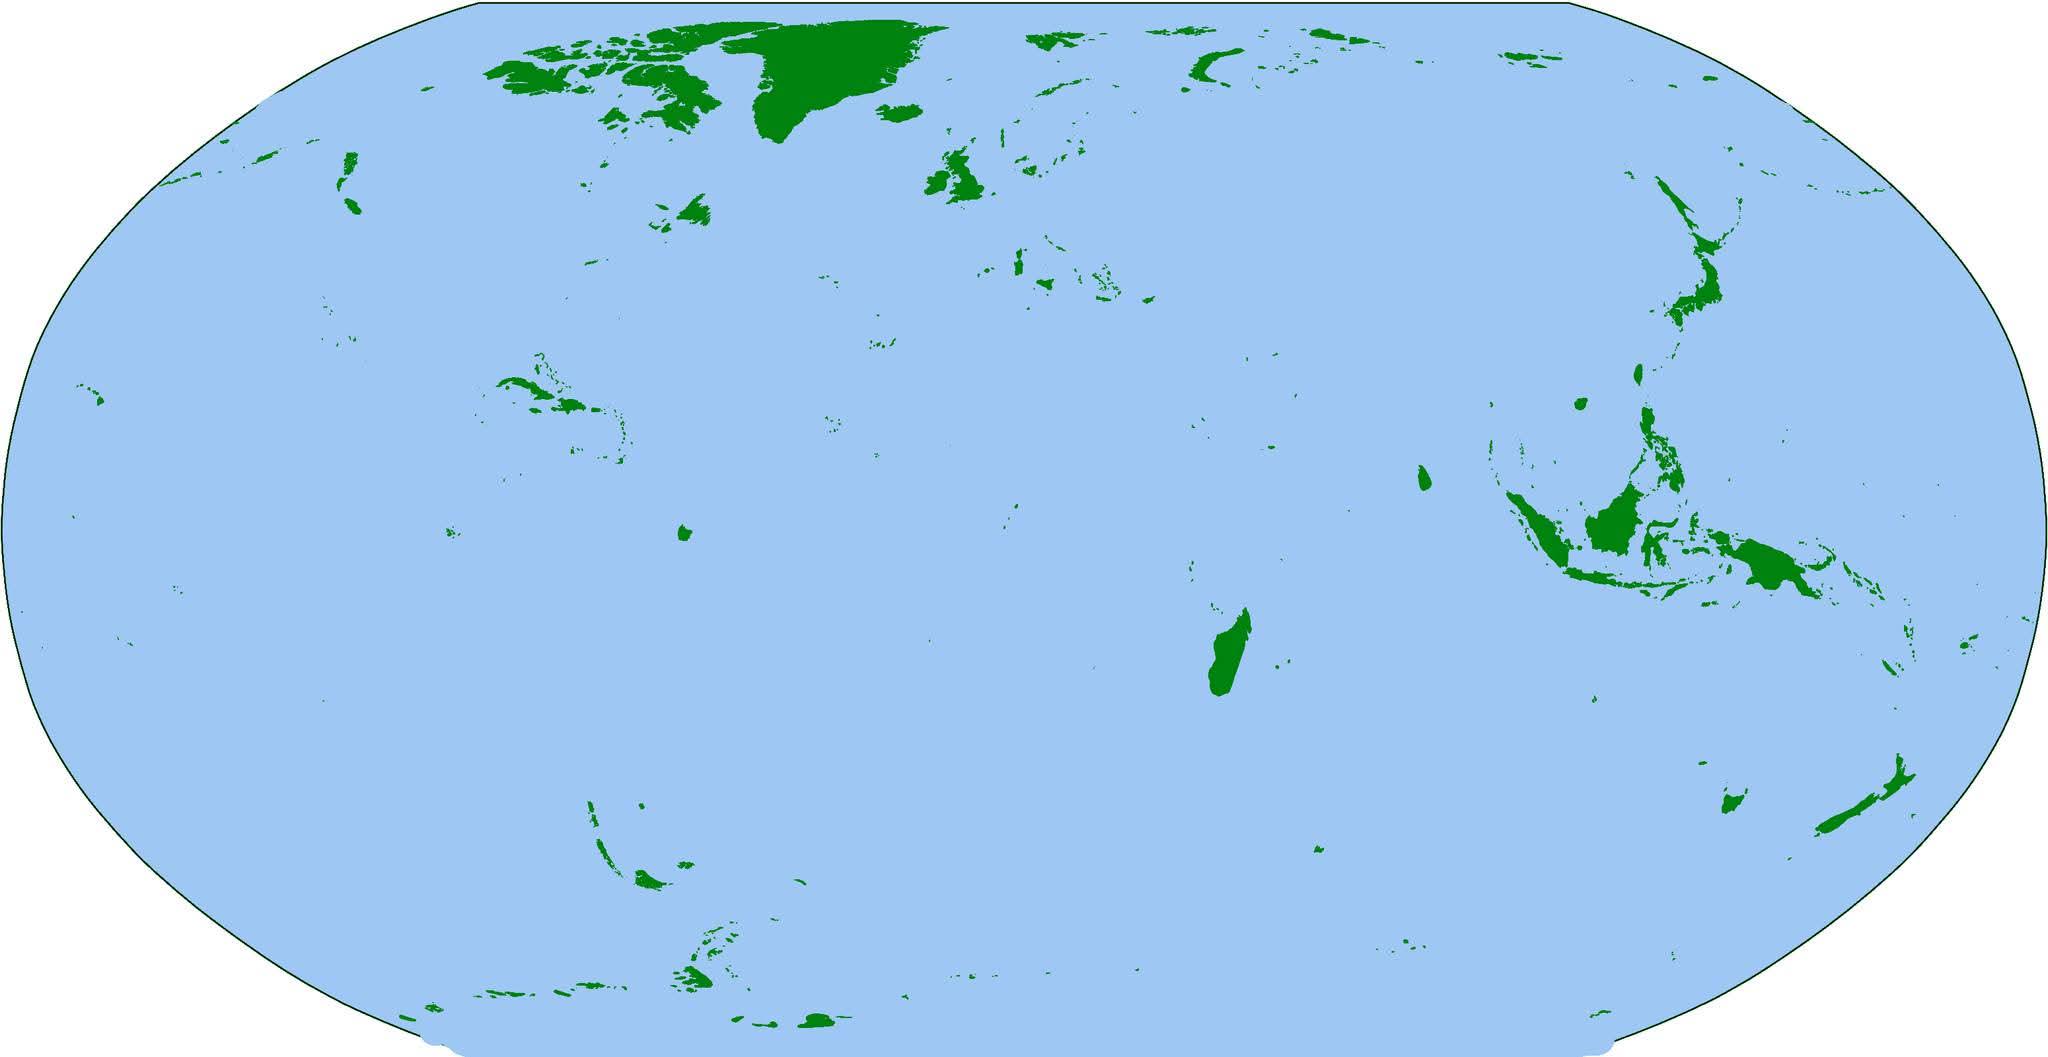
Map of the World's Islands
The visualization titled "The Earth... But Just Islands" presents a unique perspective on our planet by isolating and hi...
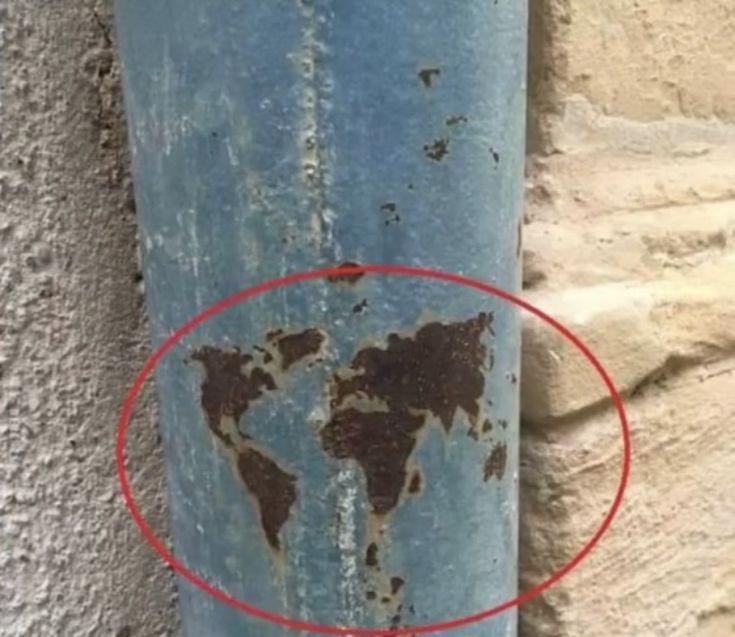
Pole Map of Earth's Geographic Poles
This map provides a detailed visualization of Earth's geographic poles, specifically highlighting the North and South Po...
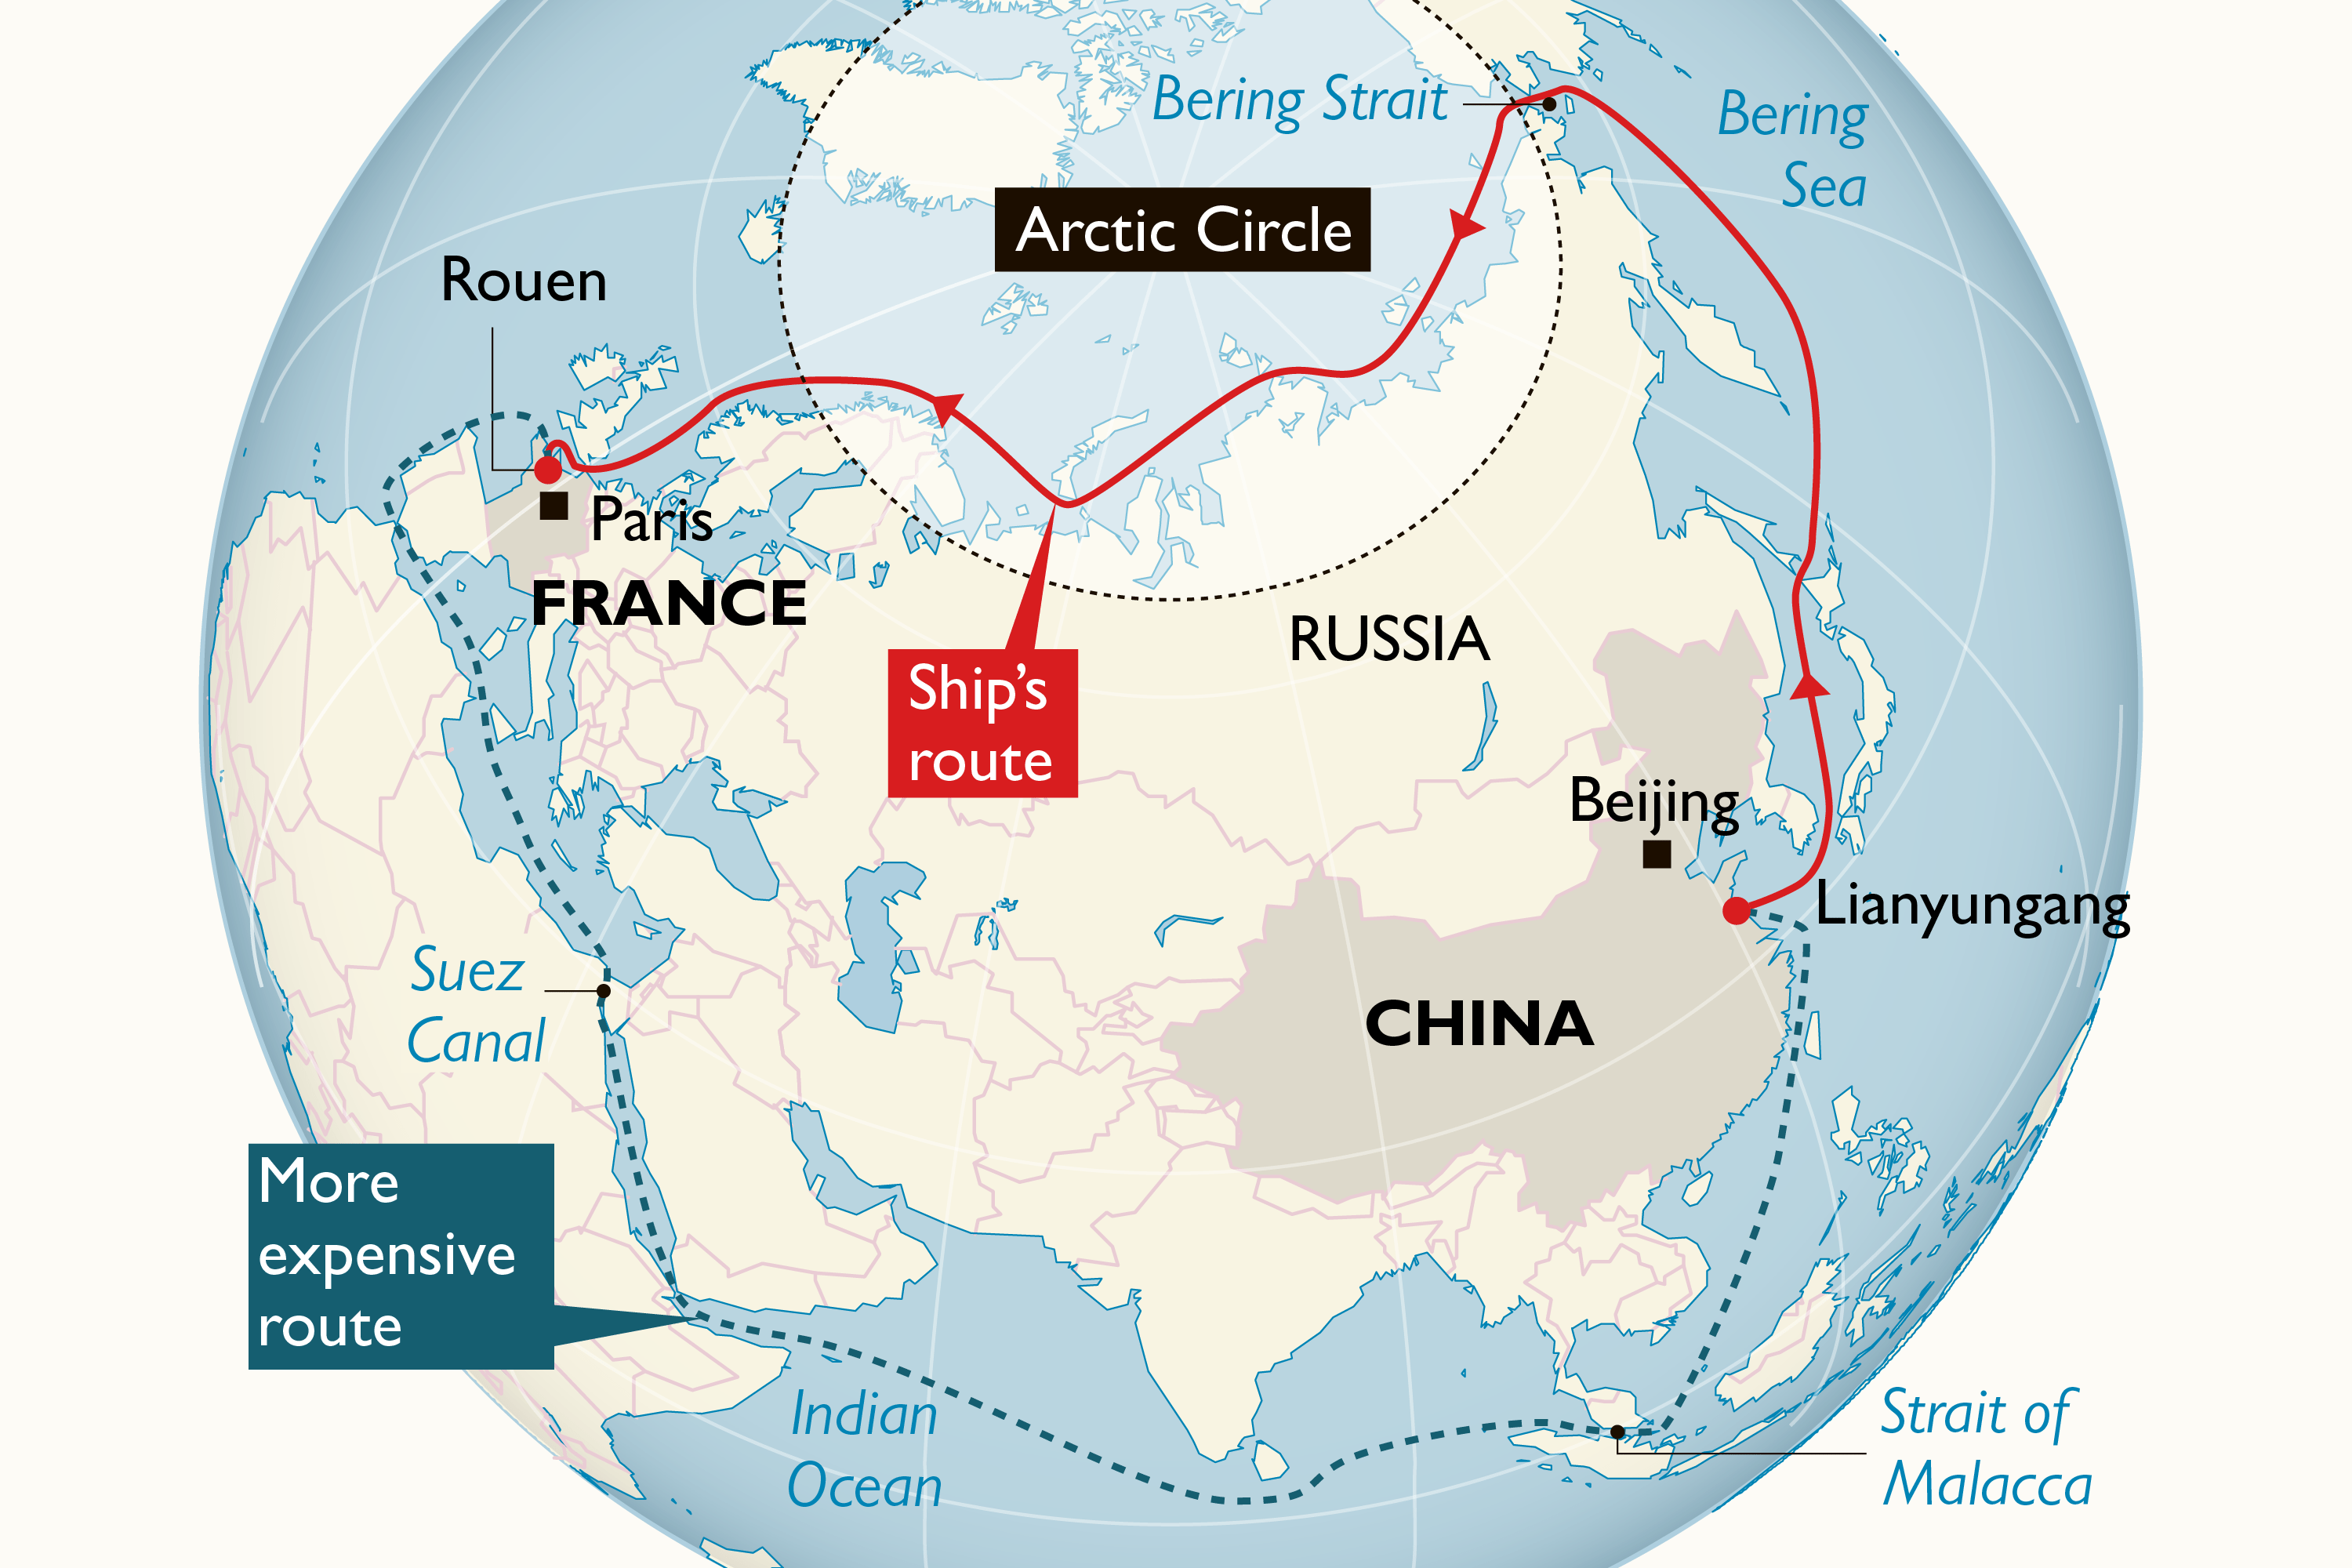
New Arctic Shipping Route Map from China to Europe
This transition to a more accessible Arctic route is not merely a logistical achievement; it reflects broader geopolitic...
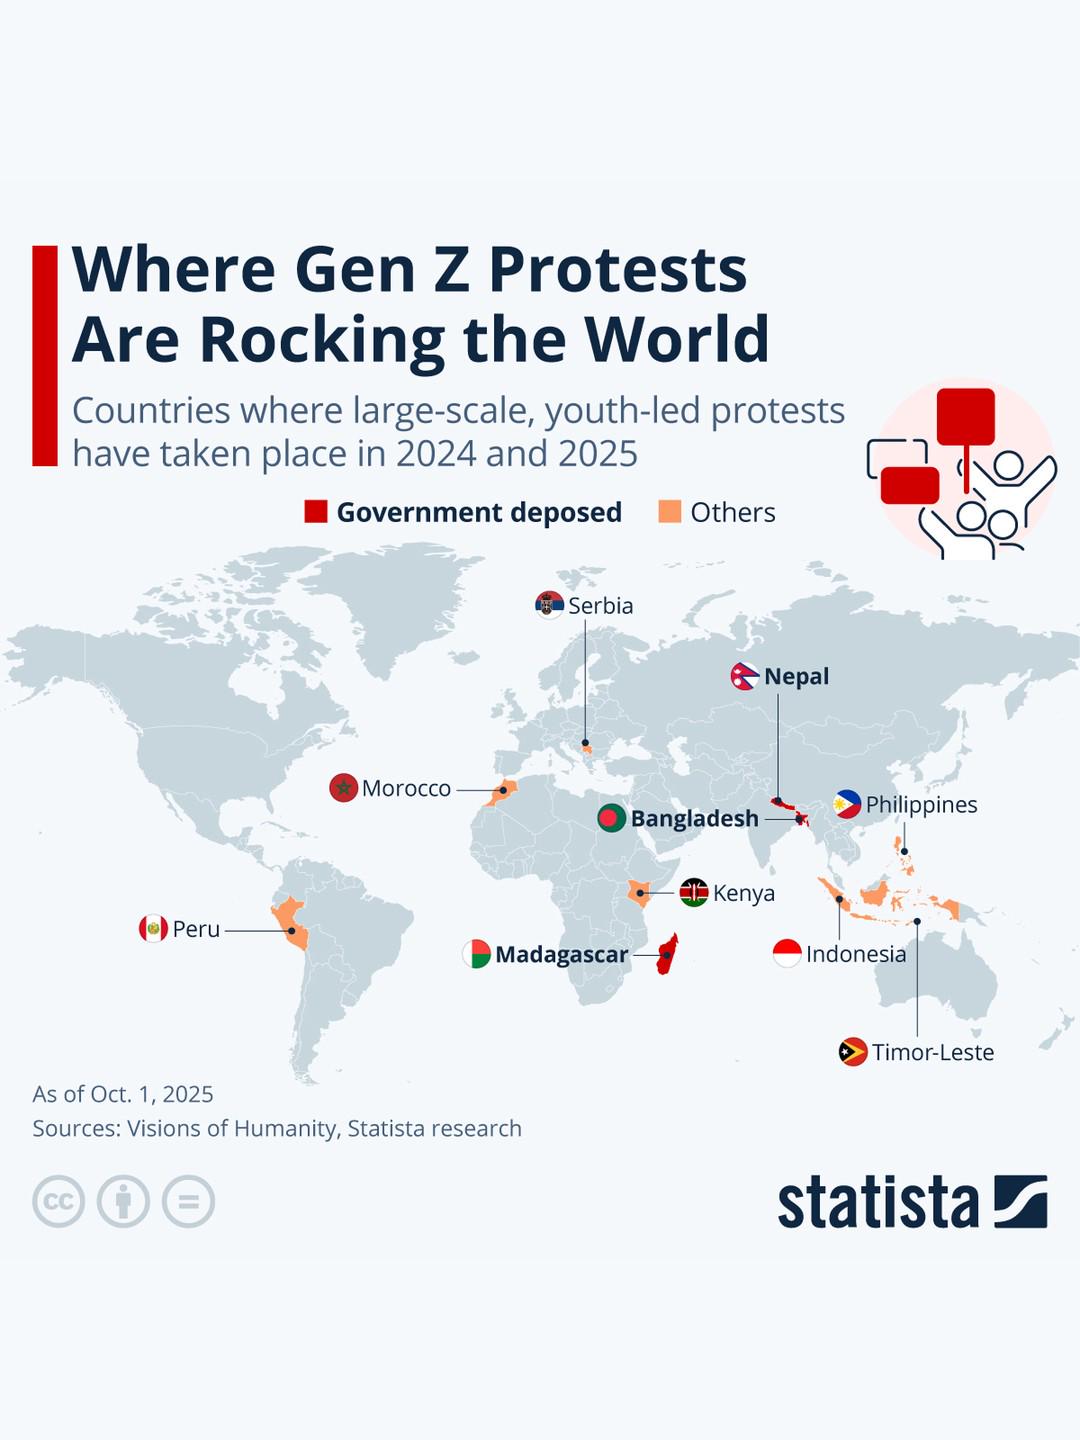
Gen-Z Protests Map 2024-2025
The \...
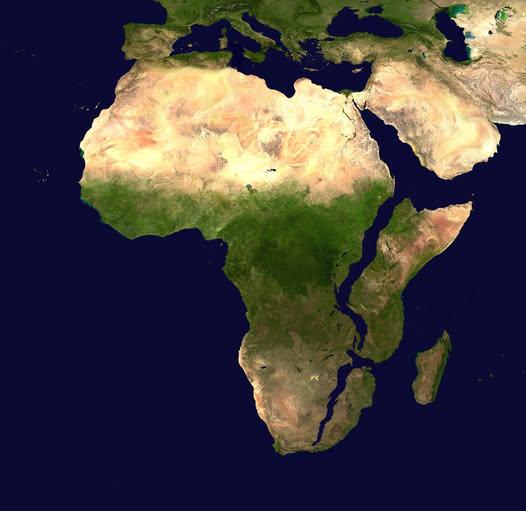
Map of Africa in 10 Million Years
This intriguing map titled "What Africa Might Look Like In 10 Million Years" presents a speculative visualization of the...
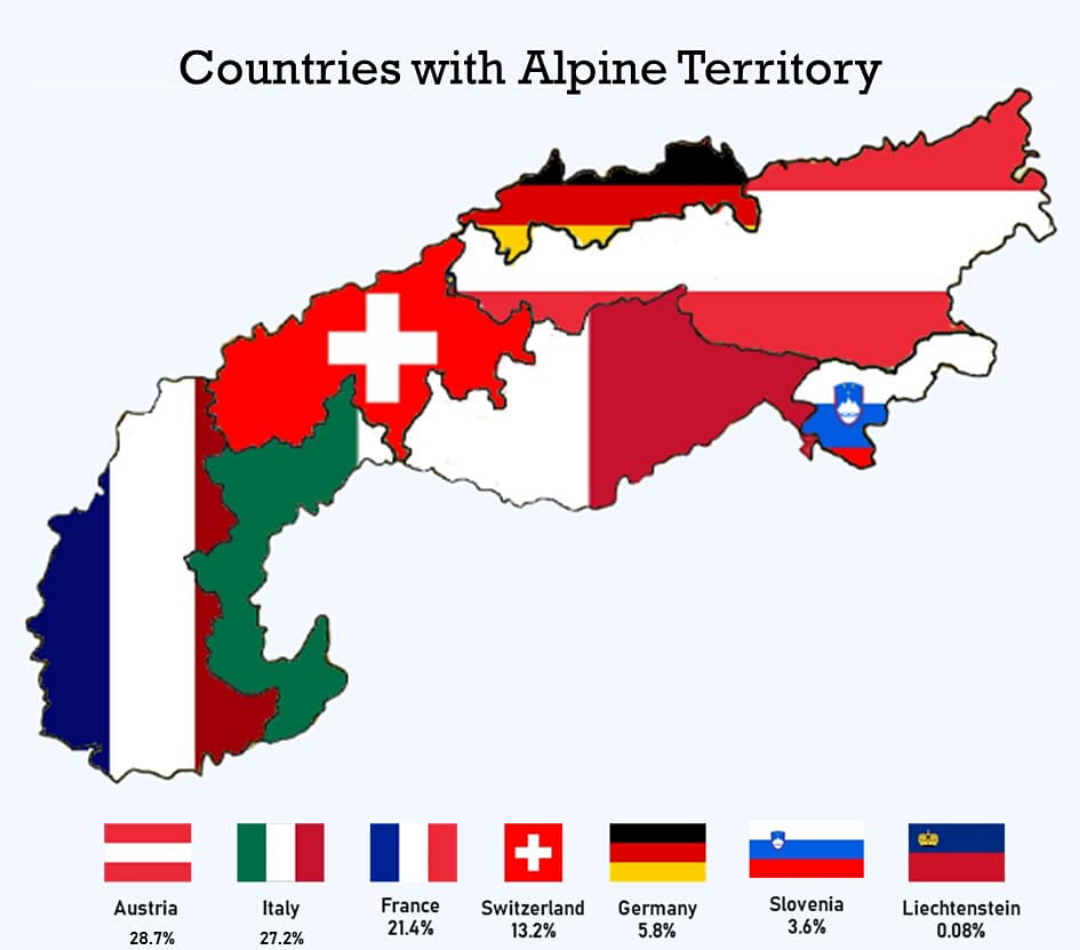
Countries with Alpine Territory Map
This map provides a visual representation of the countries that possess alpine territories, highlighting regions charact...
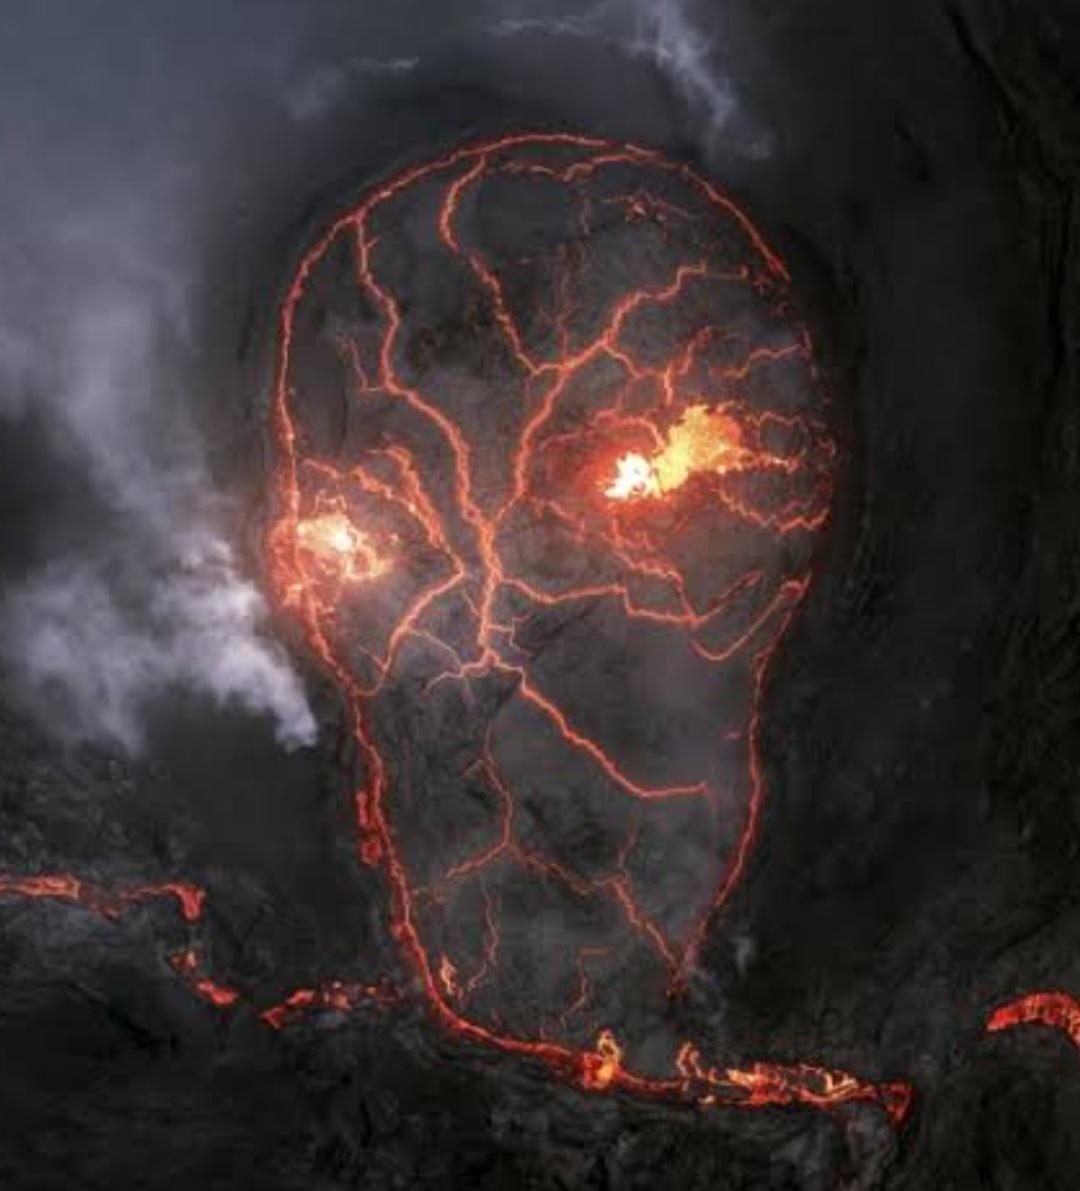
Erupting Volcano Map of Iceland
This visualization presents a detailed aerial view of an erupting volcano in Iceland, capturing the dynamic and ever-cha...
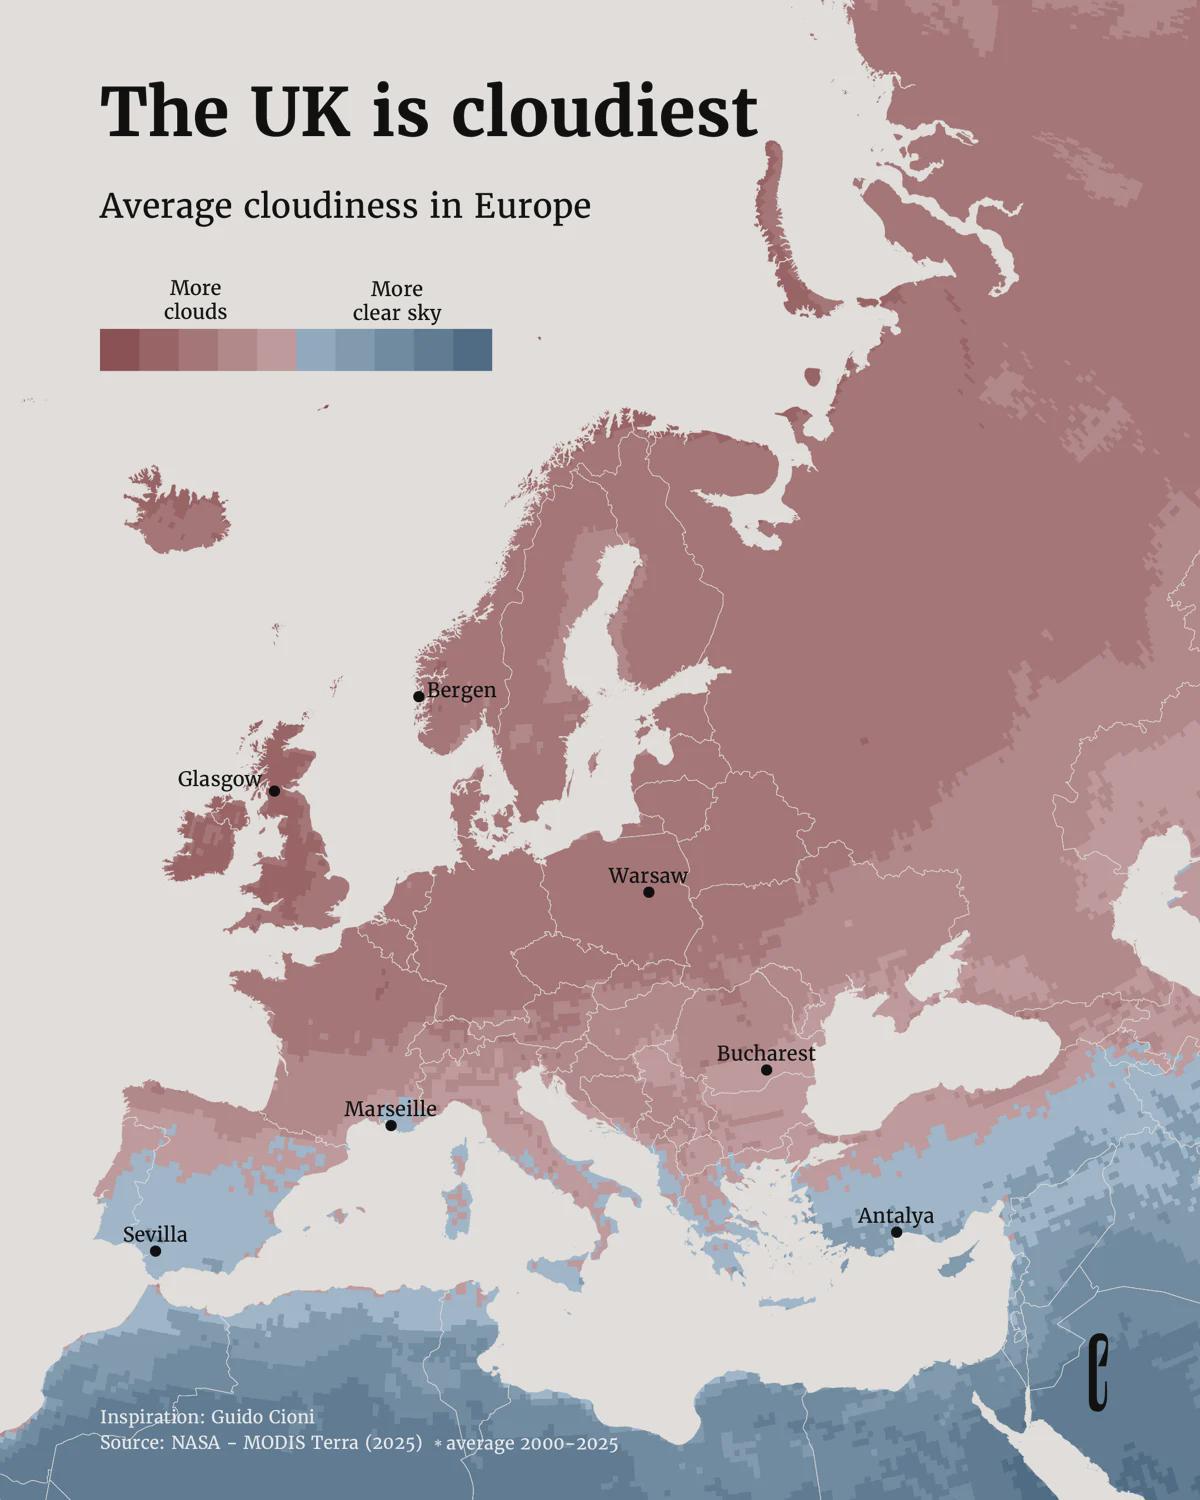
Average Cloudiness in Europe Map
...
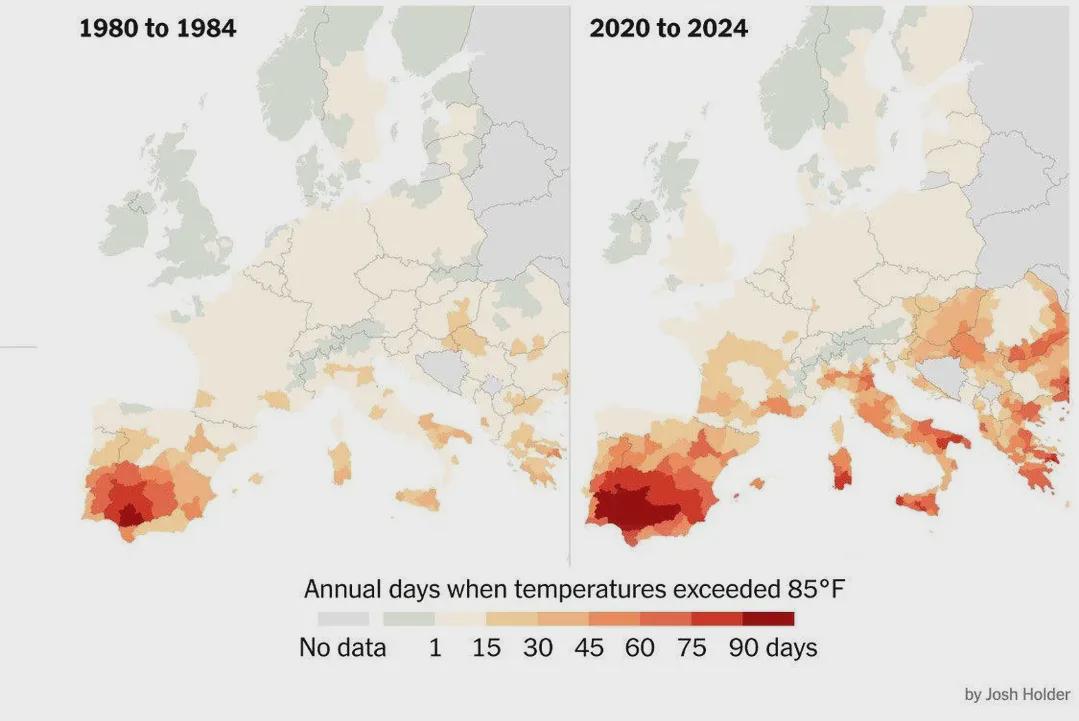
Days Over 30ºC in Europe Map
The visualization titled "Number of Days per Year When Temperatures Exceeded 30ºC (85°F) in Europe" provides a comprehen...
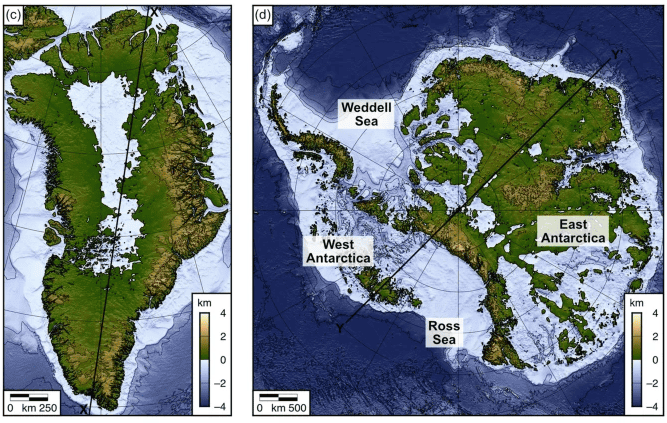
Map of Greenland and Antarctica Without Ice Sheets
The visualization titled "Greenland and Antarctica Without Their Ice Sheets" presents a striking depiction of what these...
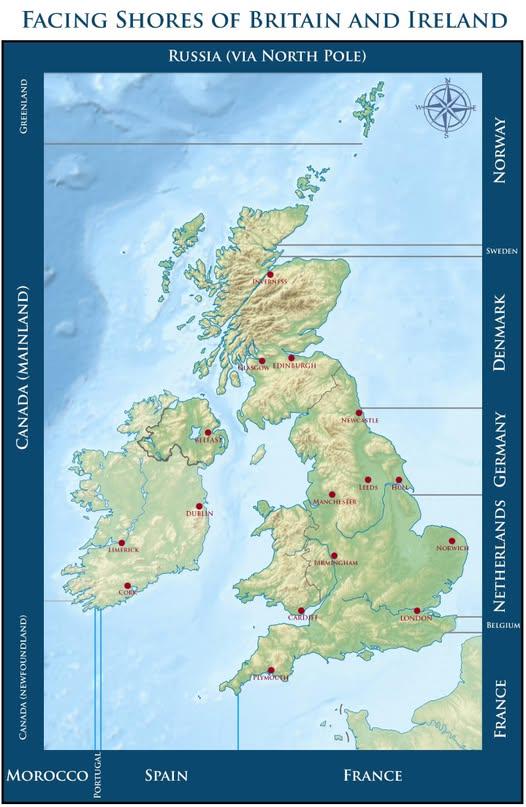
Map of Countries Across From Beaches in Britain and Ireland
This map visually represents which countries you would face if you were standing on a beach in Britain or Ireland, gazin...
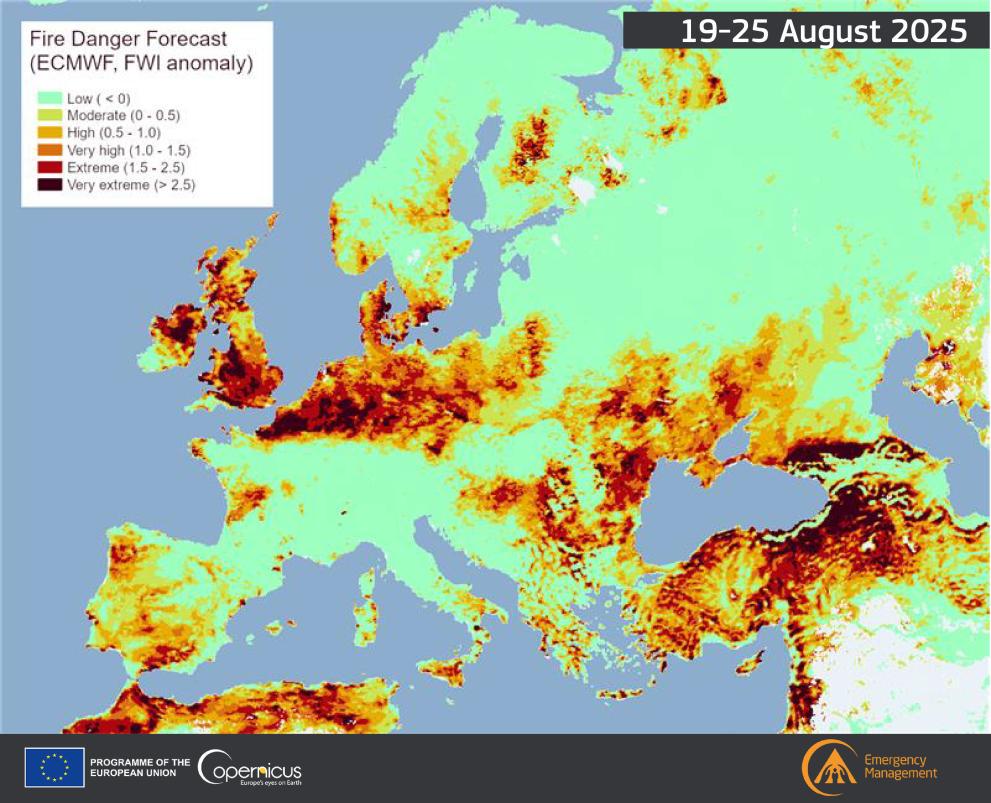
Fire Danger Map of Current Europe
The "Fire Danger Map of Current Europe" provides a crucial snapshot of fire risk levels across various regions in Europe...
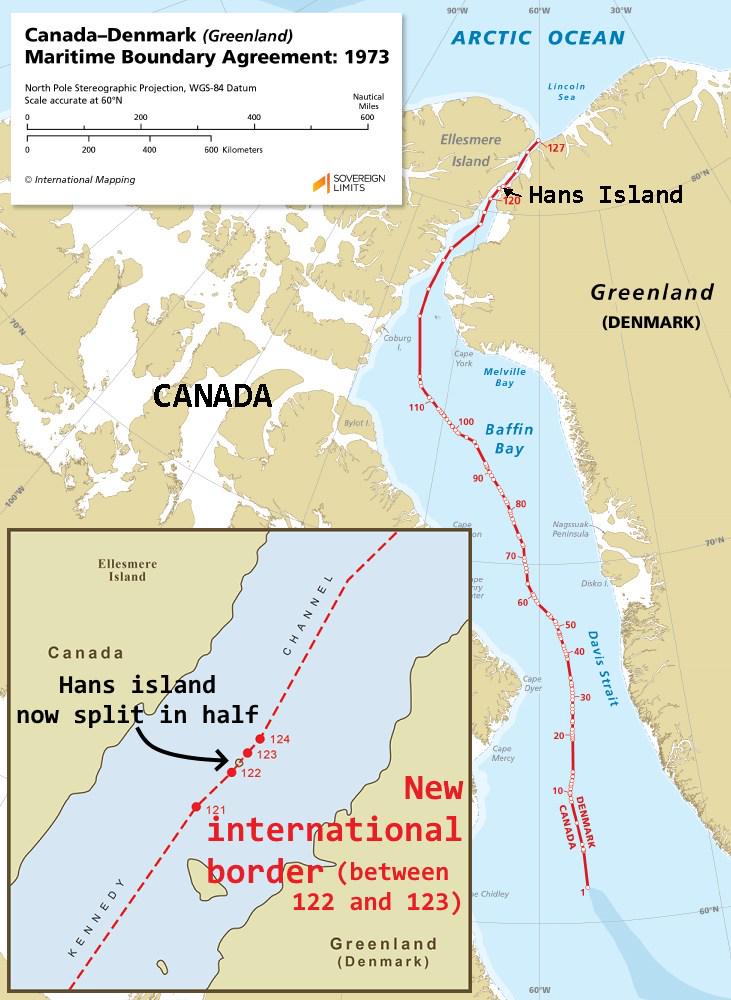
Hans Island Border Map Between Canada and Denmark
This map visually represents the unique land border established between Canada and Denmark in 2022, specifically splitti...
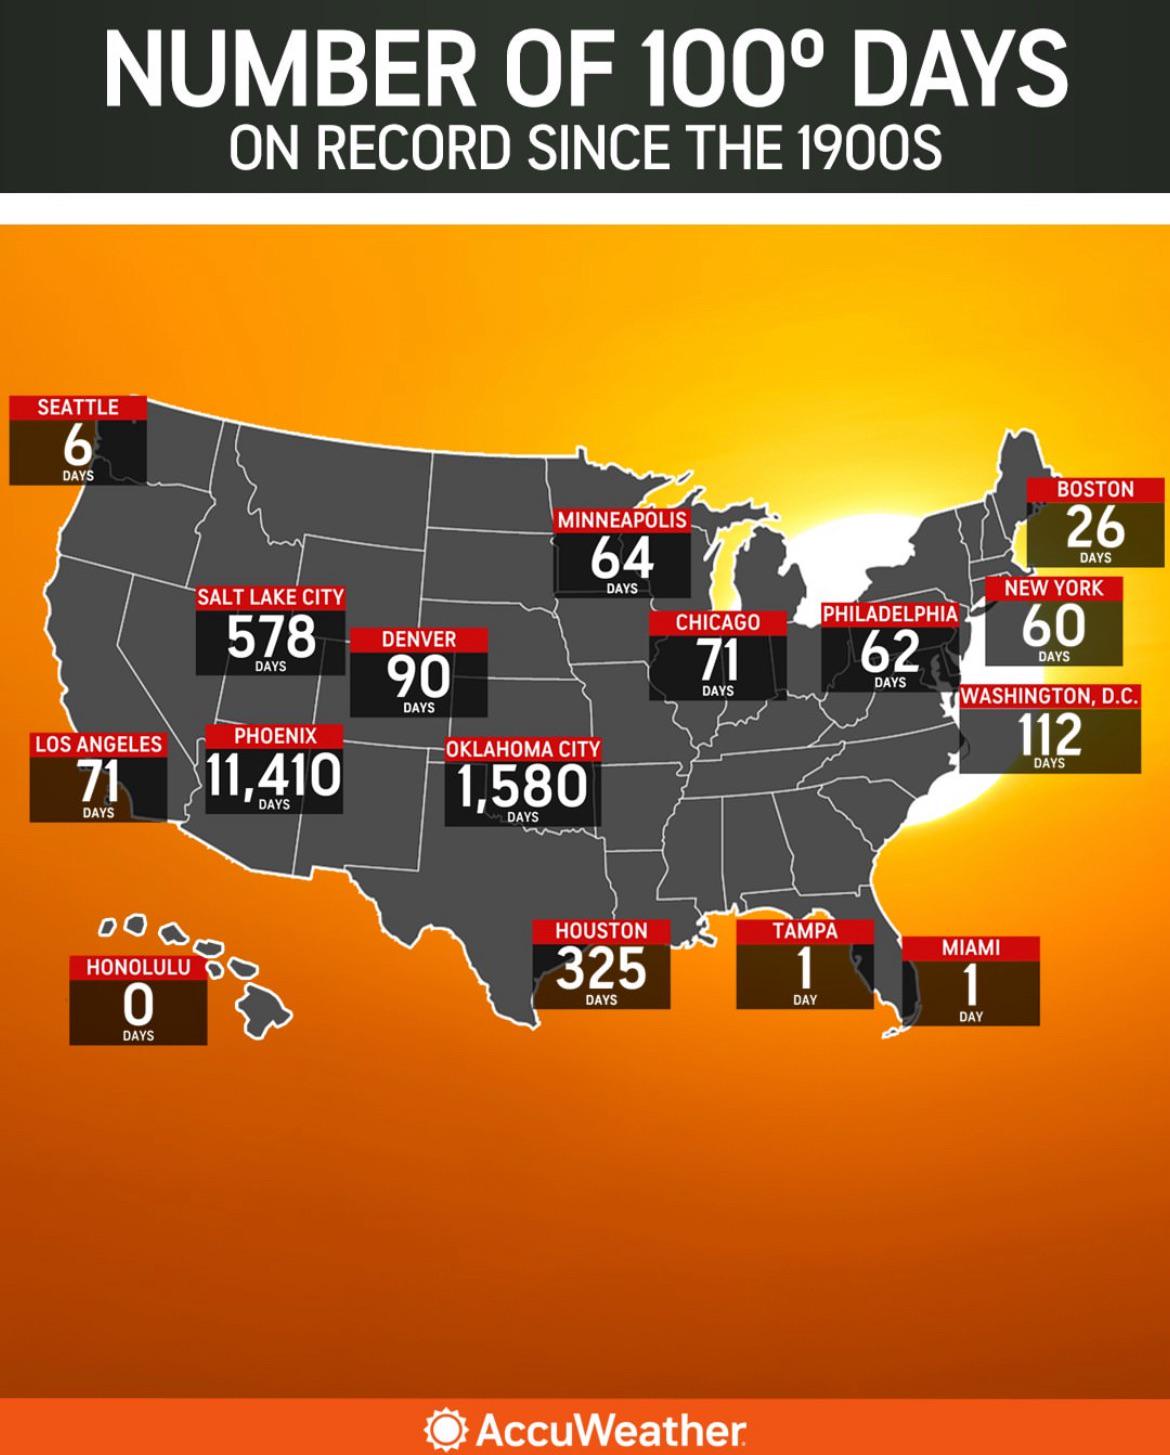
Map of 100° Days Recorded Since 1900
The map titled 'Number of 100° Days on Record Since the 1900s' visually represents the frequency of extreme heat days ac...
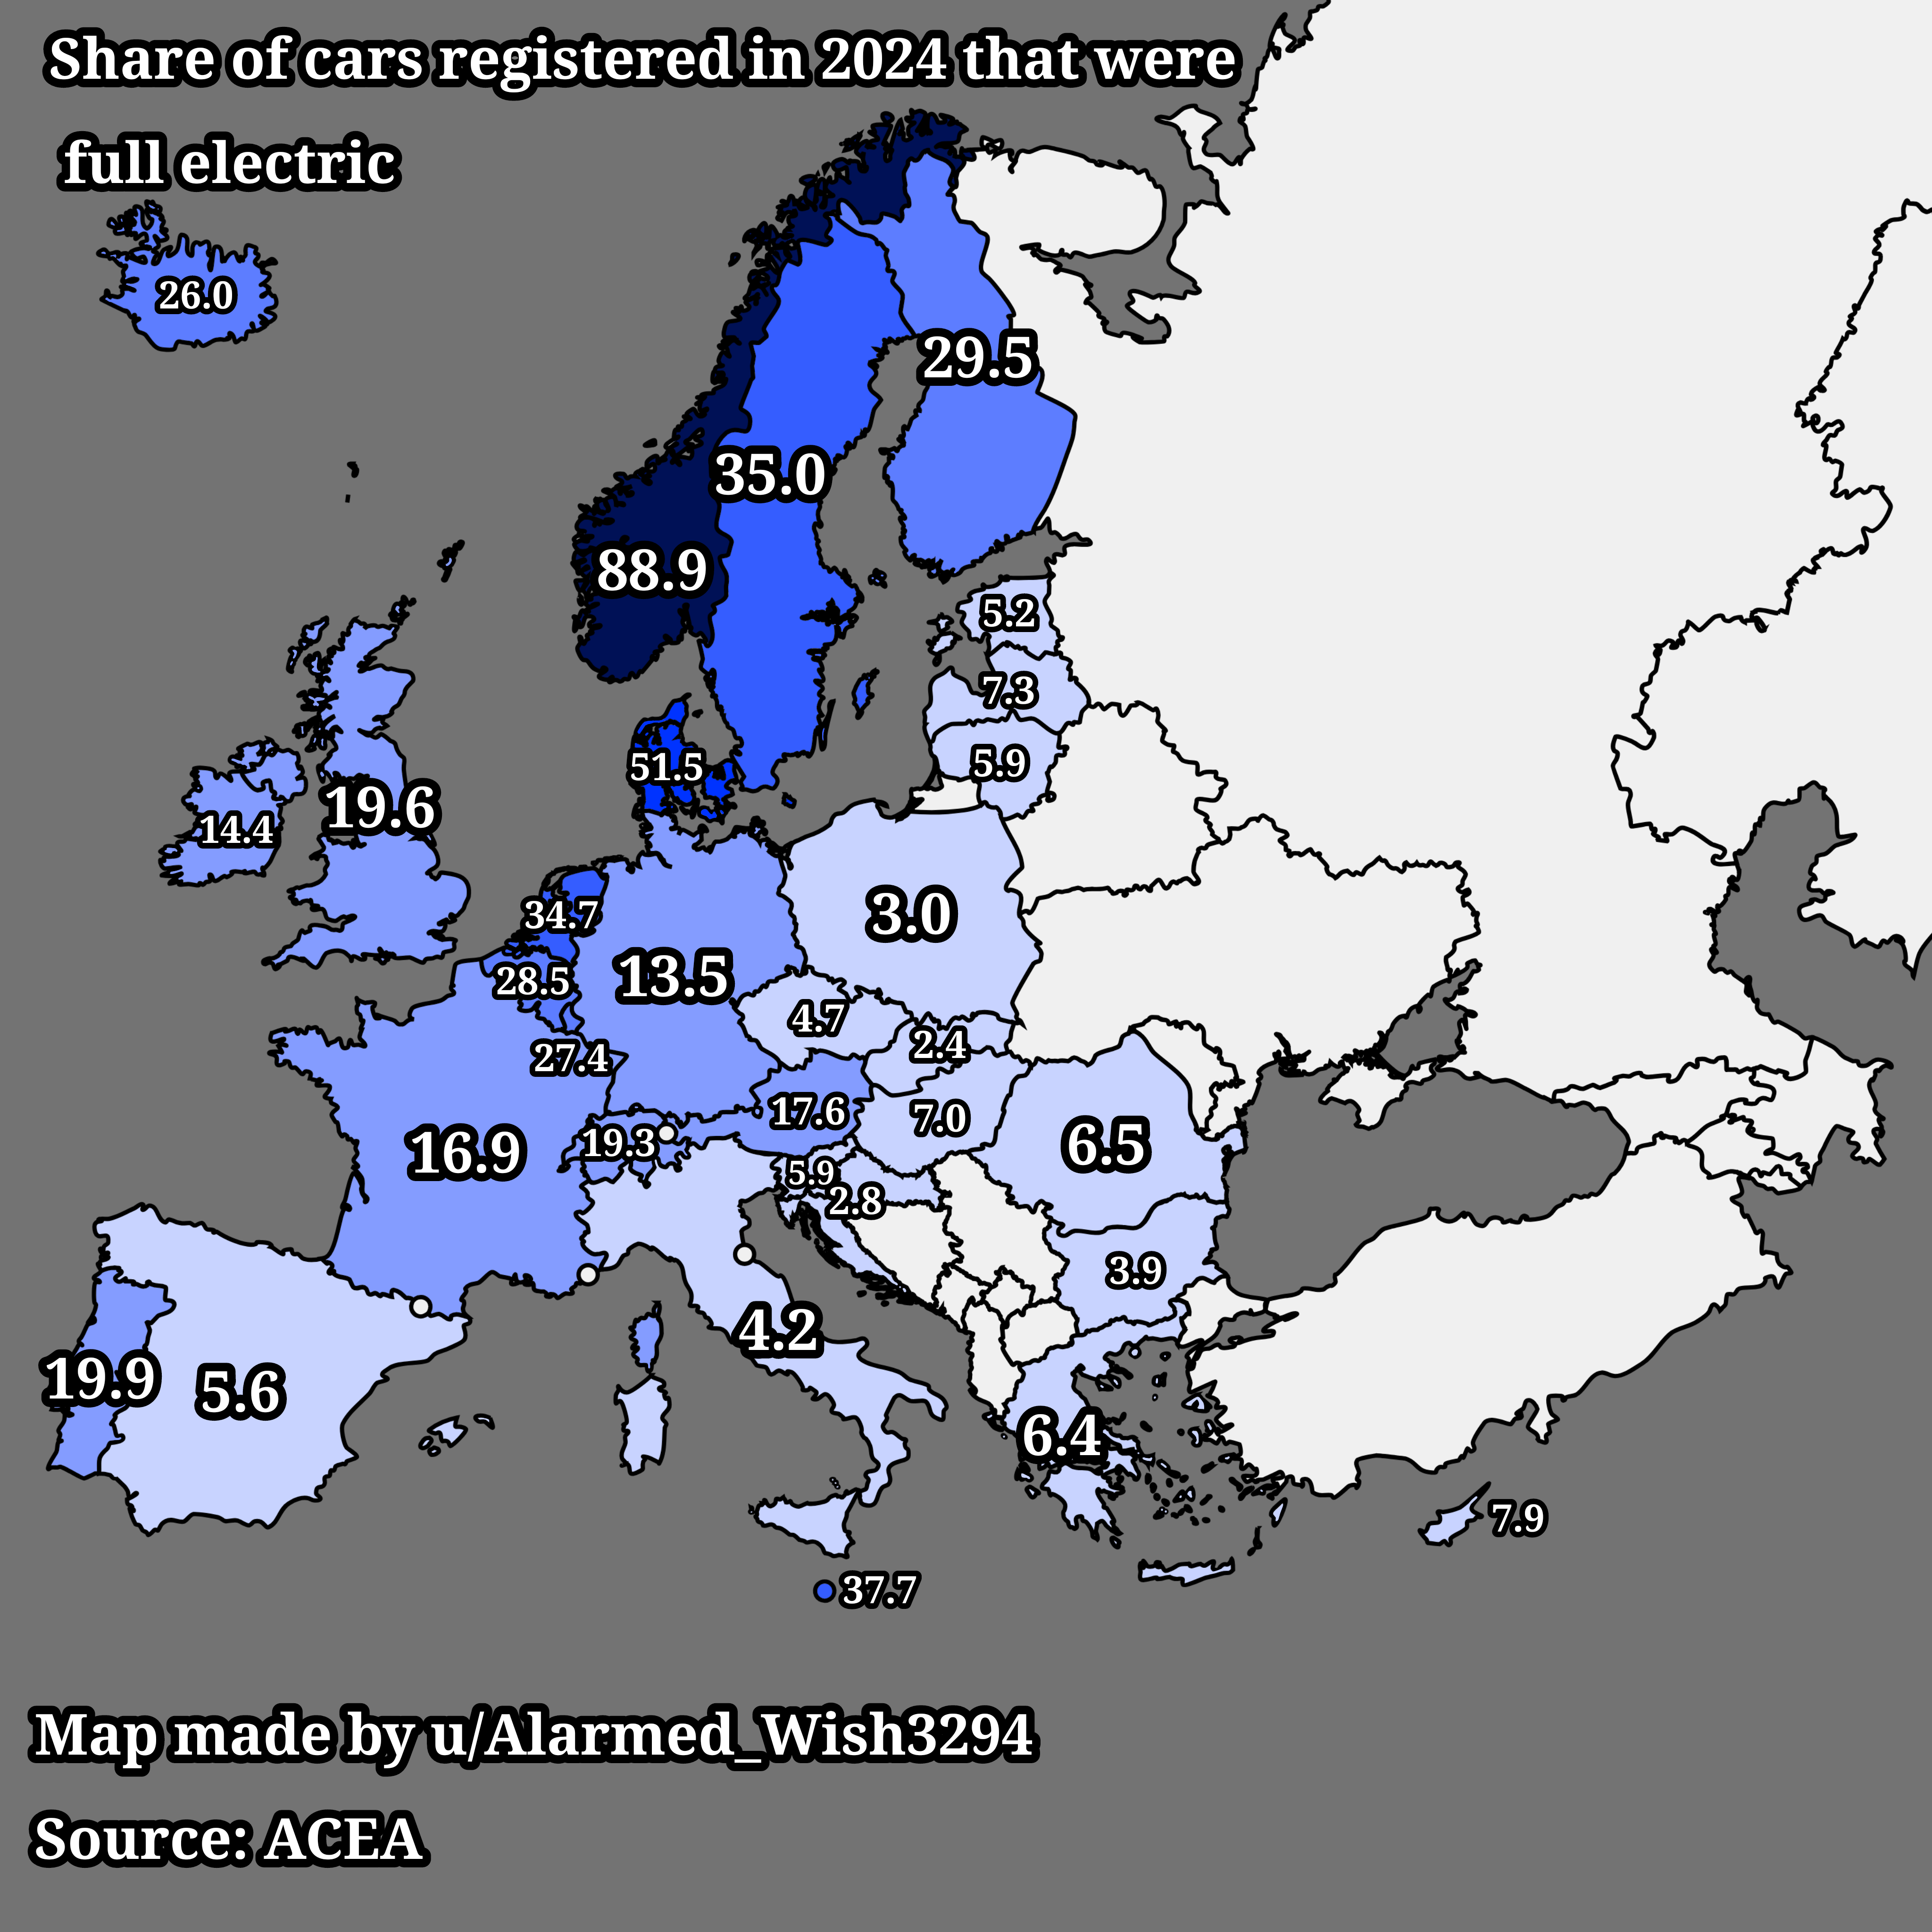
Map of Full Electric Car Registrations in Europe 2024
This map visualizes the share of cars registered in Europe in 2024 that are fully electric. It highlights the growing tr...
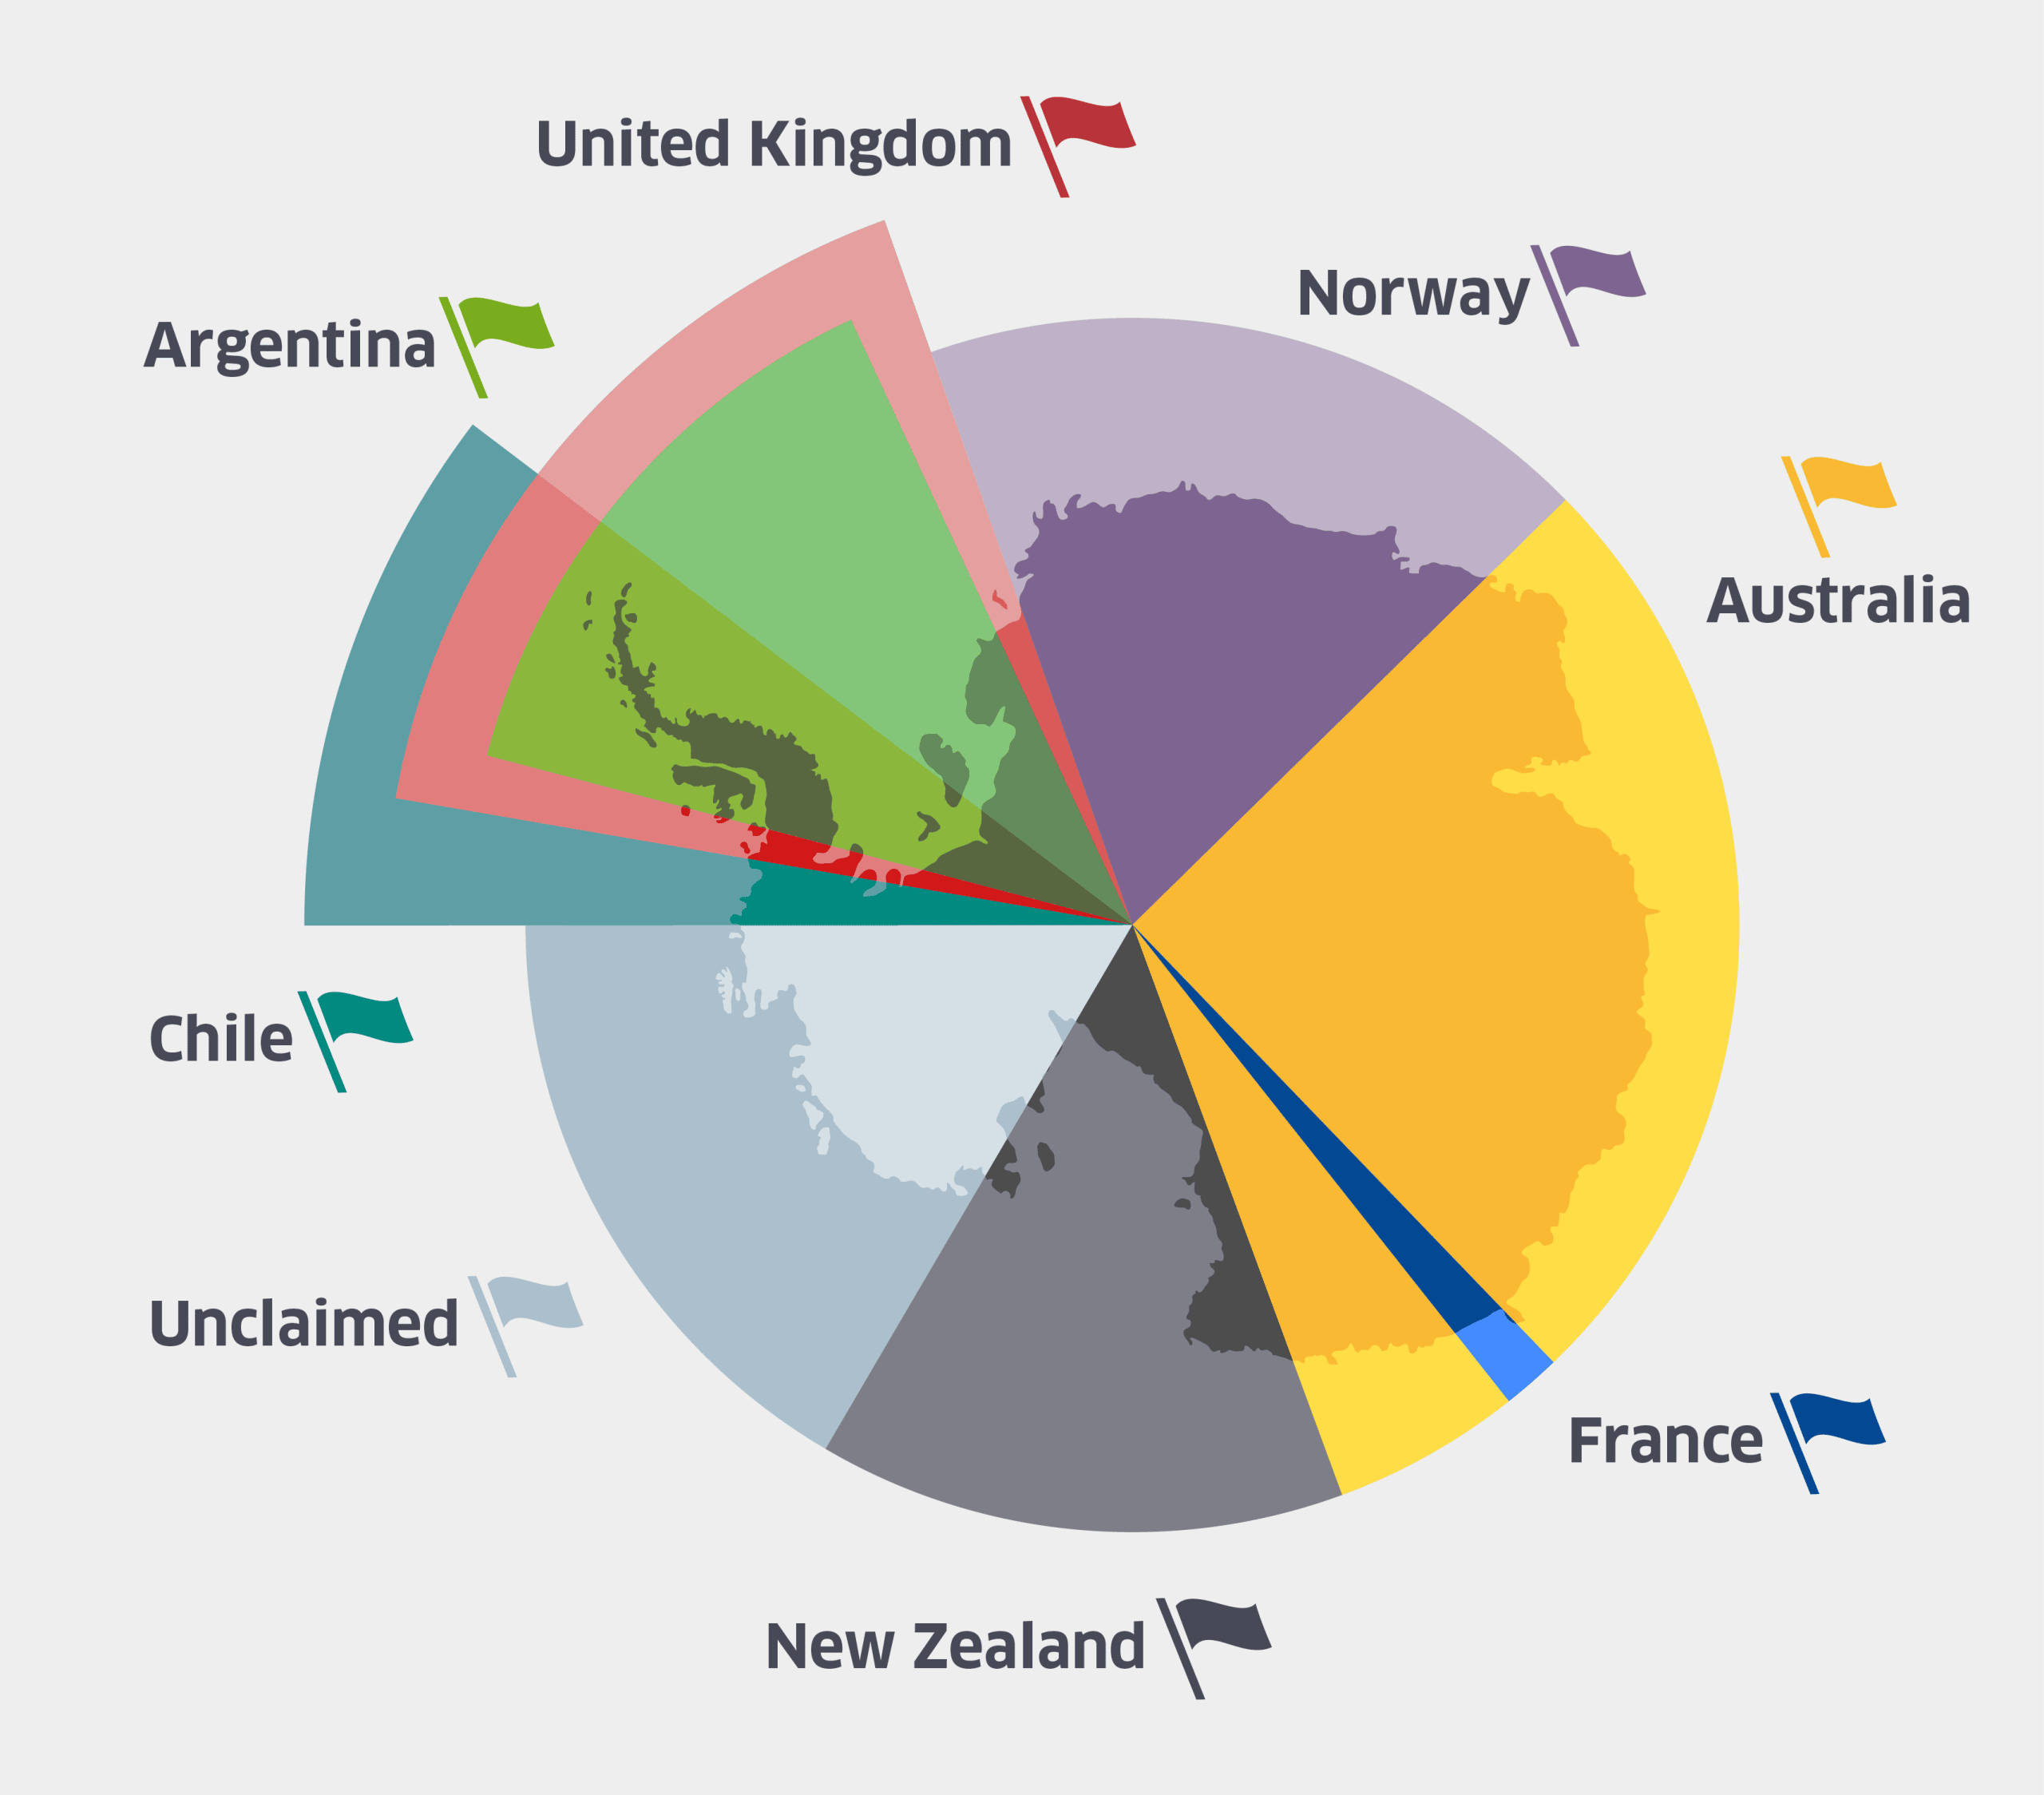
Antarctica Territorial Claims Map
The "Parts of Antarctica Claimed by Countries" map illustrates the various territorial claims made by different nations ...
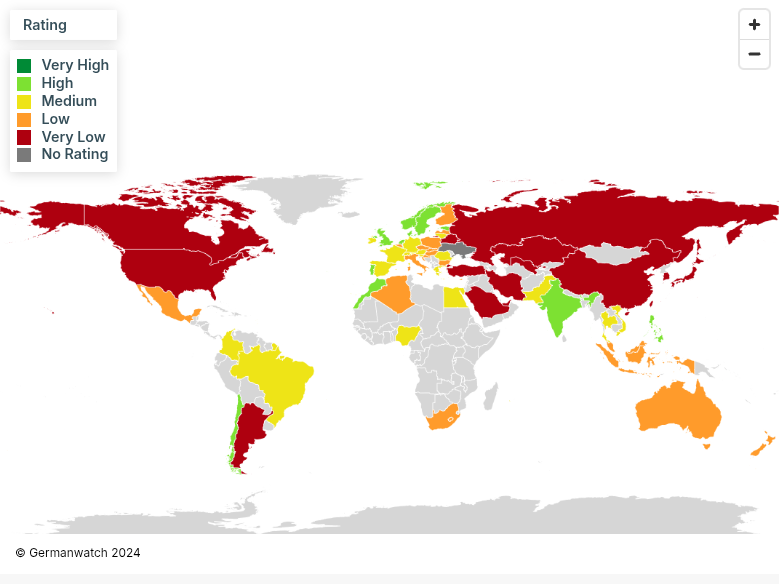
Climate Change Performance Index 2025 Map
The Climate Change Performance Index (CCPI) 2025 Map visualizes the performance of countries in combating climate change...
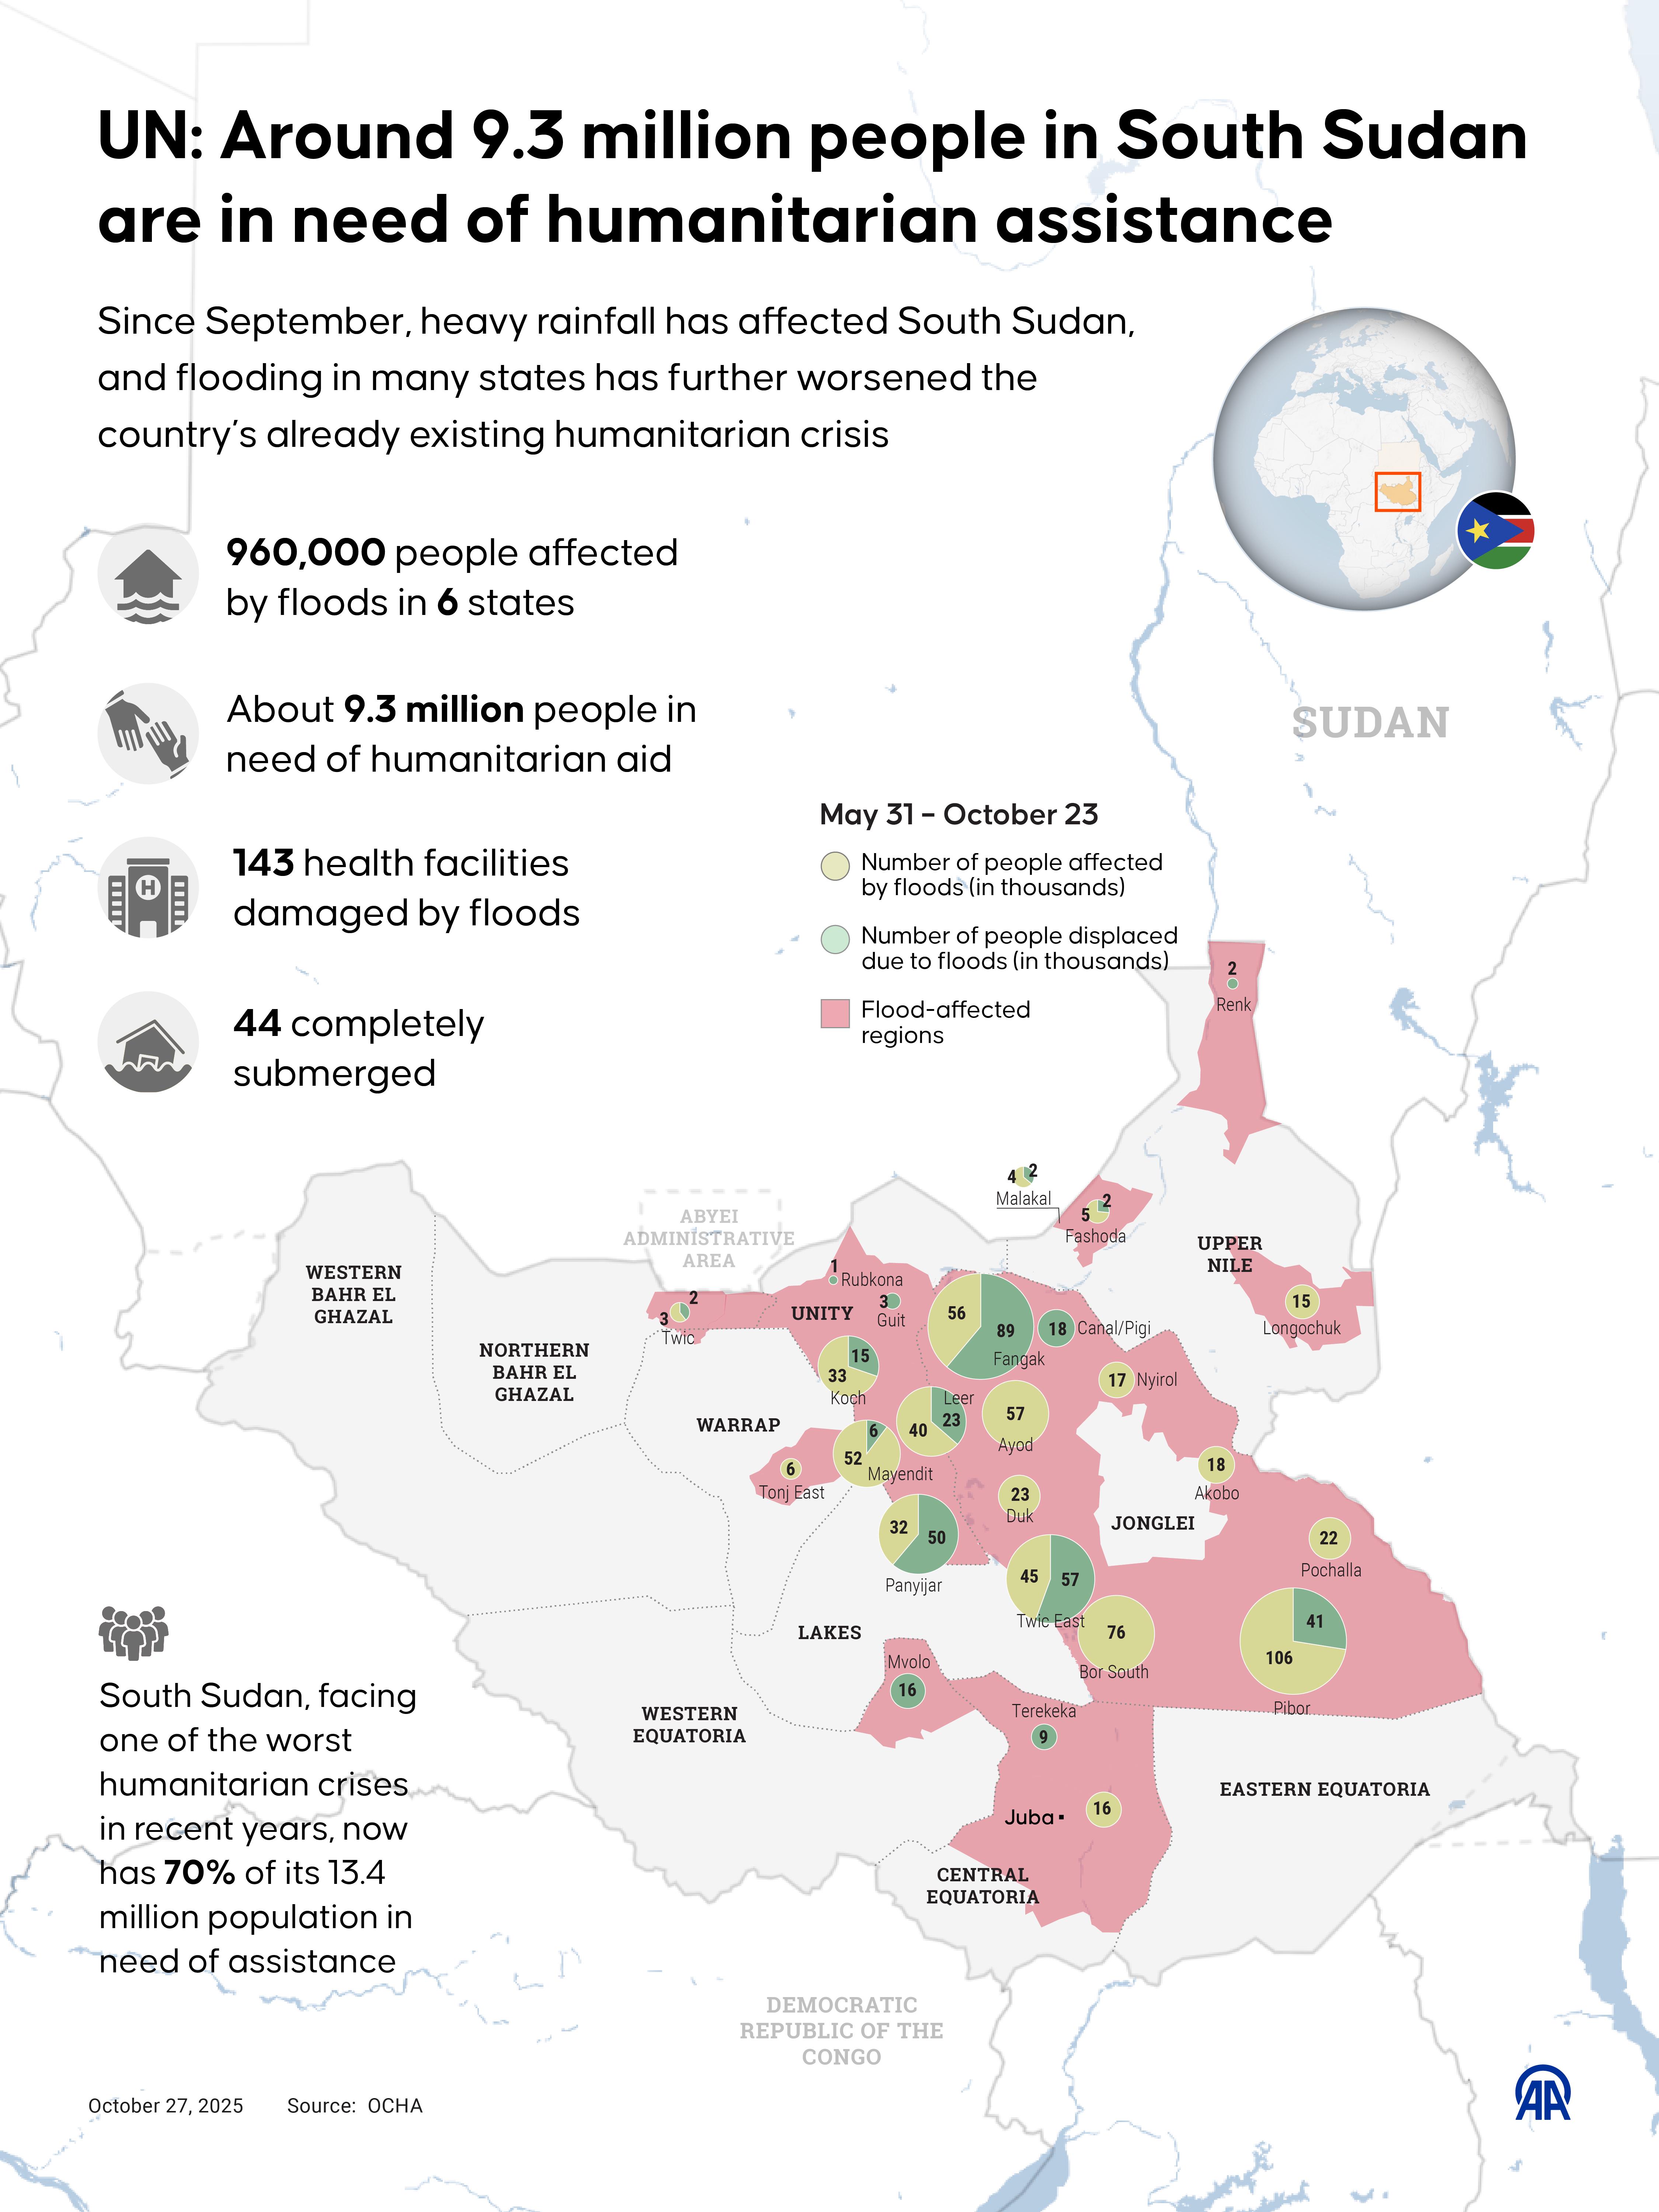
Humanitarian Assistance Needs Map of South Sudan
The map in question highlights the alarming humanitarian crisis facing South Sudan, indicating that approximately 9.3 mi...
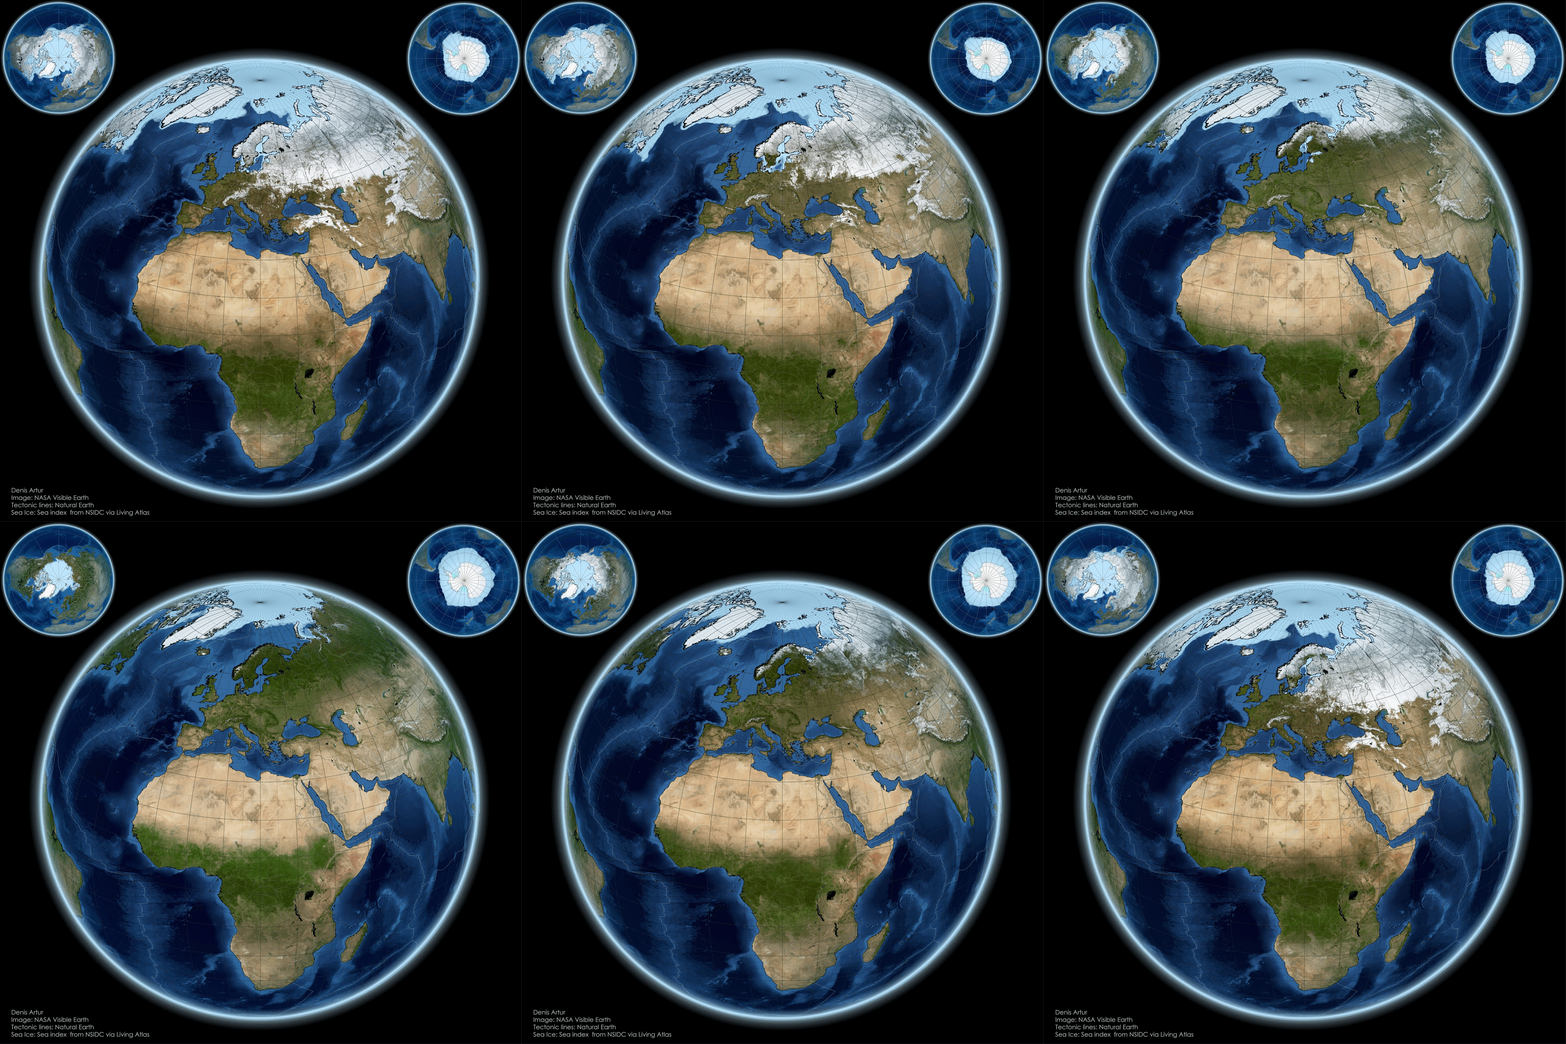
Polar Balance Map of Earth
The "From Pole to Pole: Visualizing Earth’s Polar Balance" map presents a striking visual representation of the Earth's ...
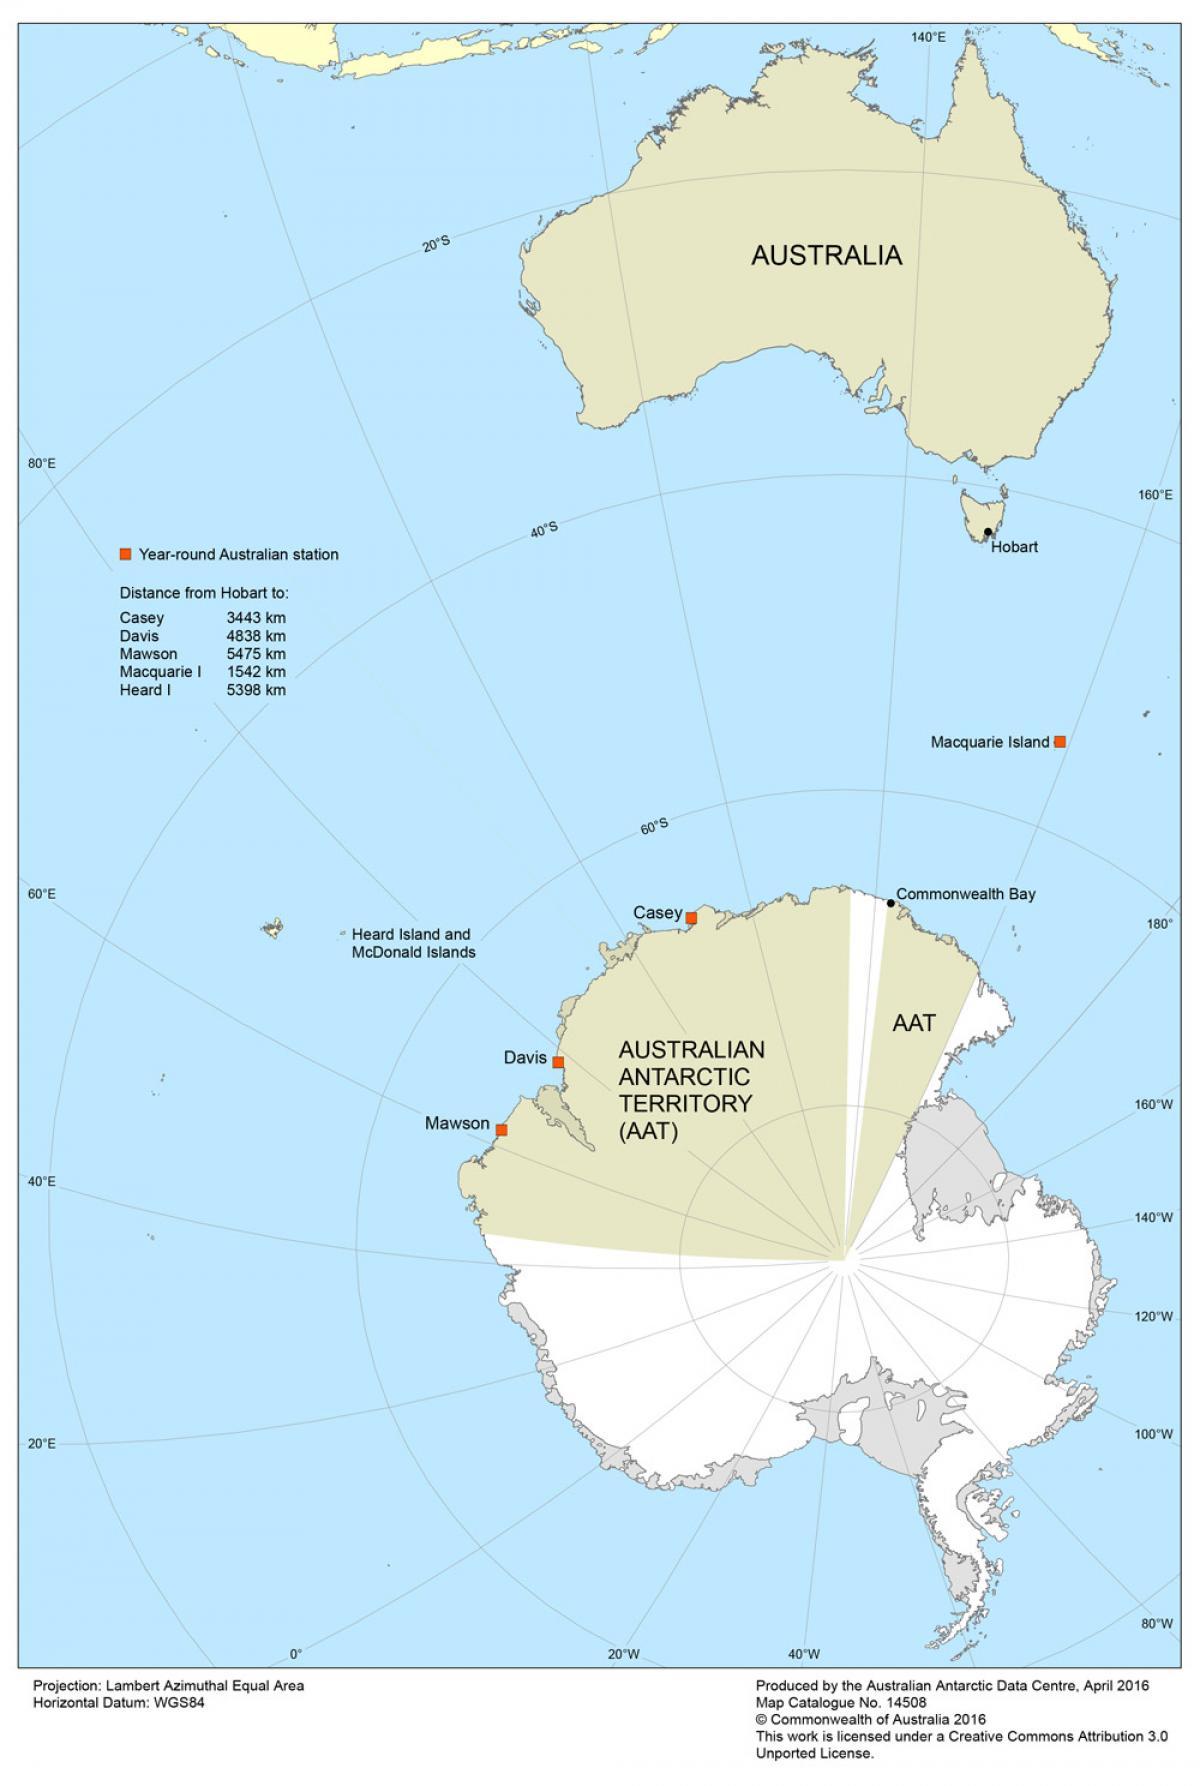
Map of Australia's Climate Zones
The "Map of Australia's Climate Zones" provides a comprehensive overview of the diverse climatic regions across the cont...
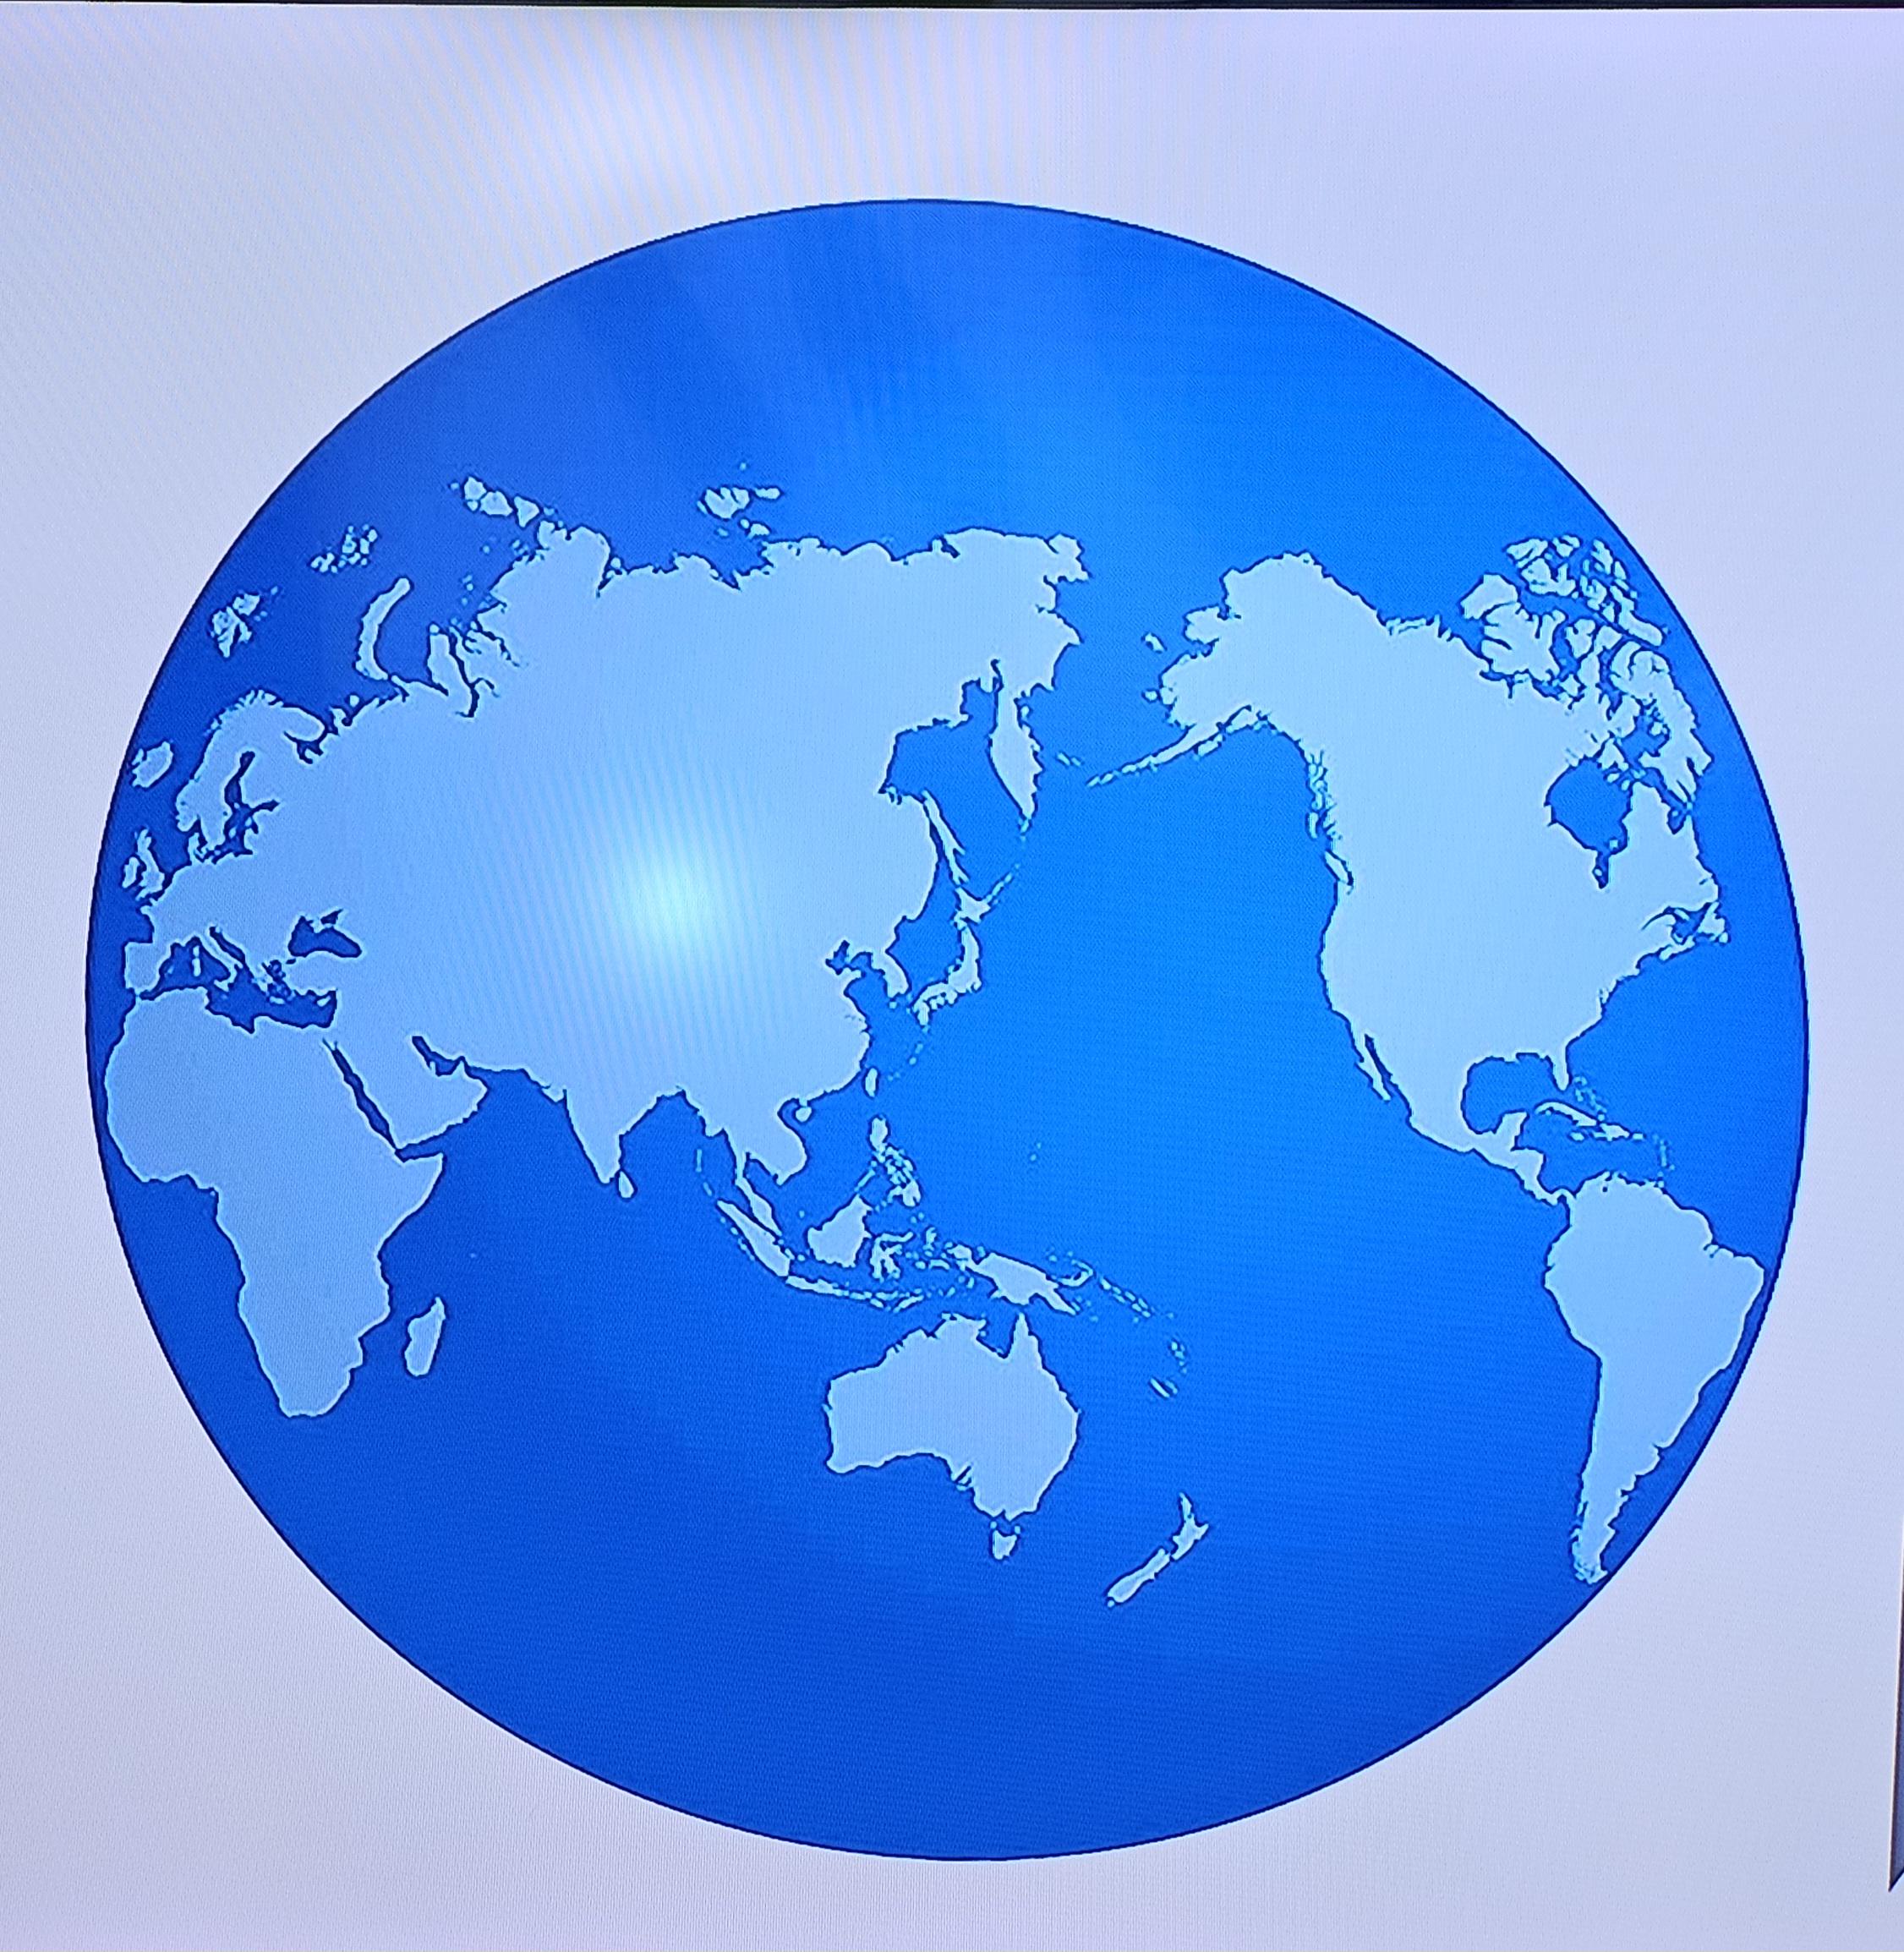
Maps Missing New Zealand, Arctic, Antarctica, Greenland
This visualization titled "New Zealand is there, but..." highlights an intriguing phenomenon in cartography: the absence...
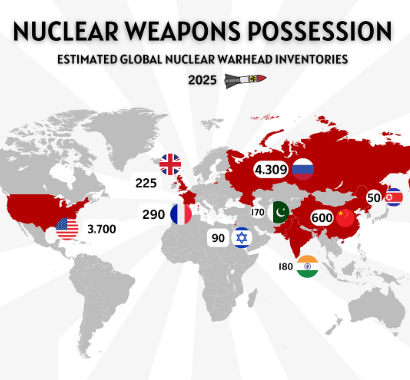
Nuclear Power Countries Map 2025
...
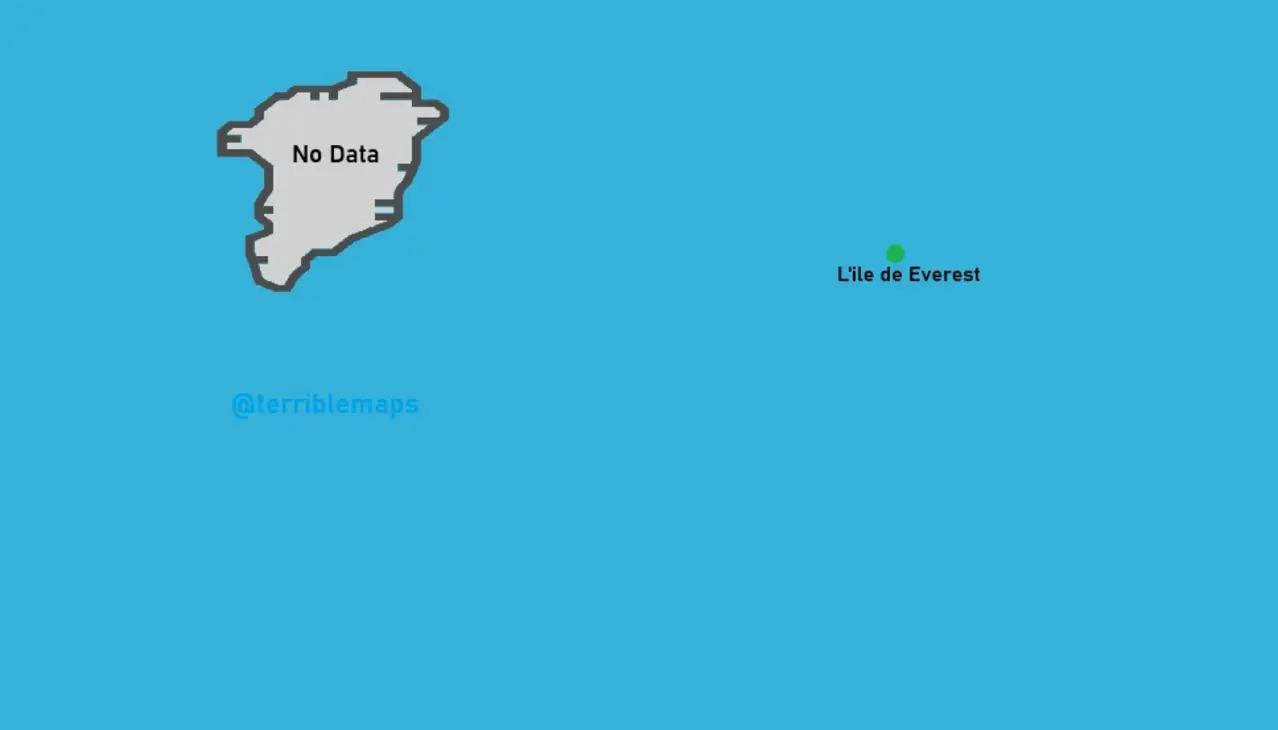
Map of World After 8800m Sea Rise
The visualization titled "The World After an 8,800m Sea Rise" presents a sobering and dramatic reimagining of our planet...
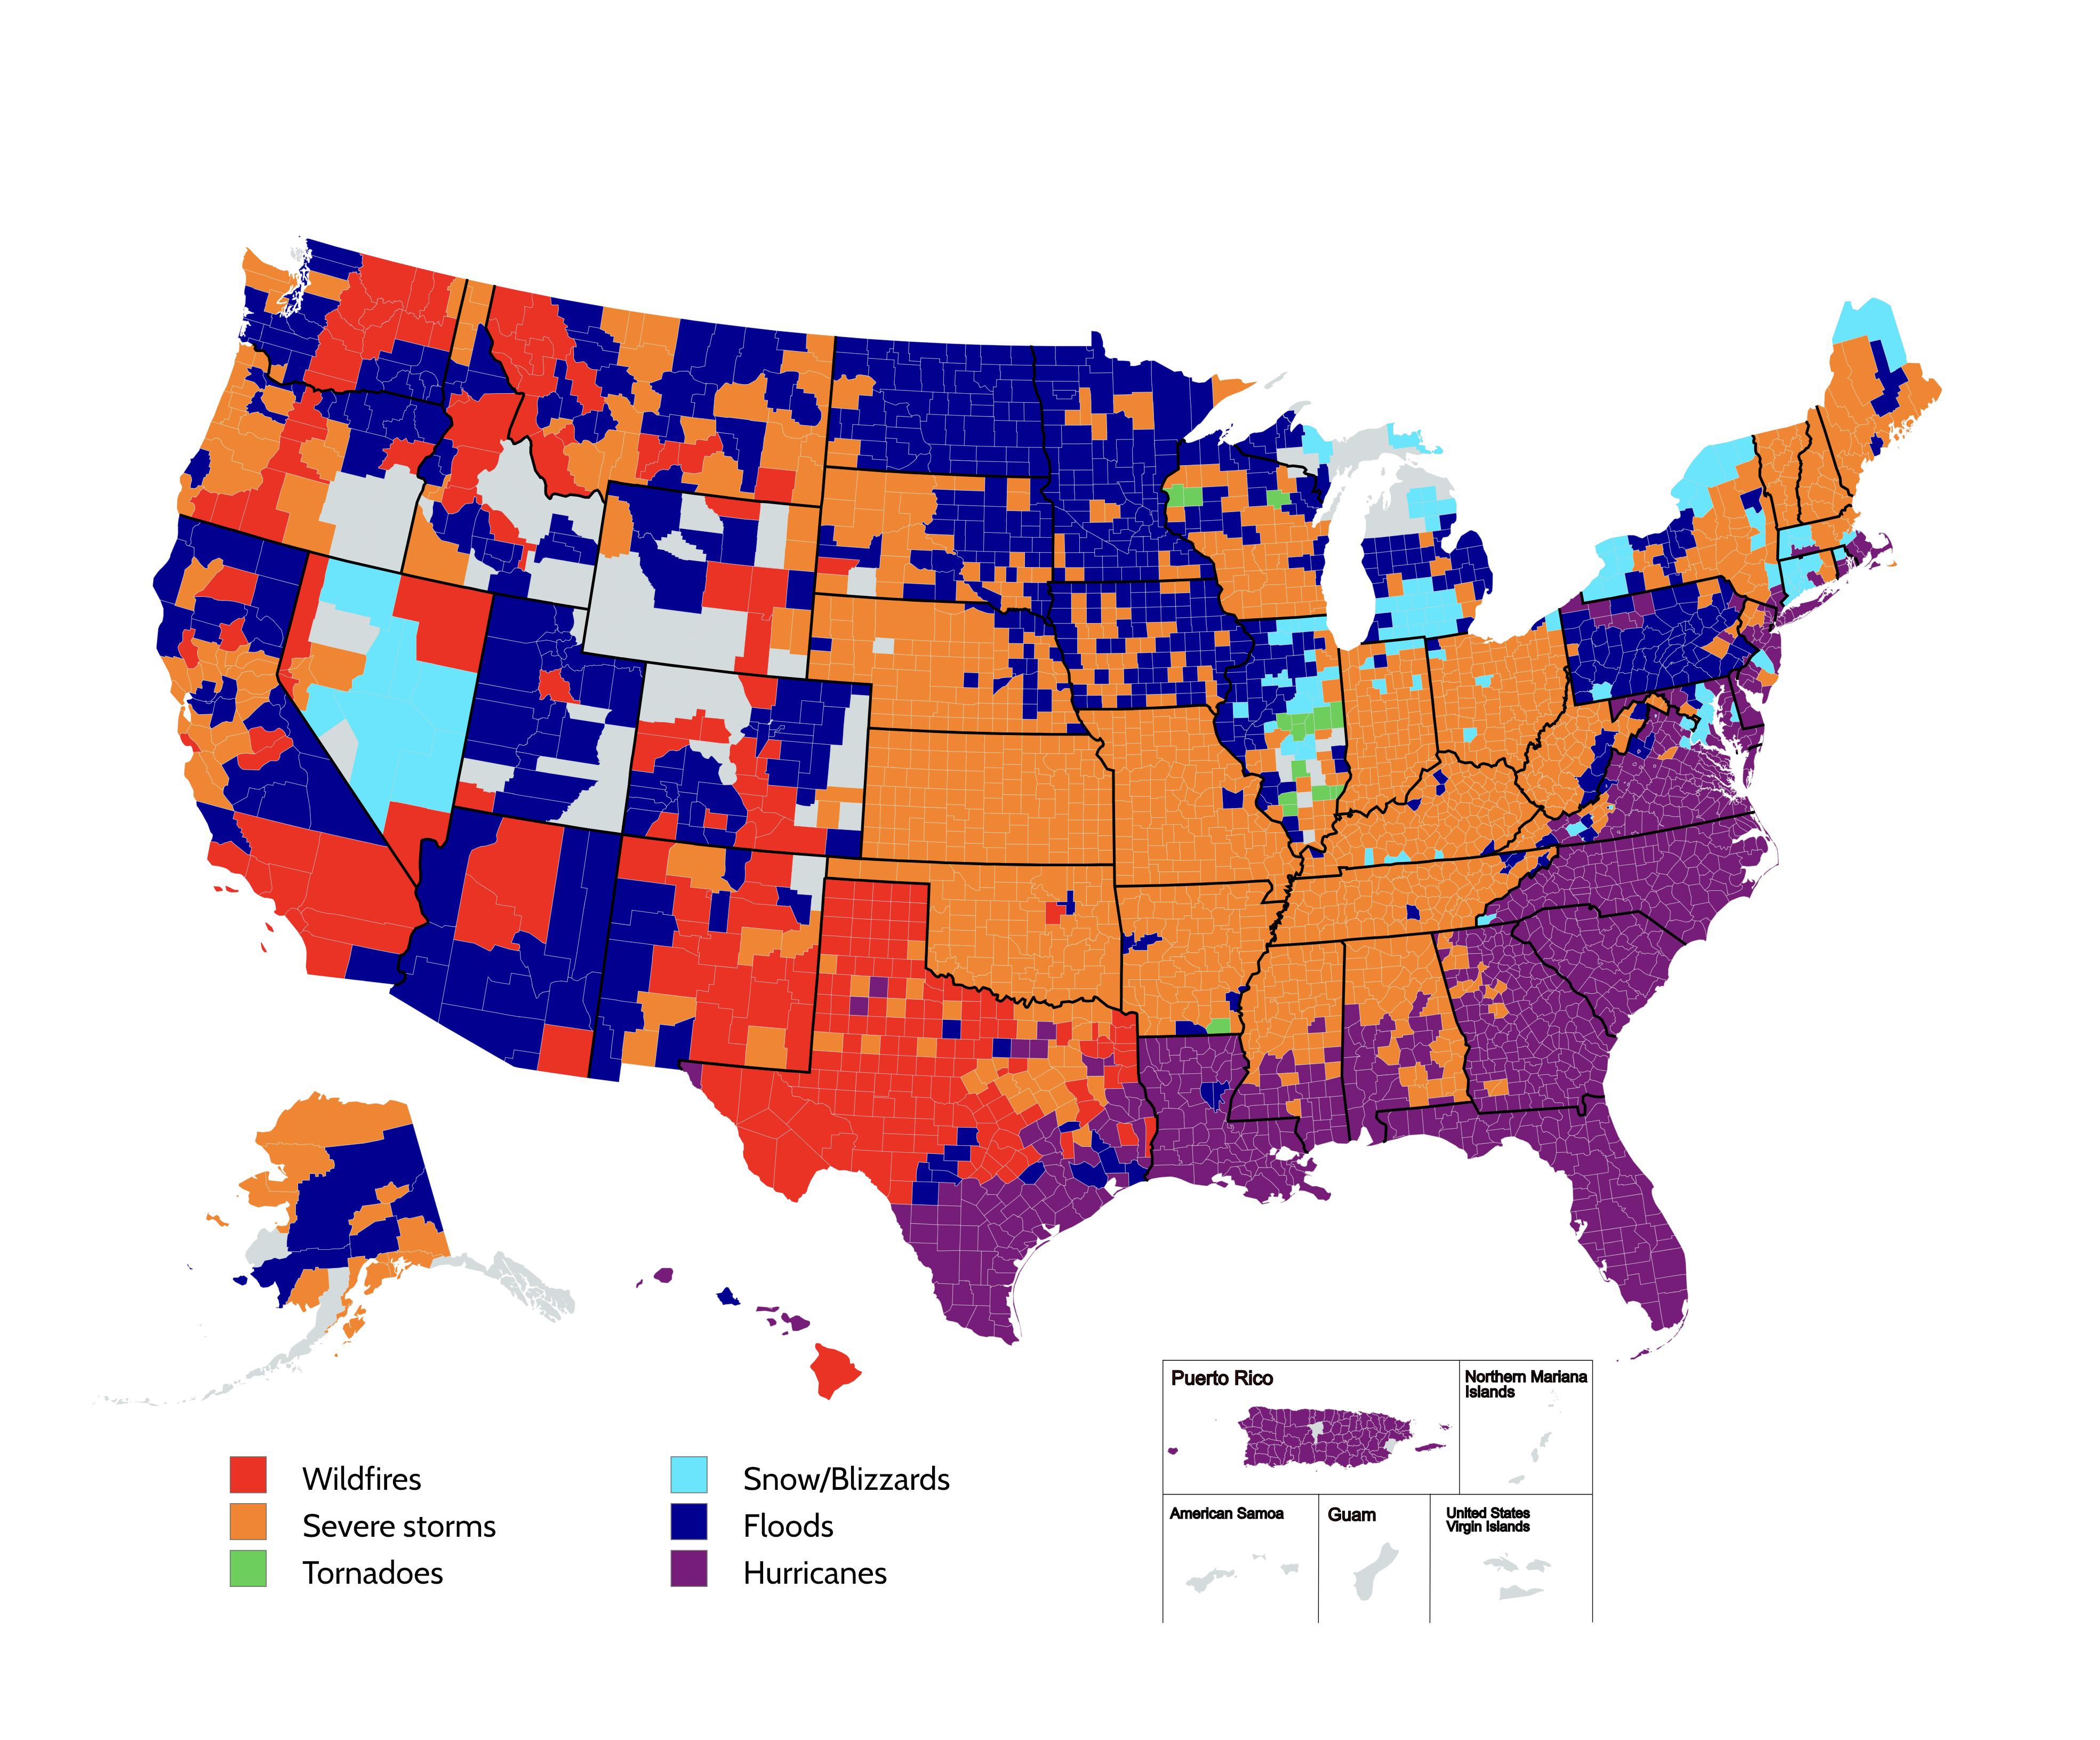
Map of Most Frequently Occurring Natural Disasters by US County
The visualization titled "Most Frequently Occurring Natural Disasters by US County" presents a striking overview of the ...
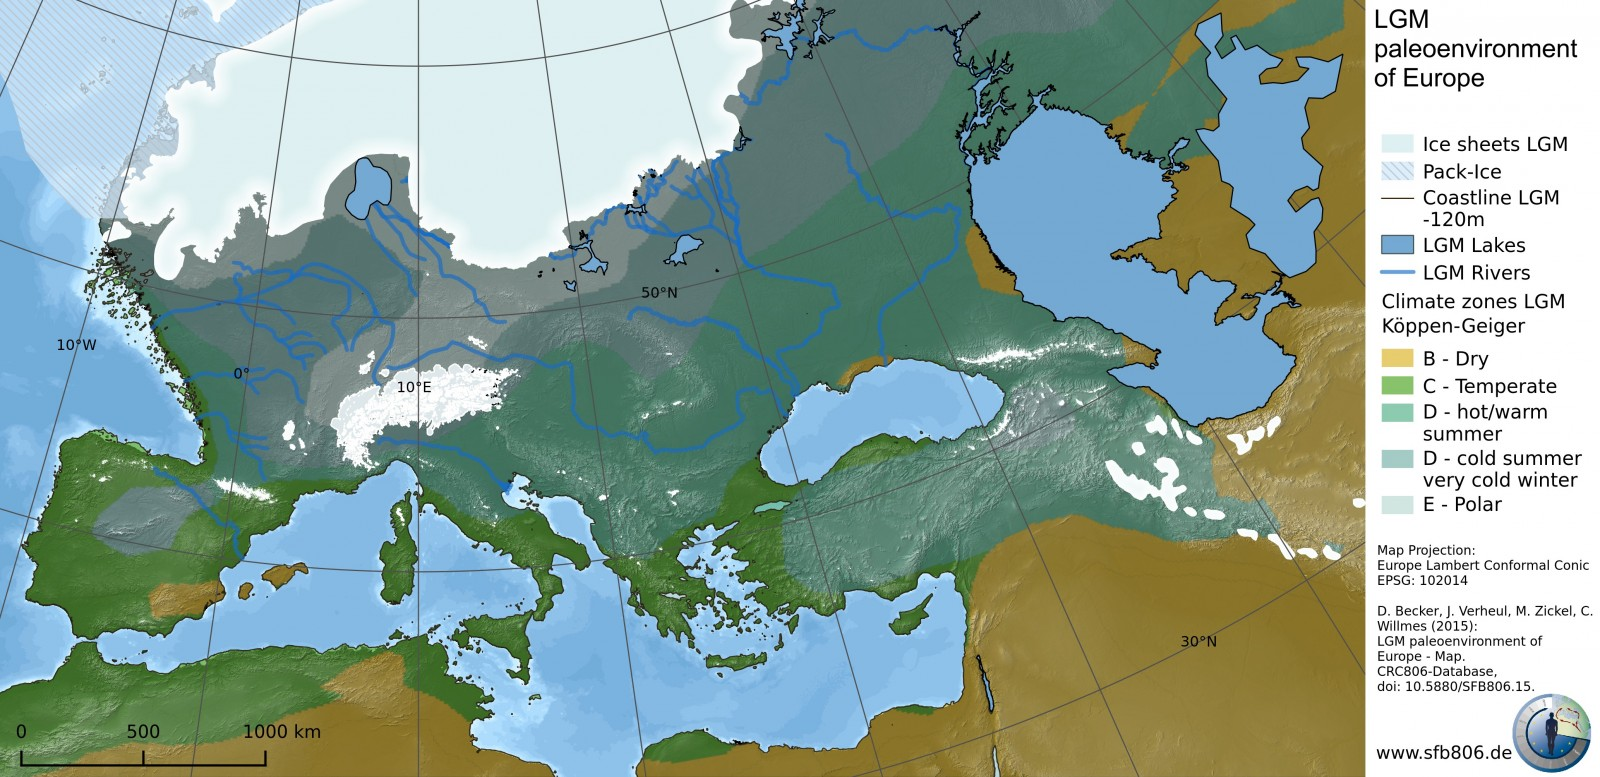
Map of Europe 21,000 Years Ago
This map illustrates Europe as it appeared approximately 21,000 years ago, during the height of the last Ice Age. It rev...

Food Security and Human Rights Map
...
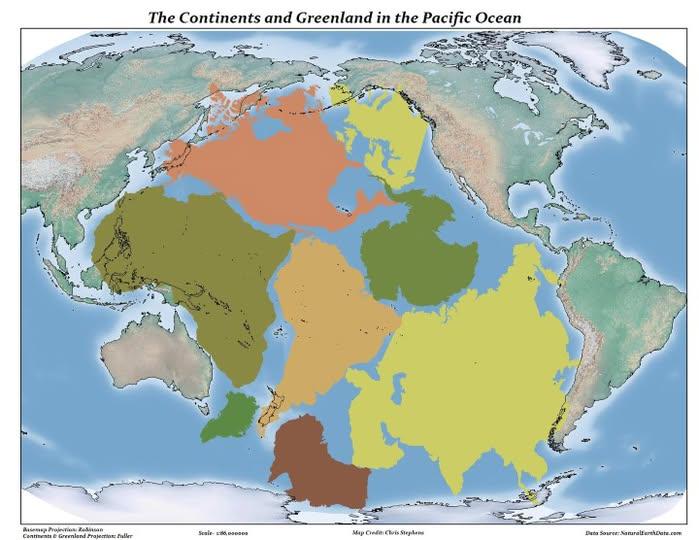
Pacific Ocean Size Compared to Land Map
This map illustrates a staggering comparison: the Pacific Ocean is larger than all the land on Earth combined. Covering ...
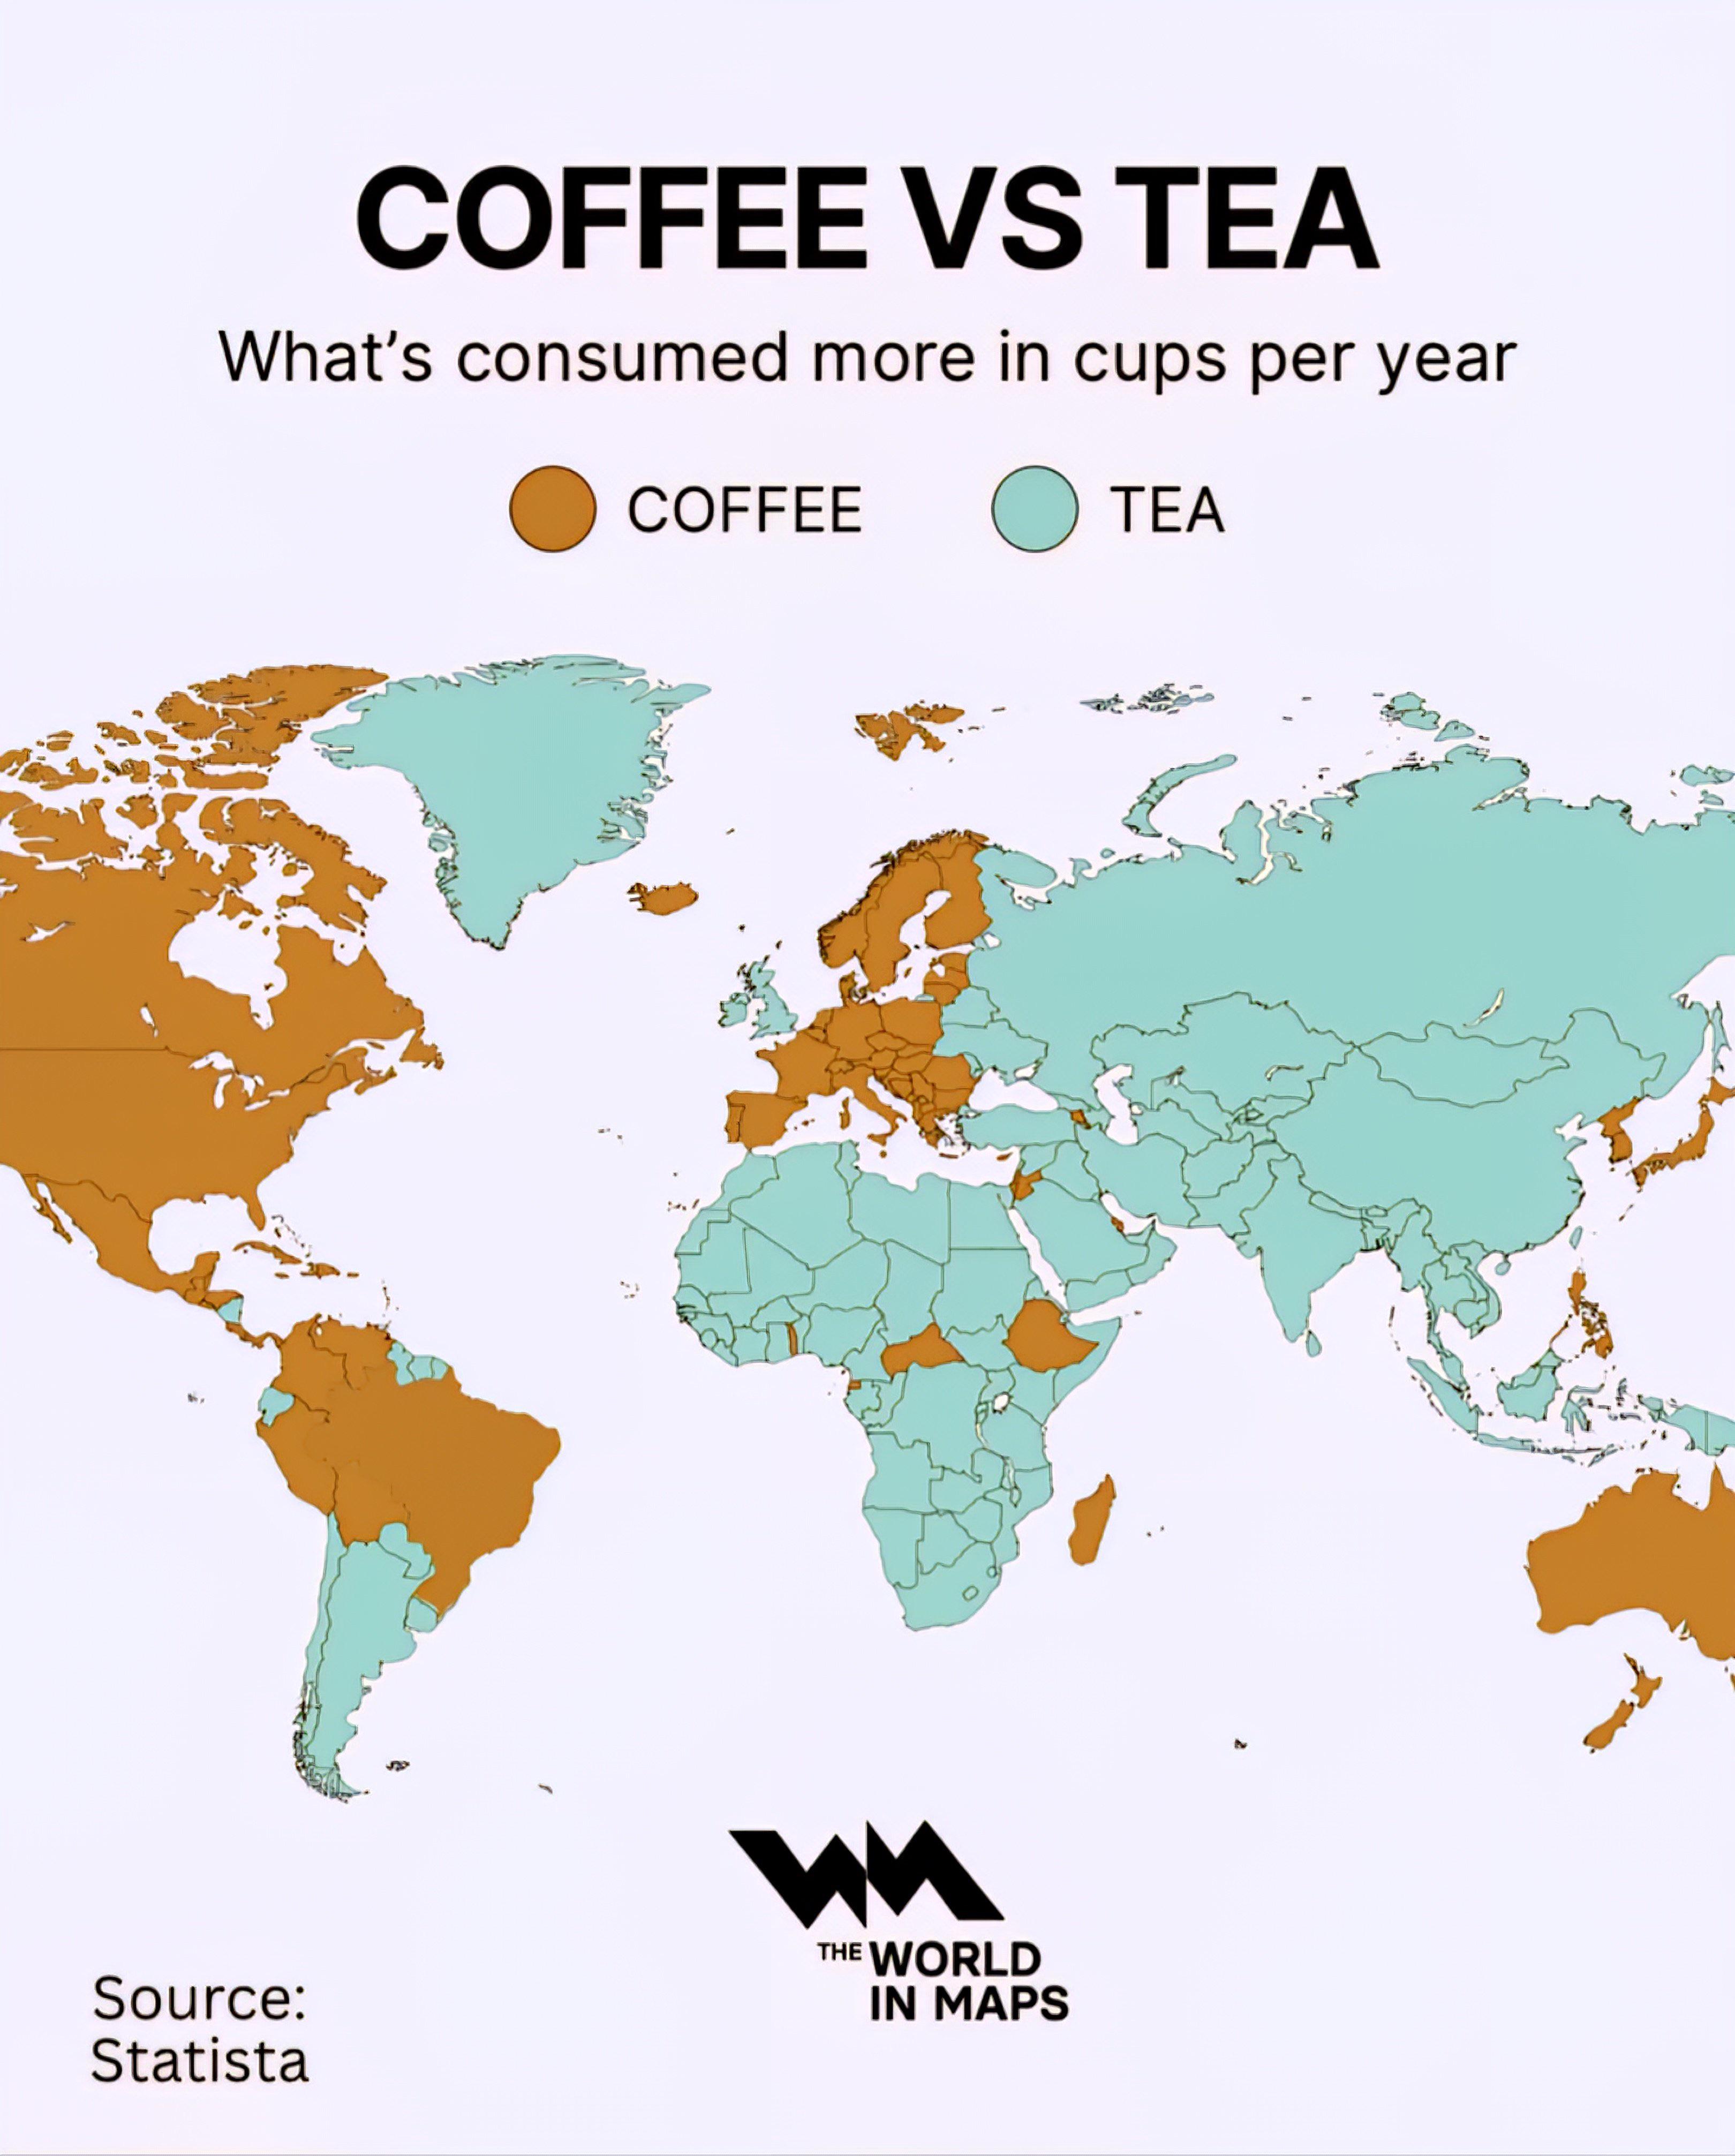
Coffee vs Tea Production Map
...
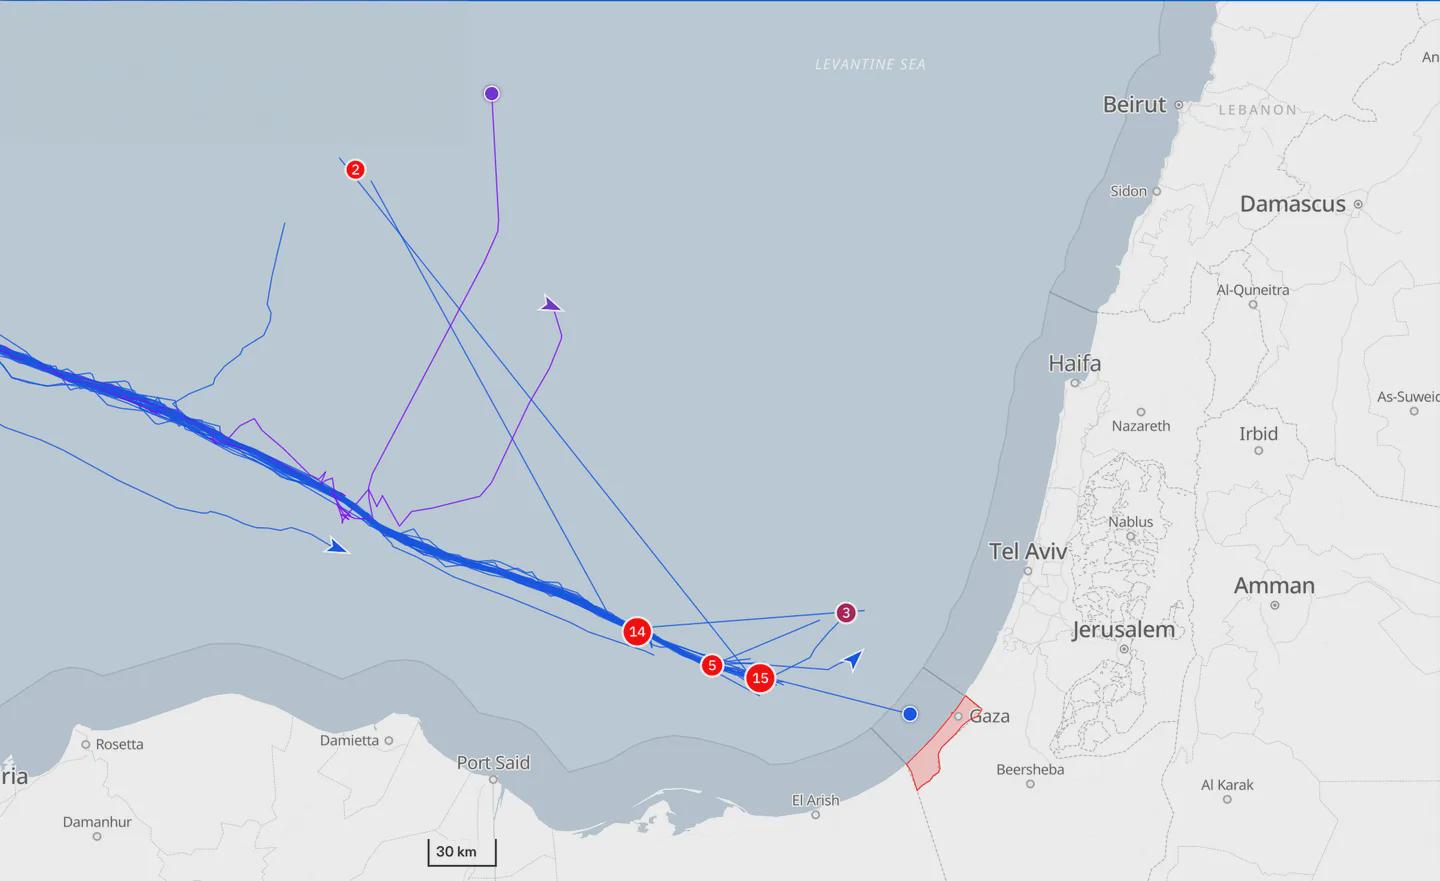
Territorial Waters Map and Maritime Boundaries
The map titled "The one who made it to territorial waters" provides a detailed visualization of territorial waters as de...
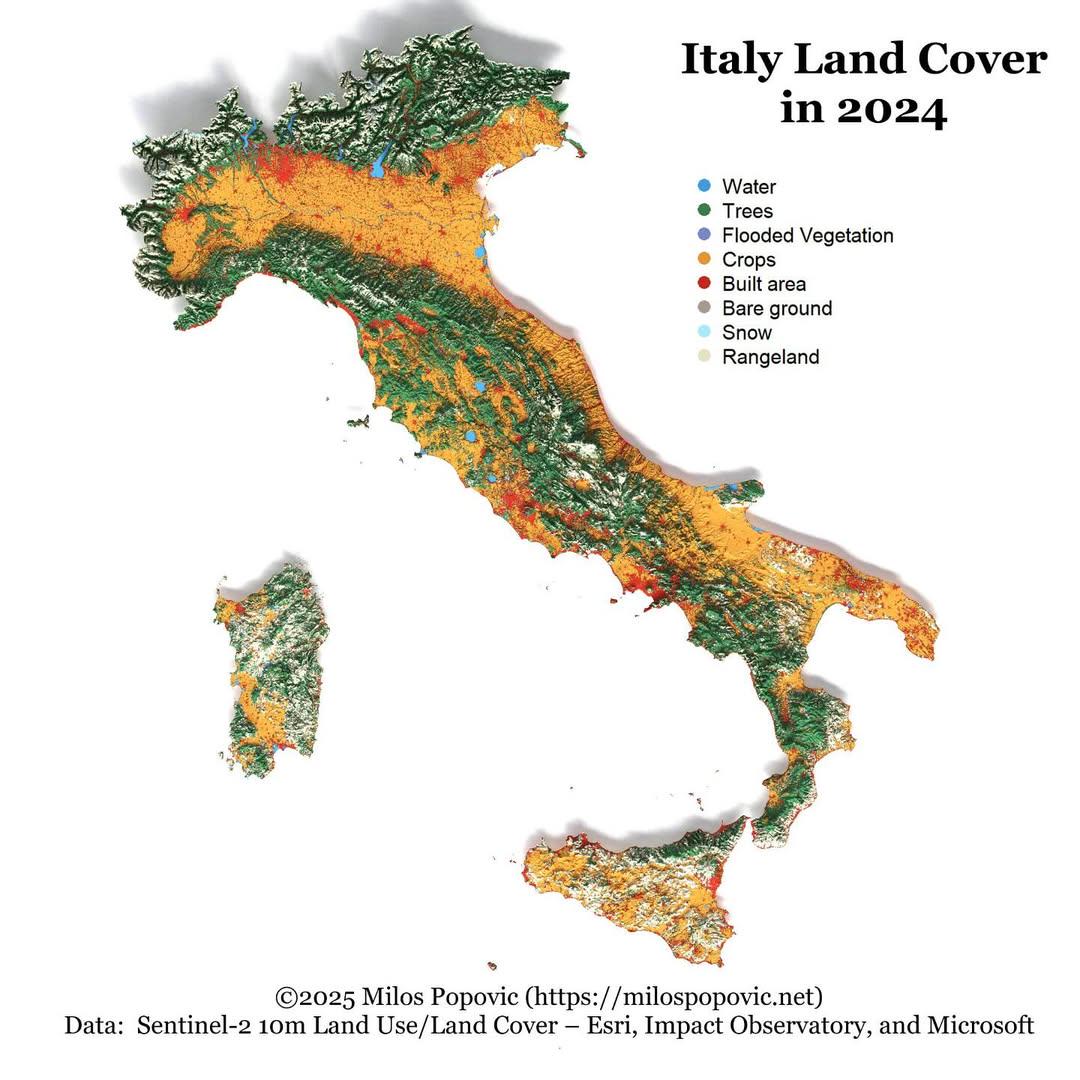
Italy Land Cover Map 2024
The "Italy Land Cover Map 2024" provides a comprehensive visualization of the various land cover types across Italy, ill...
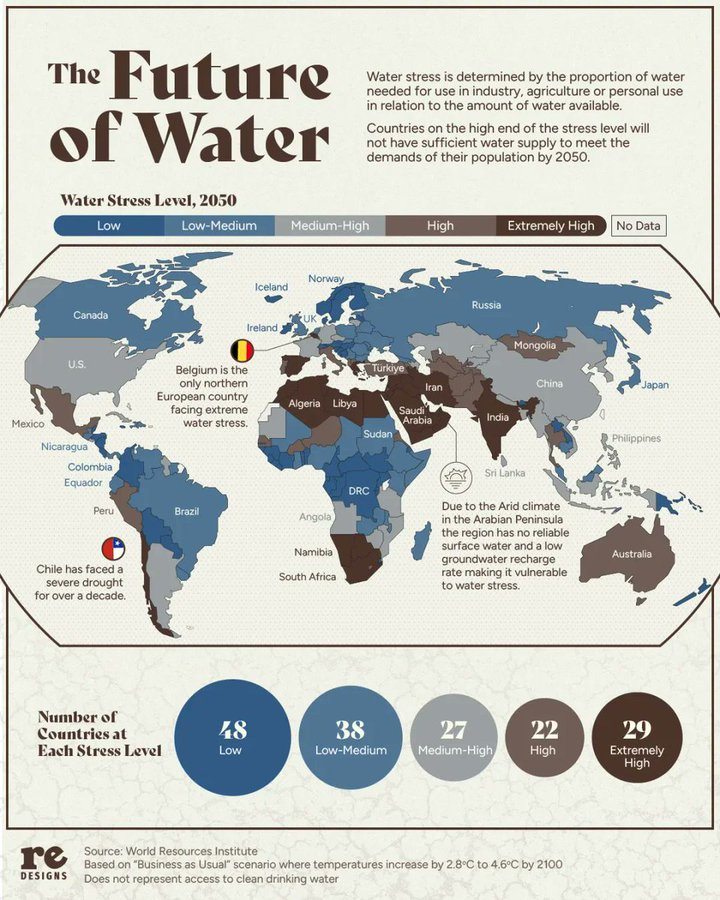
Future of Water Resources Map
The "Future of Water Resources Map" vividly illustrates the projected distribution and availability of freshwater resour...
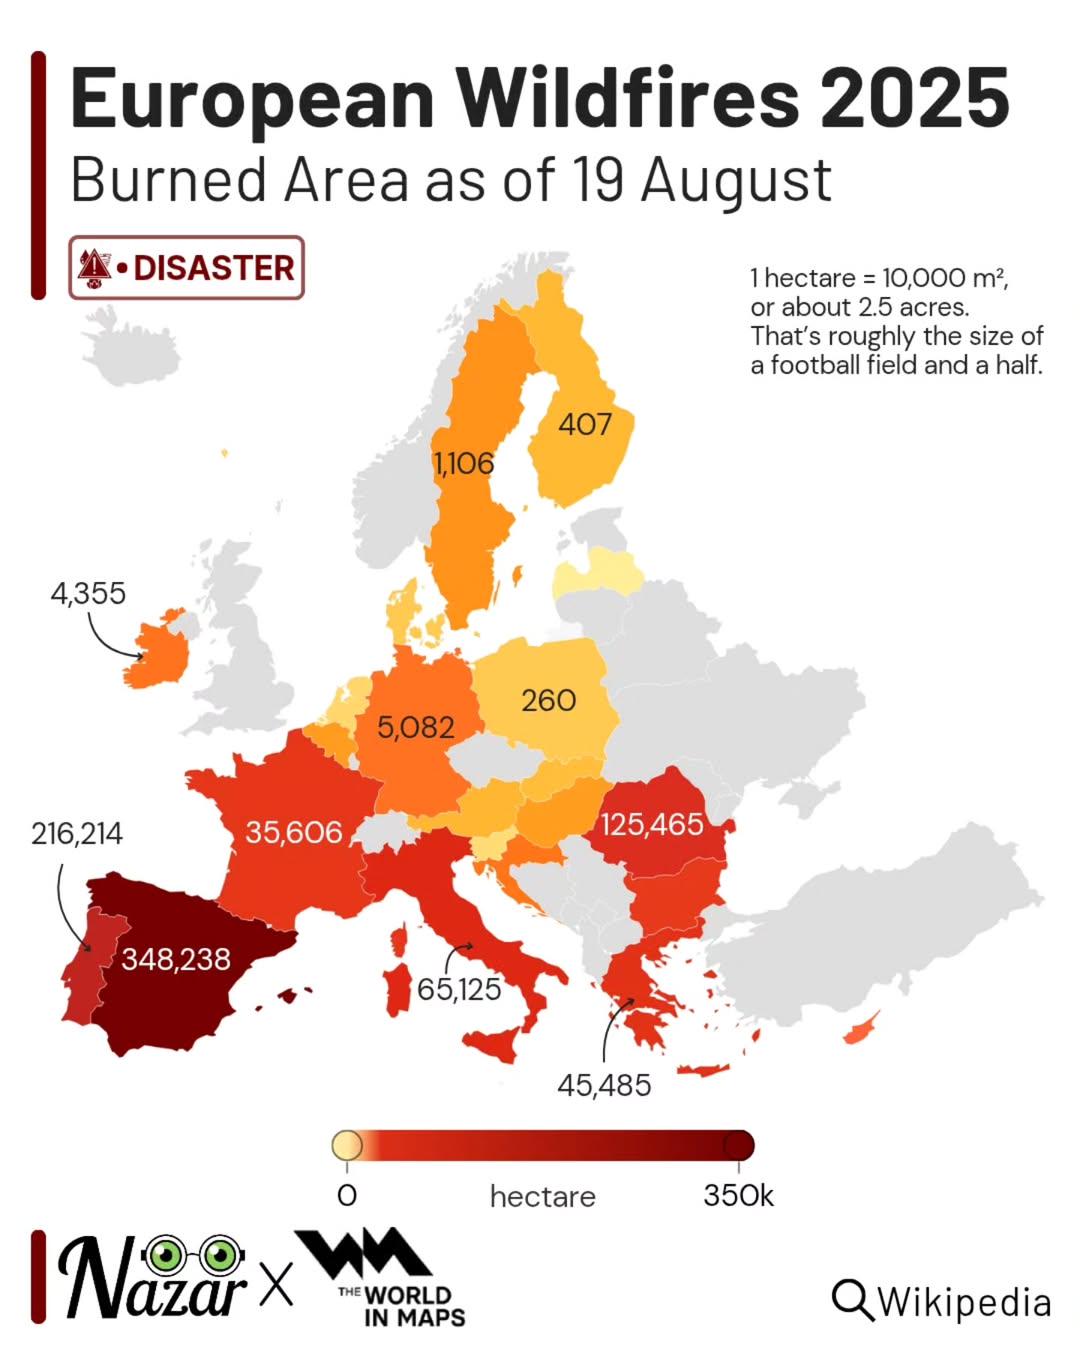
European Wildfires 2025 Map
The "European Wildfires 2025 Map" provides a comprehensive visualization of projected wildfire occurrences throughout Eu...
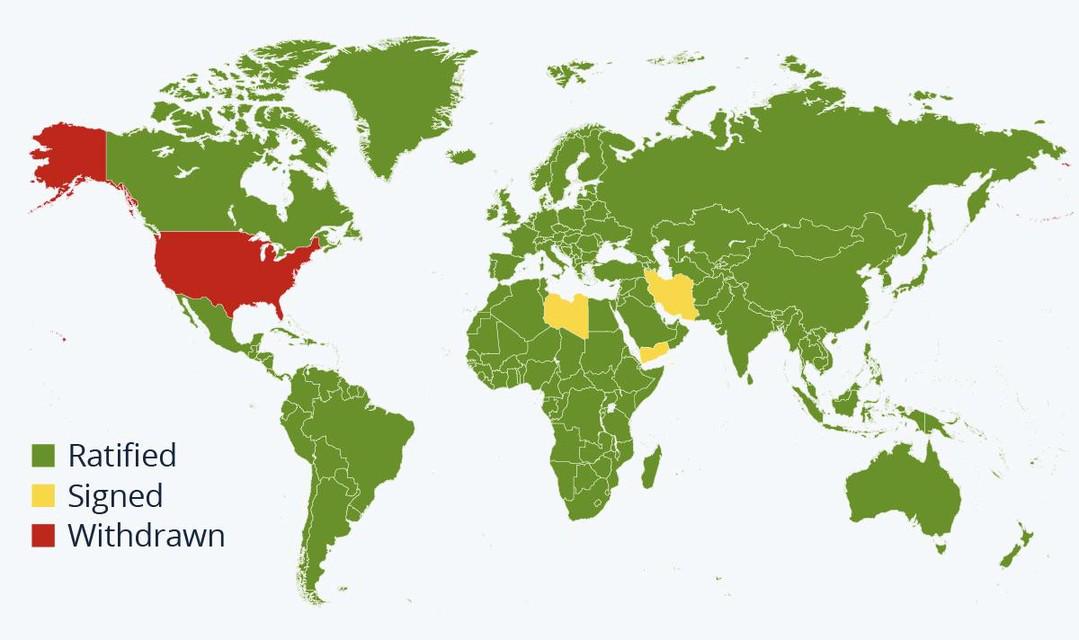
Paris Agreement Participation Status Map
This map provides a visual representation of countries that have ratified, signed, or withdrawn from the Paris Agreement...
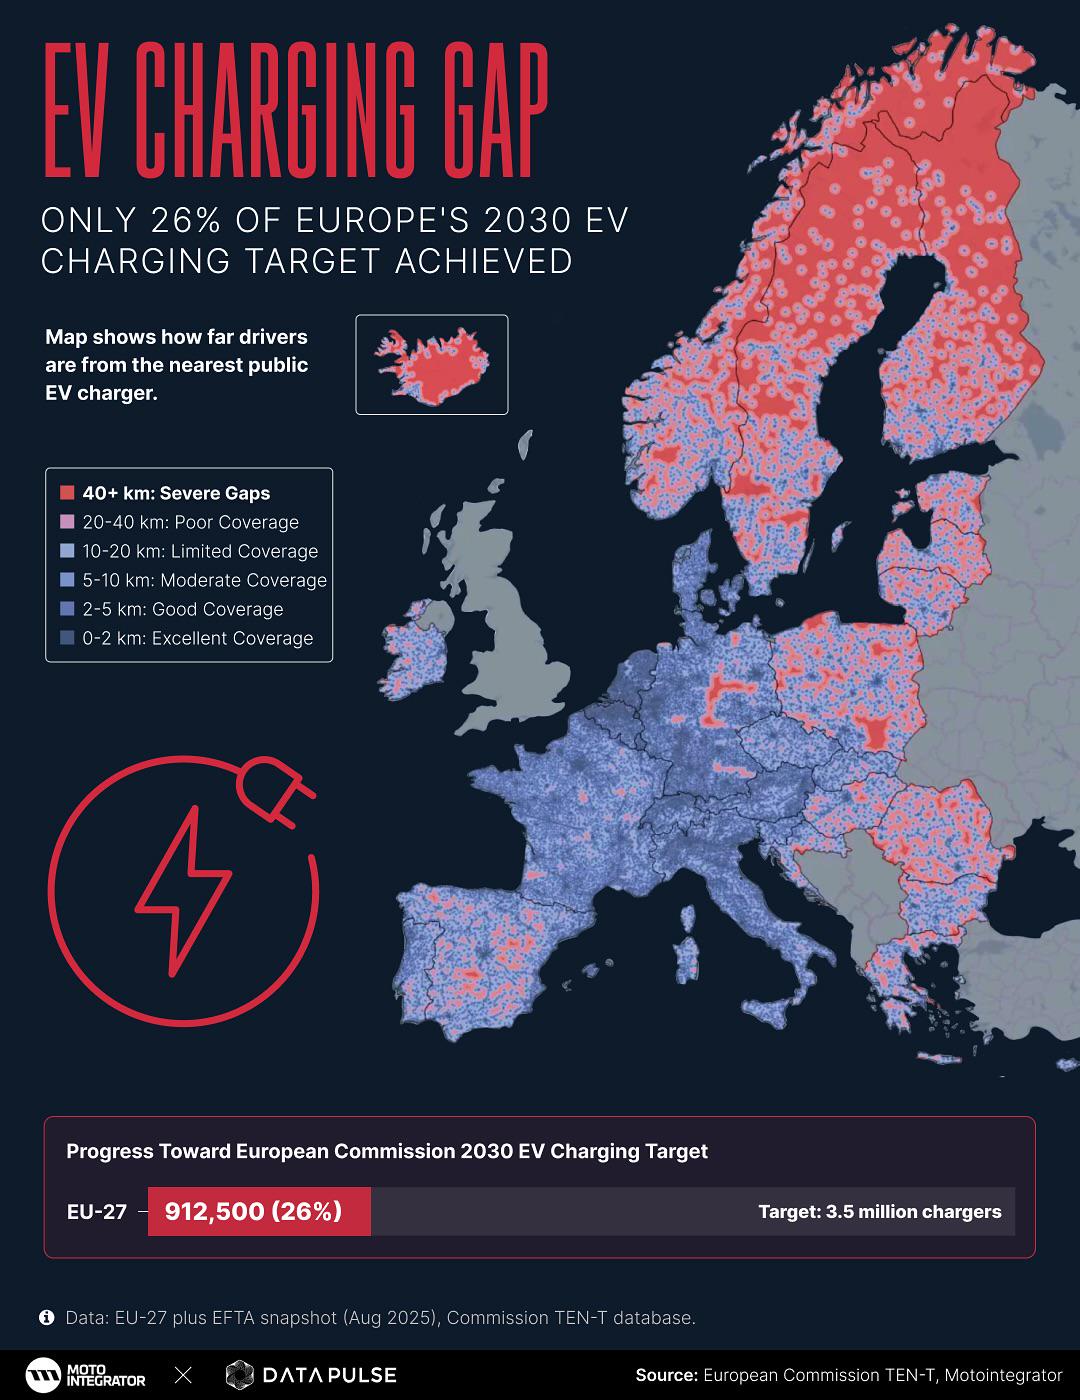
EV Charging Gap Map in Europe 2023
The visualization titled "EV Charging Gap - Only 26% of Europe's 2030 EV Charging Target Achieved" provides a striking o...
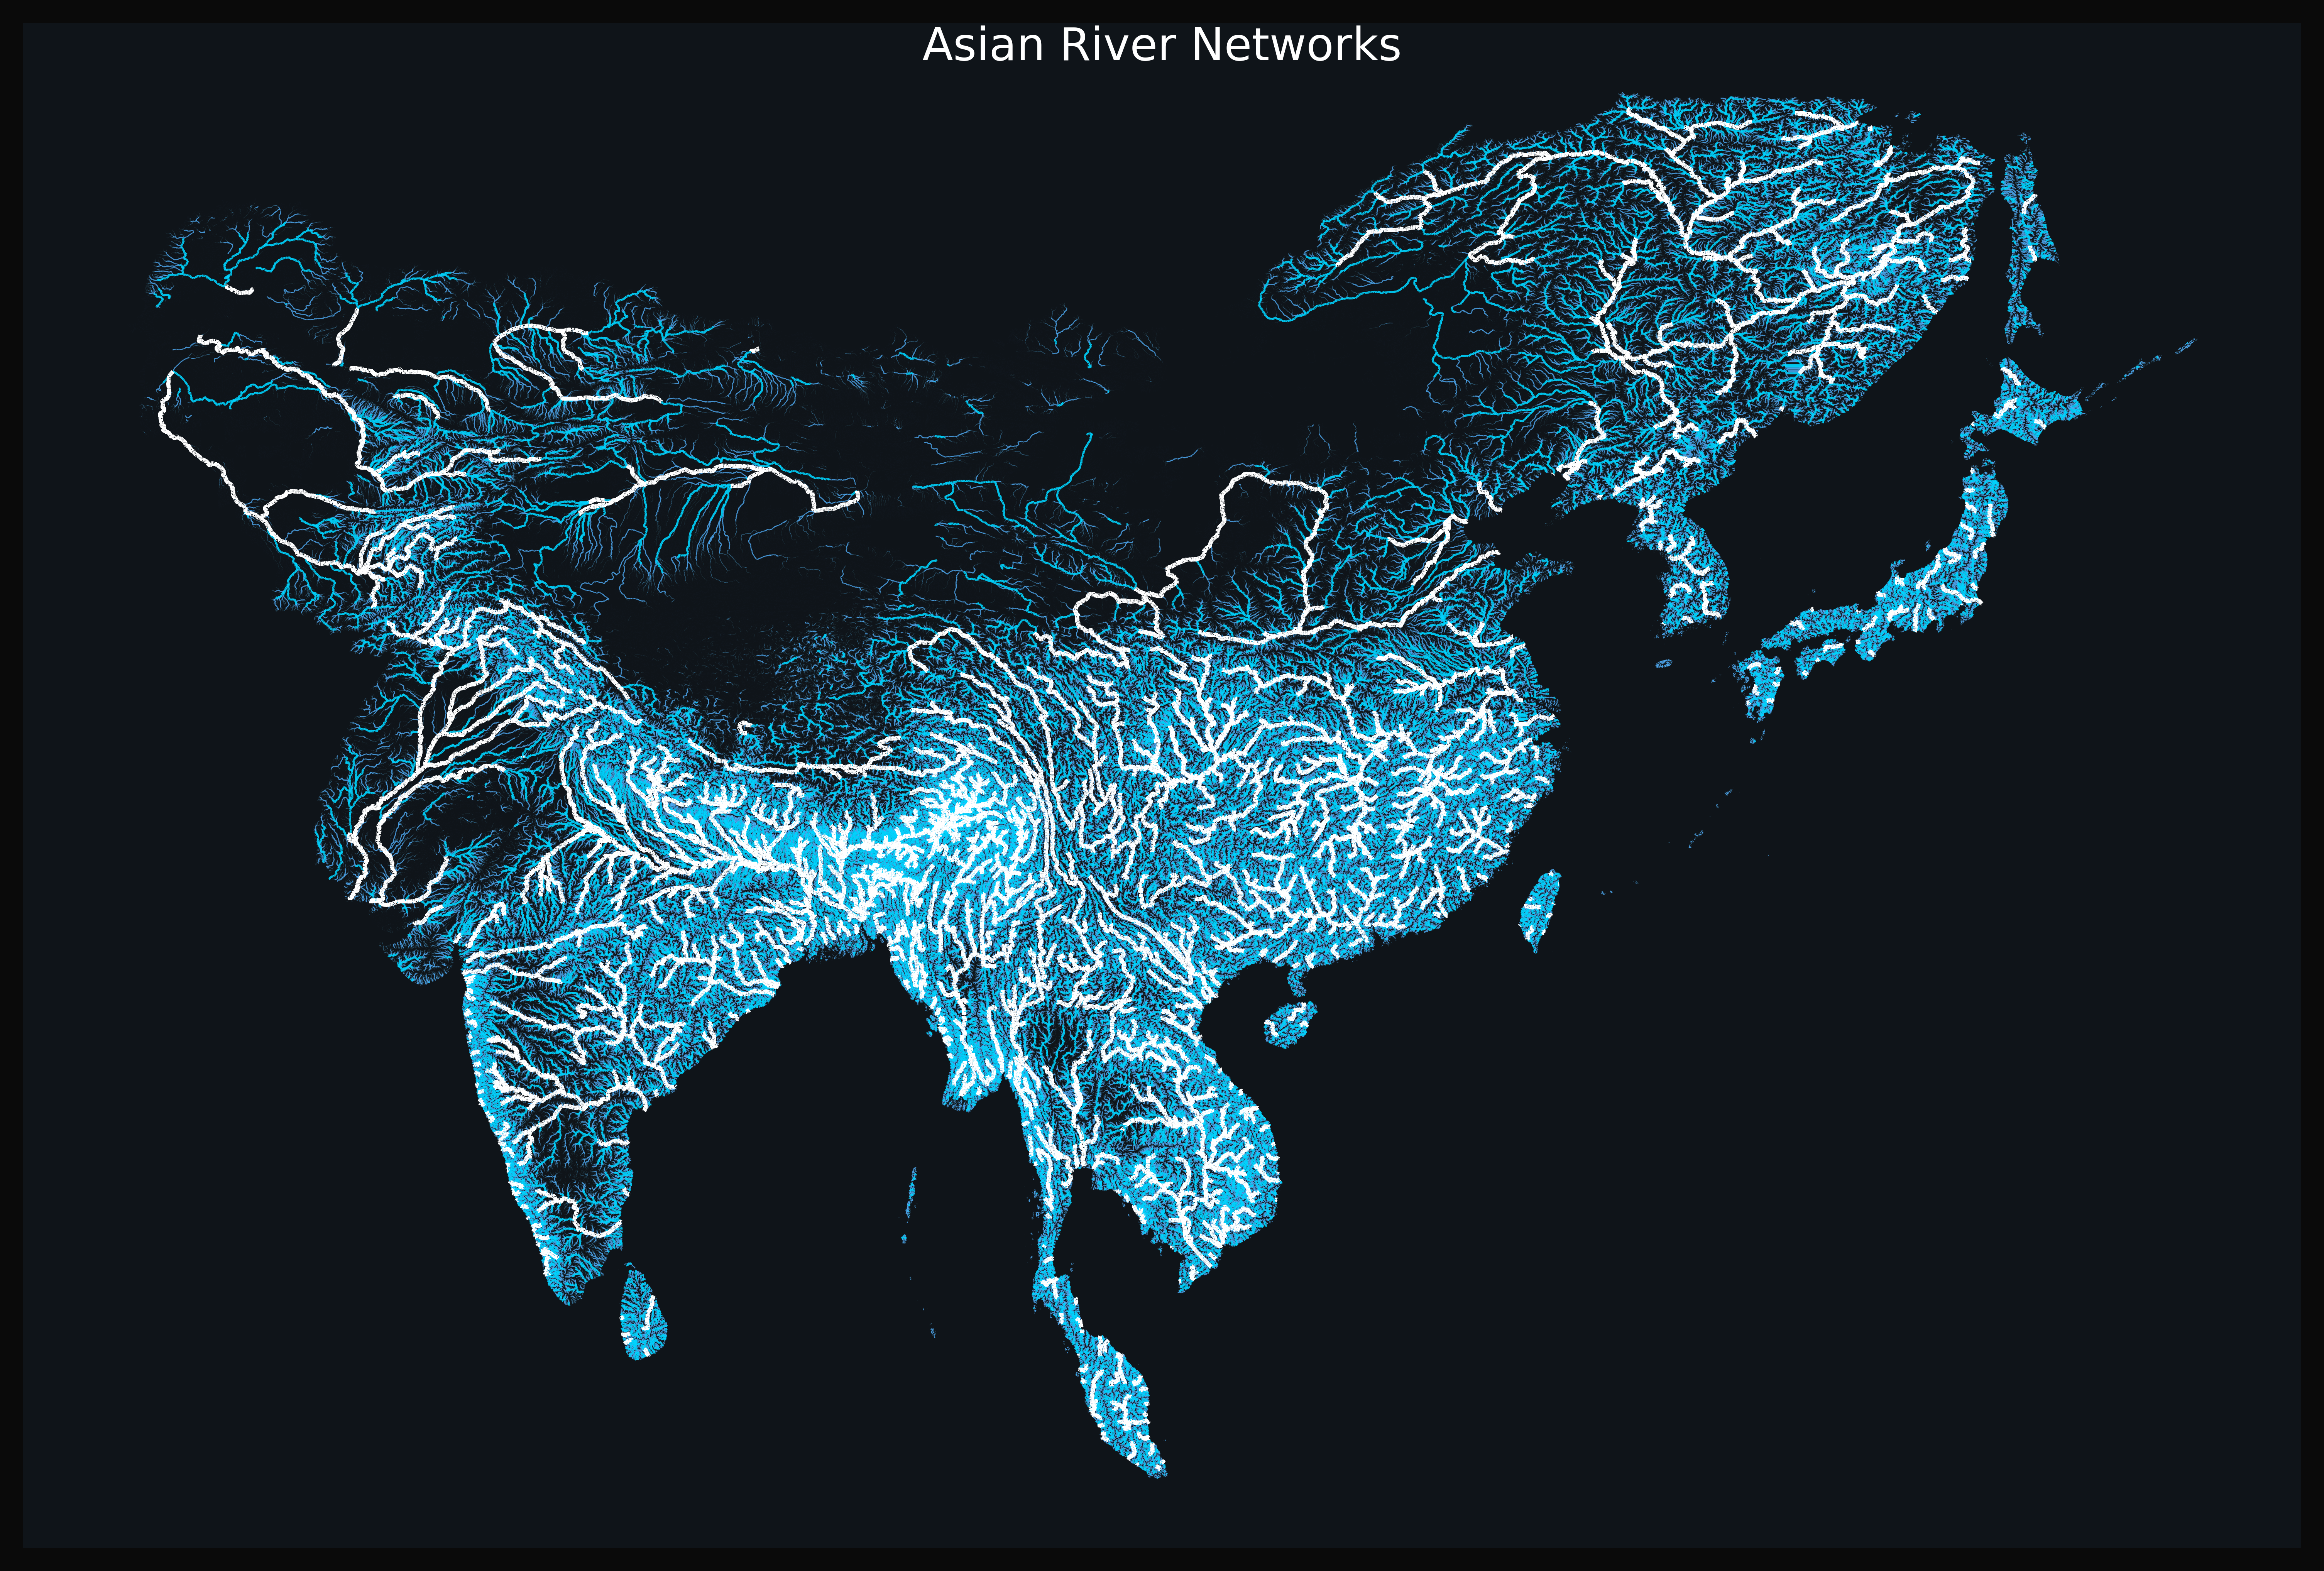
Asian River Networks Map
The "Asian River Networks Map" provides a detailed visualization of the intricate web of river systems across the contin...
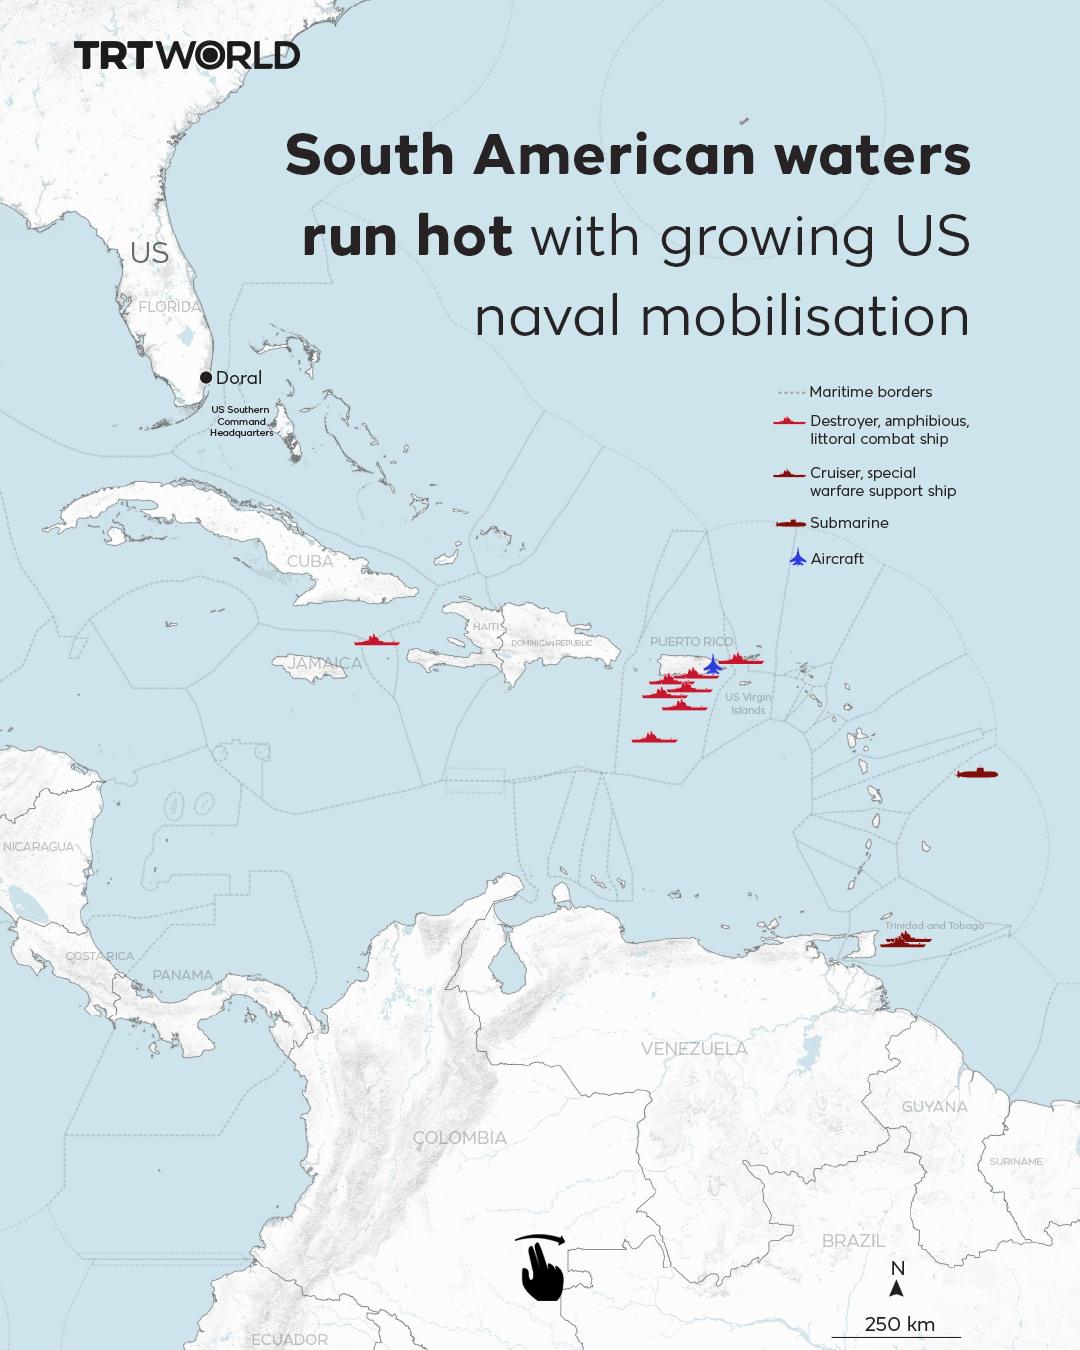
Ocean Currents Map of South America
The map titled "The seas off South America are stirring again" illustrates the intricate patterns of ocean currents that...

Elevation Map of the Tibetan Plateau
The elevation map of the Tibetan Plateau is a striking visualization that highlights one of the most significant geograp...
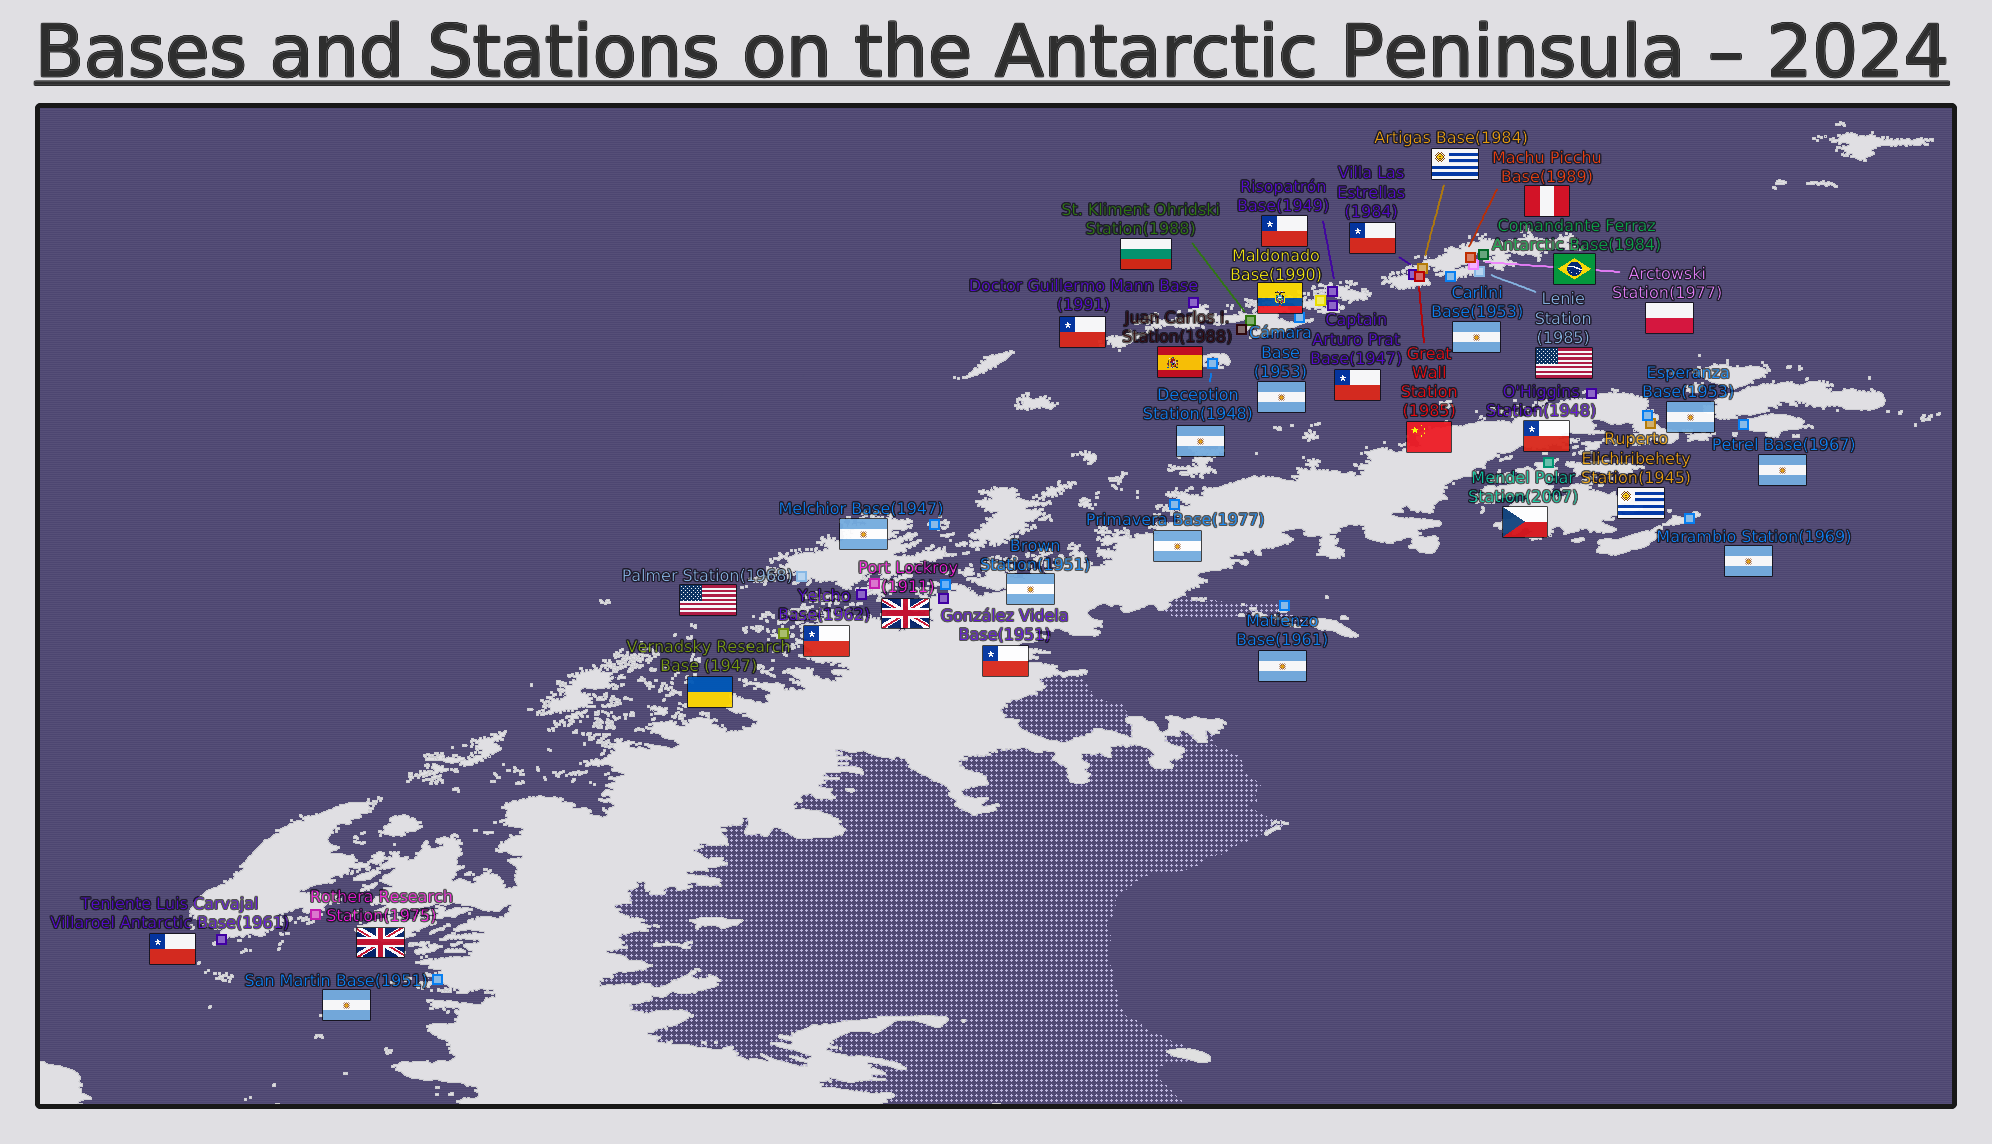
Bases and Stations on the Antarctic Peninsula Map
The "Bases and Stations on the Antarctic Peninsula Map" provides a detailed view of the various research stations and ba...
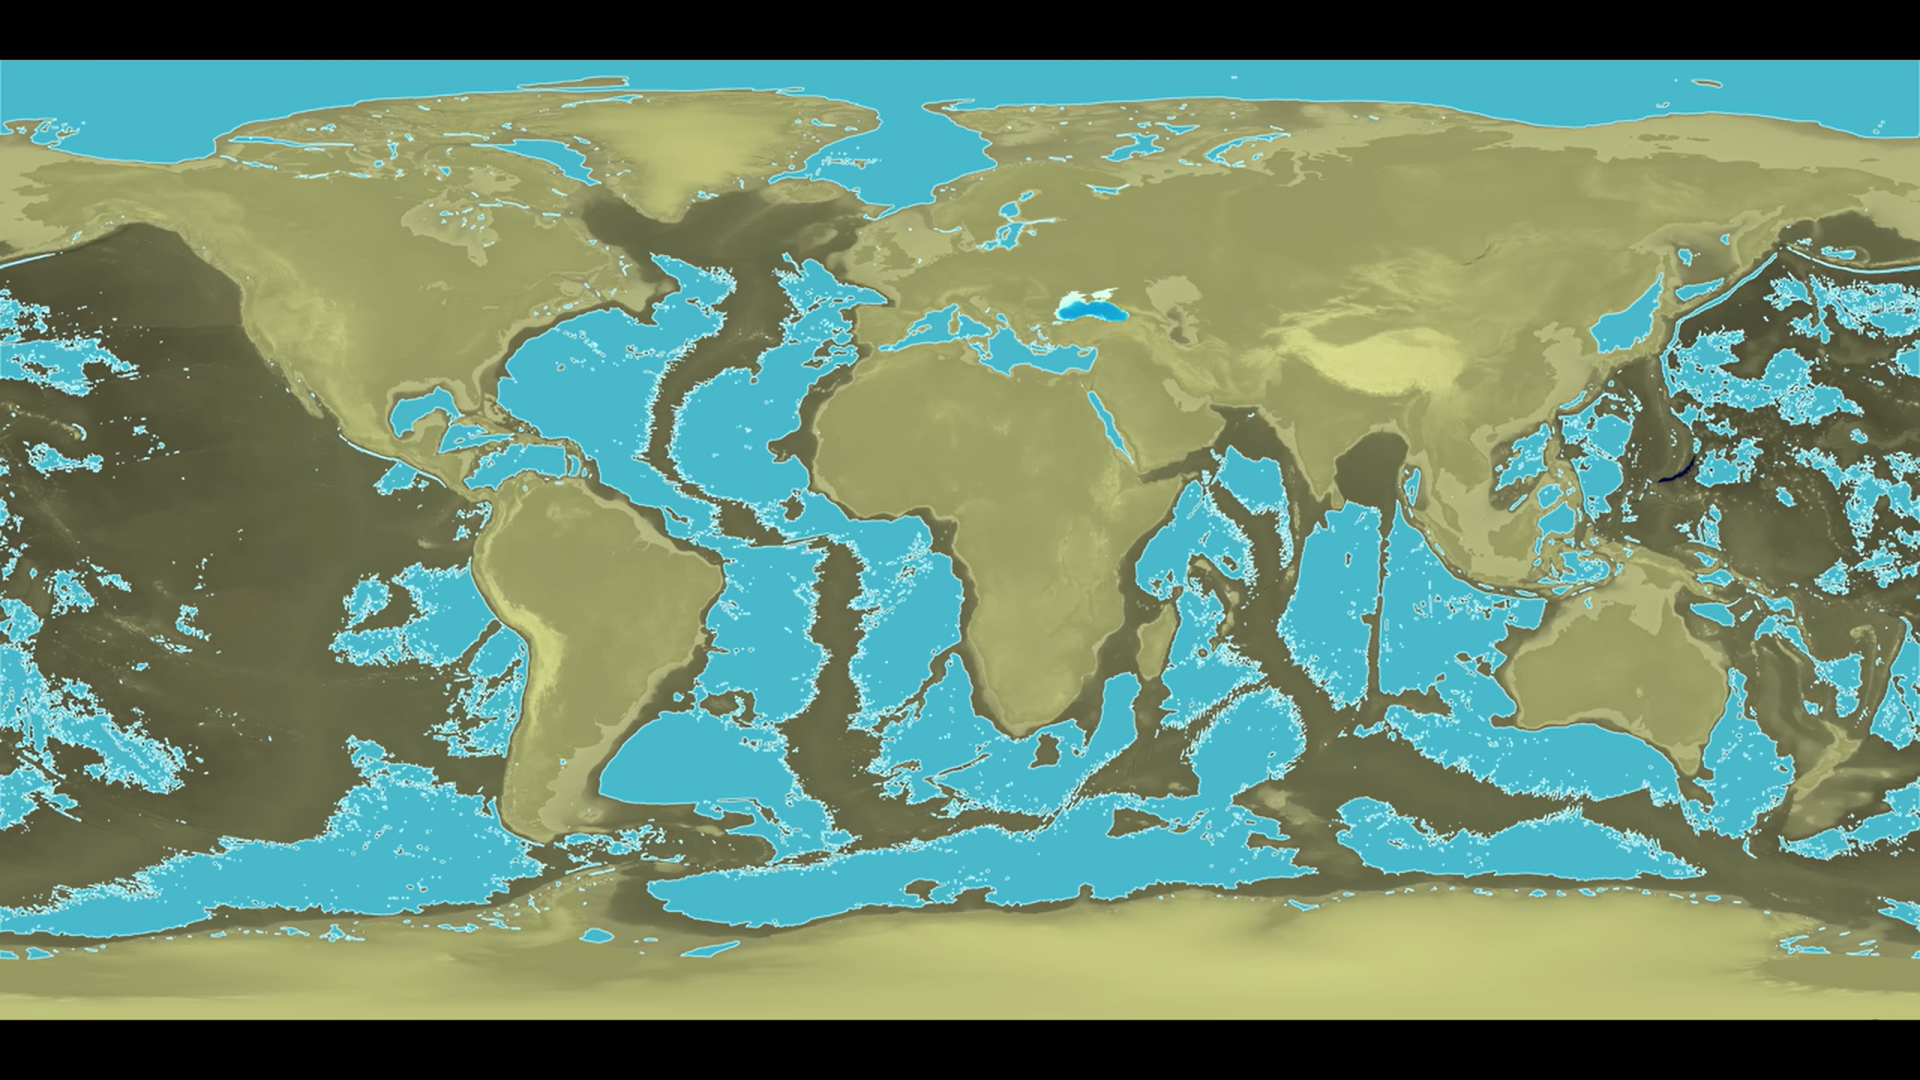
Coastline Changes Map After Draining Oceans
This intriguing visualization presents a hypothetical scenario: what would Earth's coastlines look like if we could drai...
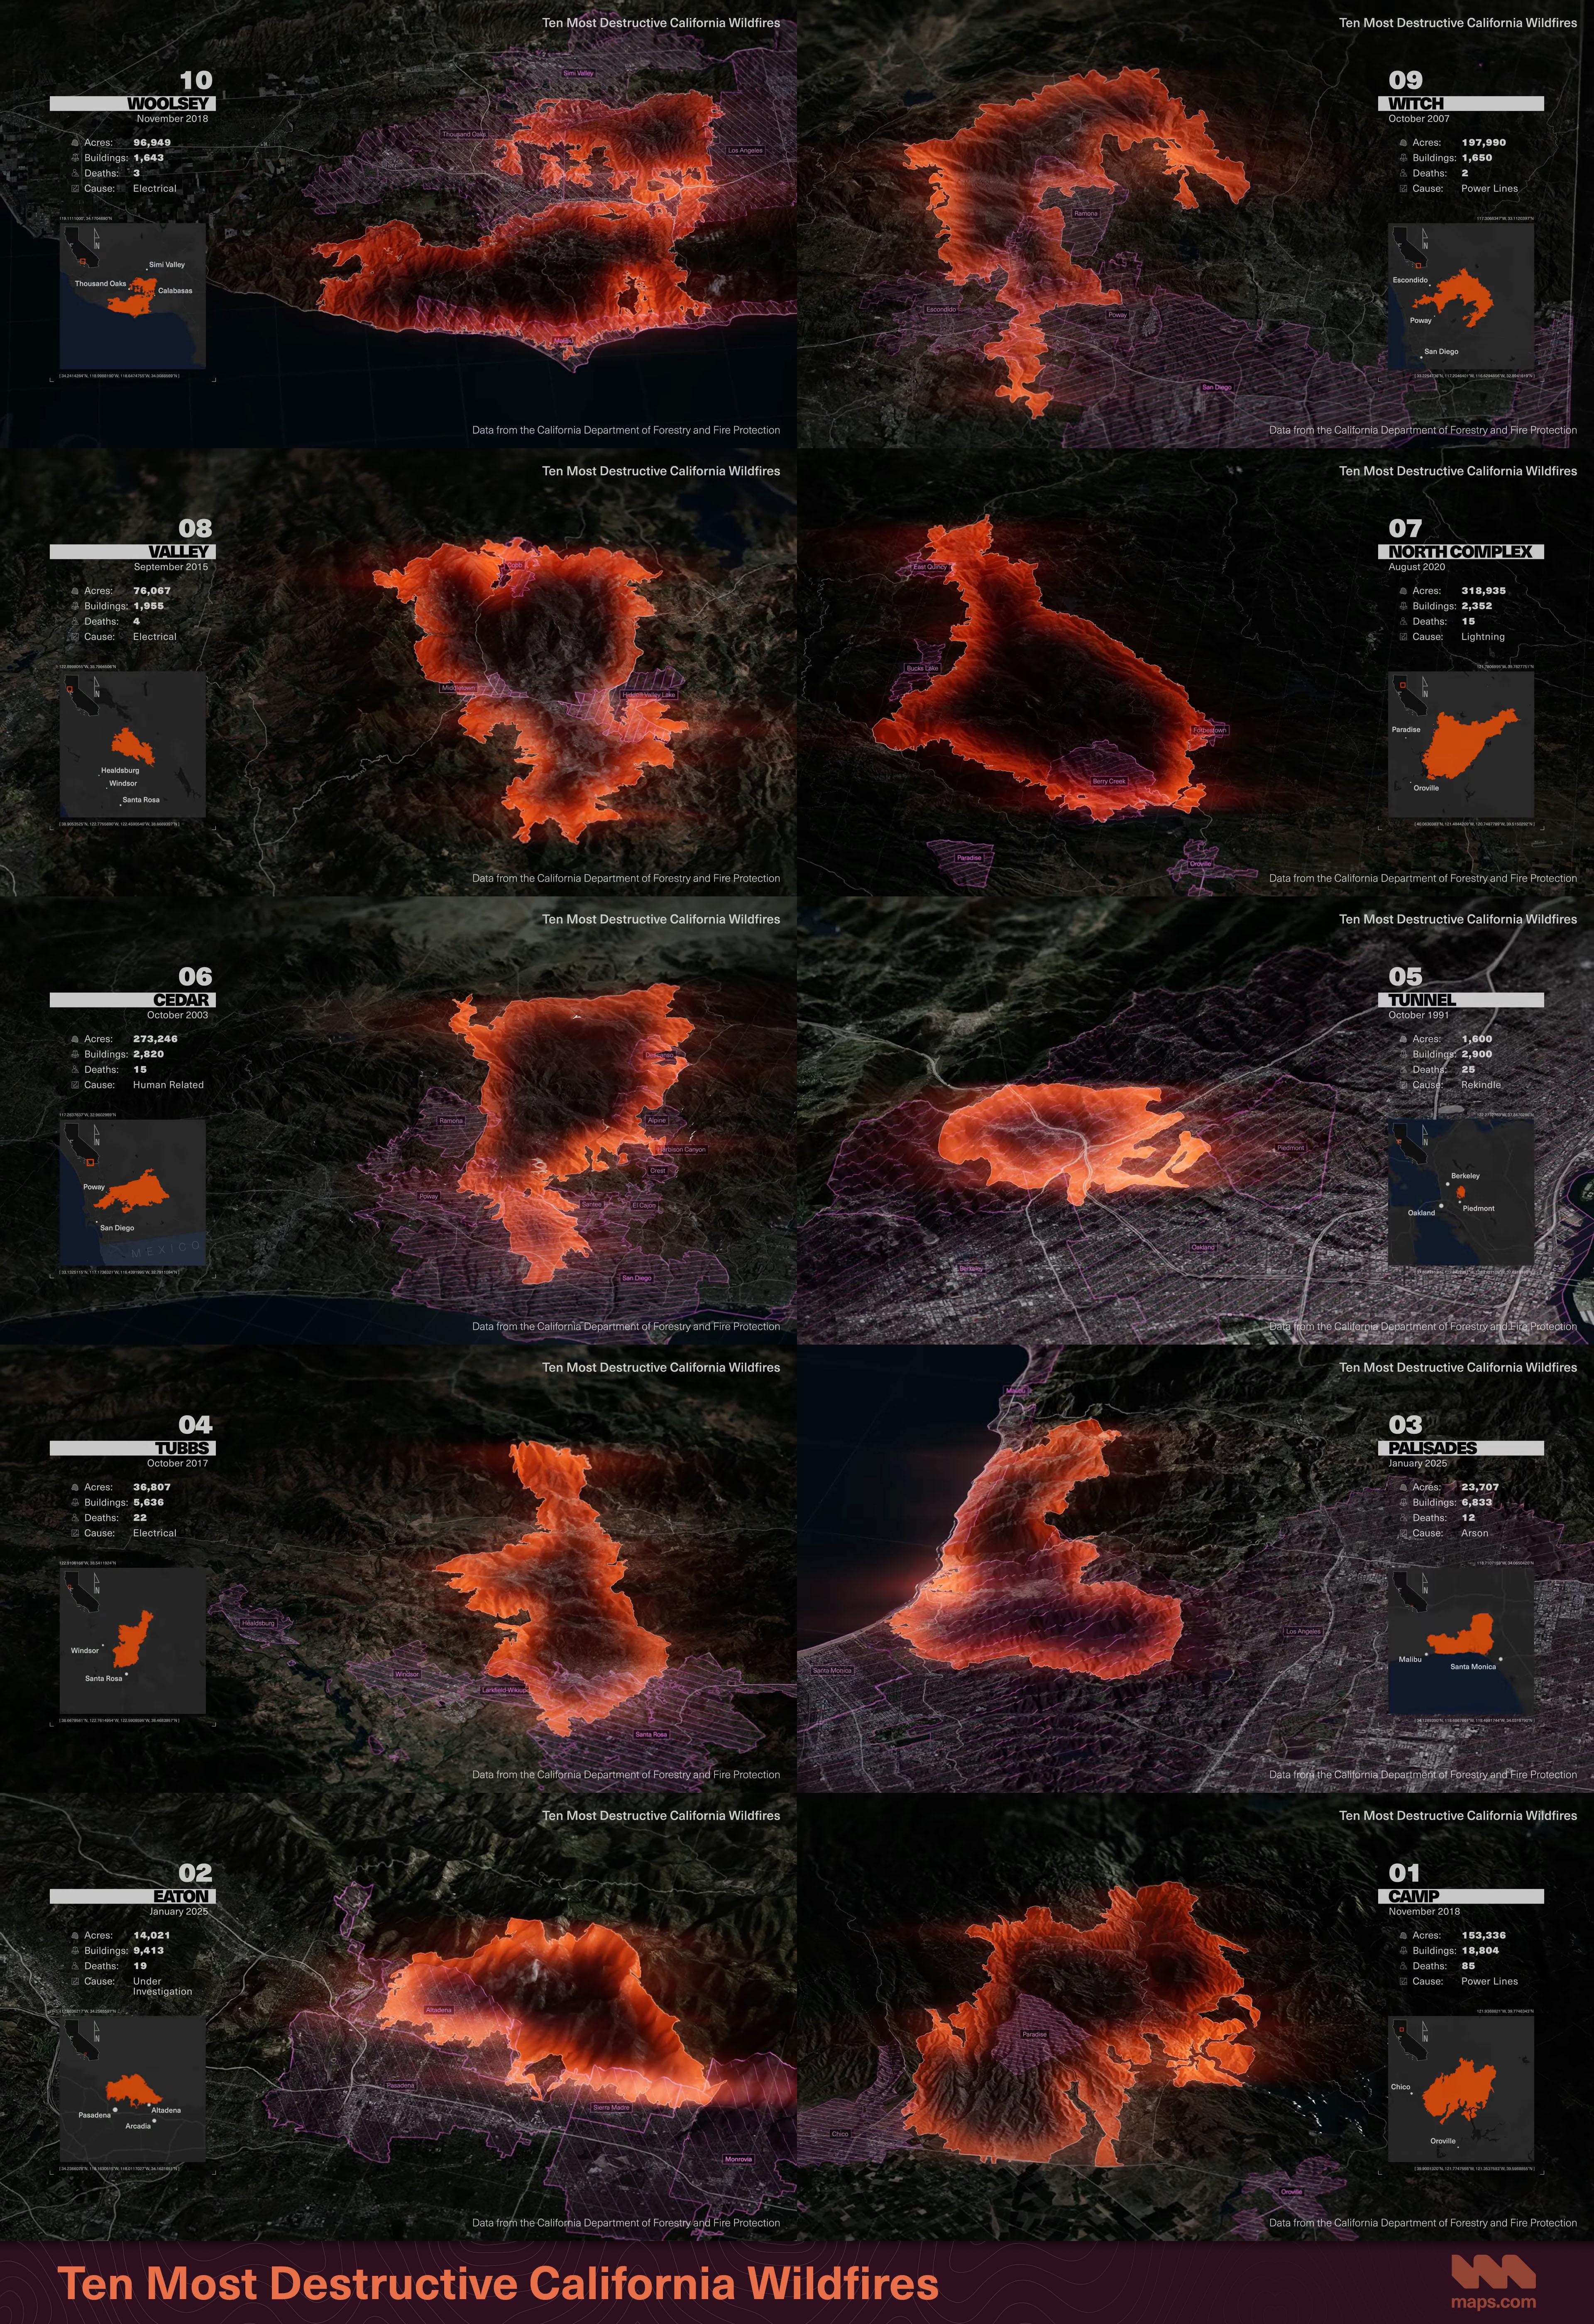
Ten Most Destructive California Wildfires Map
The "Ten Most Destructive California Wildfires Map" provides a stark visual representation of the most catastrophic wild...
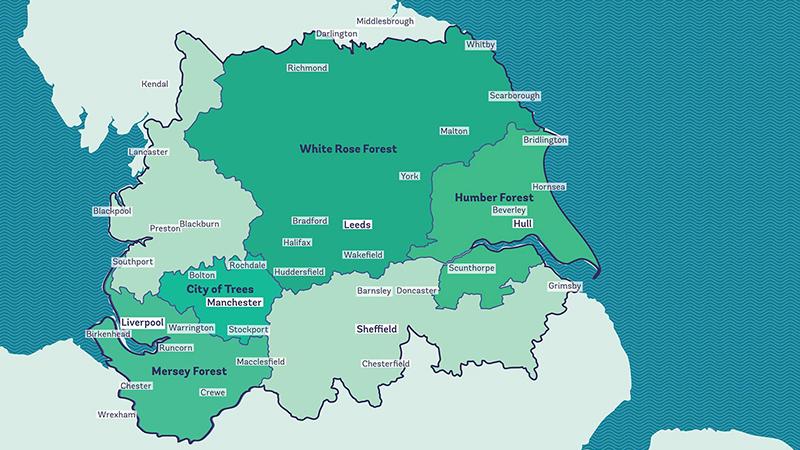
Reforesting Britain Map – The Northern Forest Map
The "Reforesting Britain Map – The Northern Forest" focuses on a significant environmental initiative launched in 2018. ...
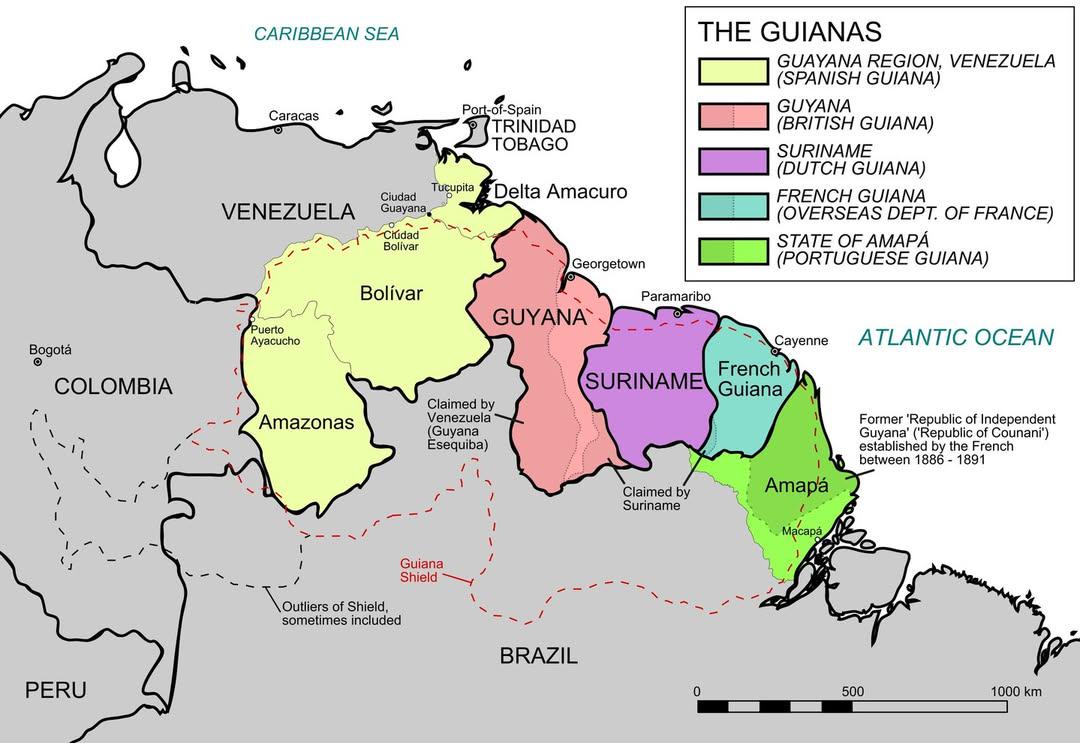
Map of The Five Guianas
The map titled "The Five Guianas" visualizes the unique geographical and political landscape of the five territories kno...
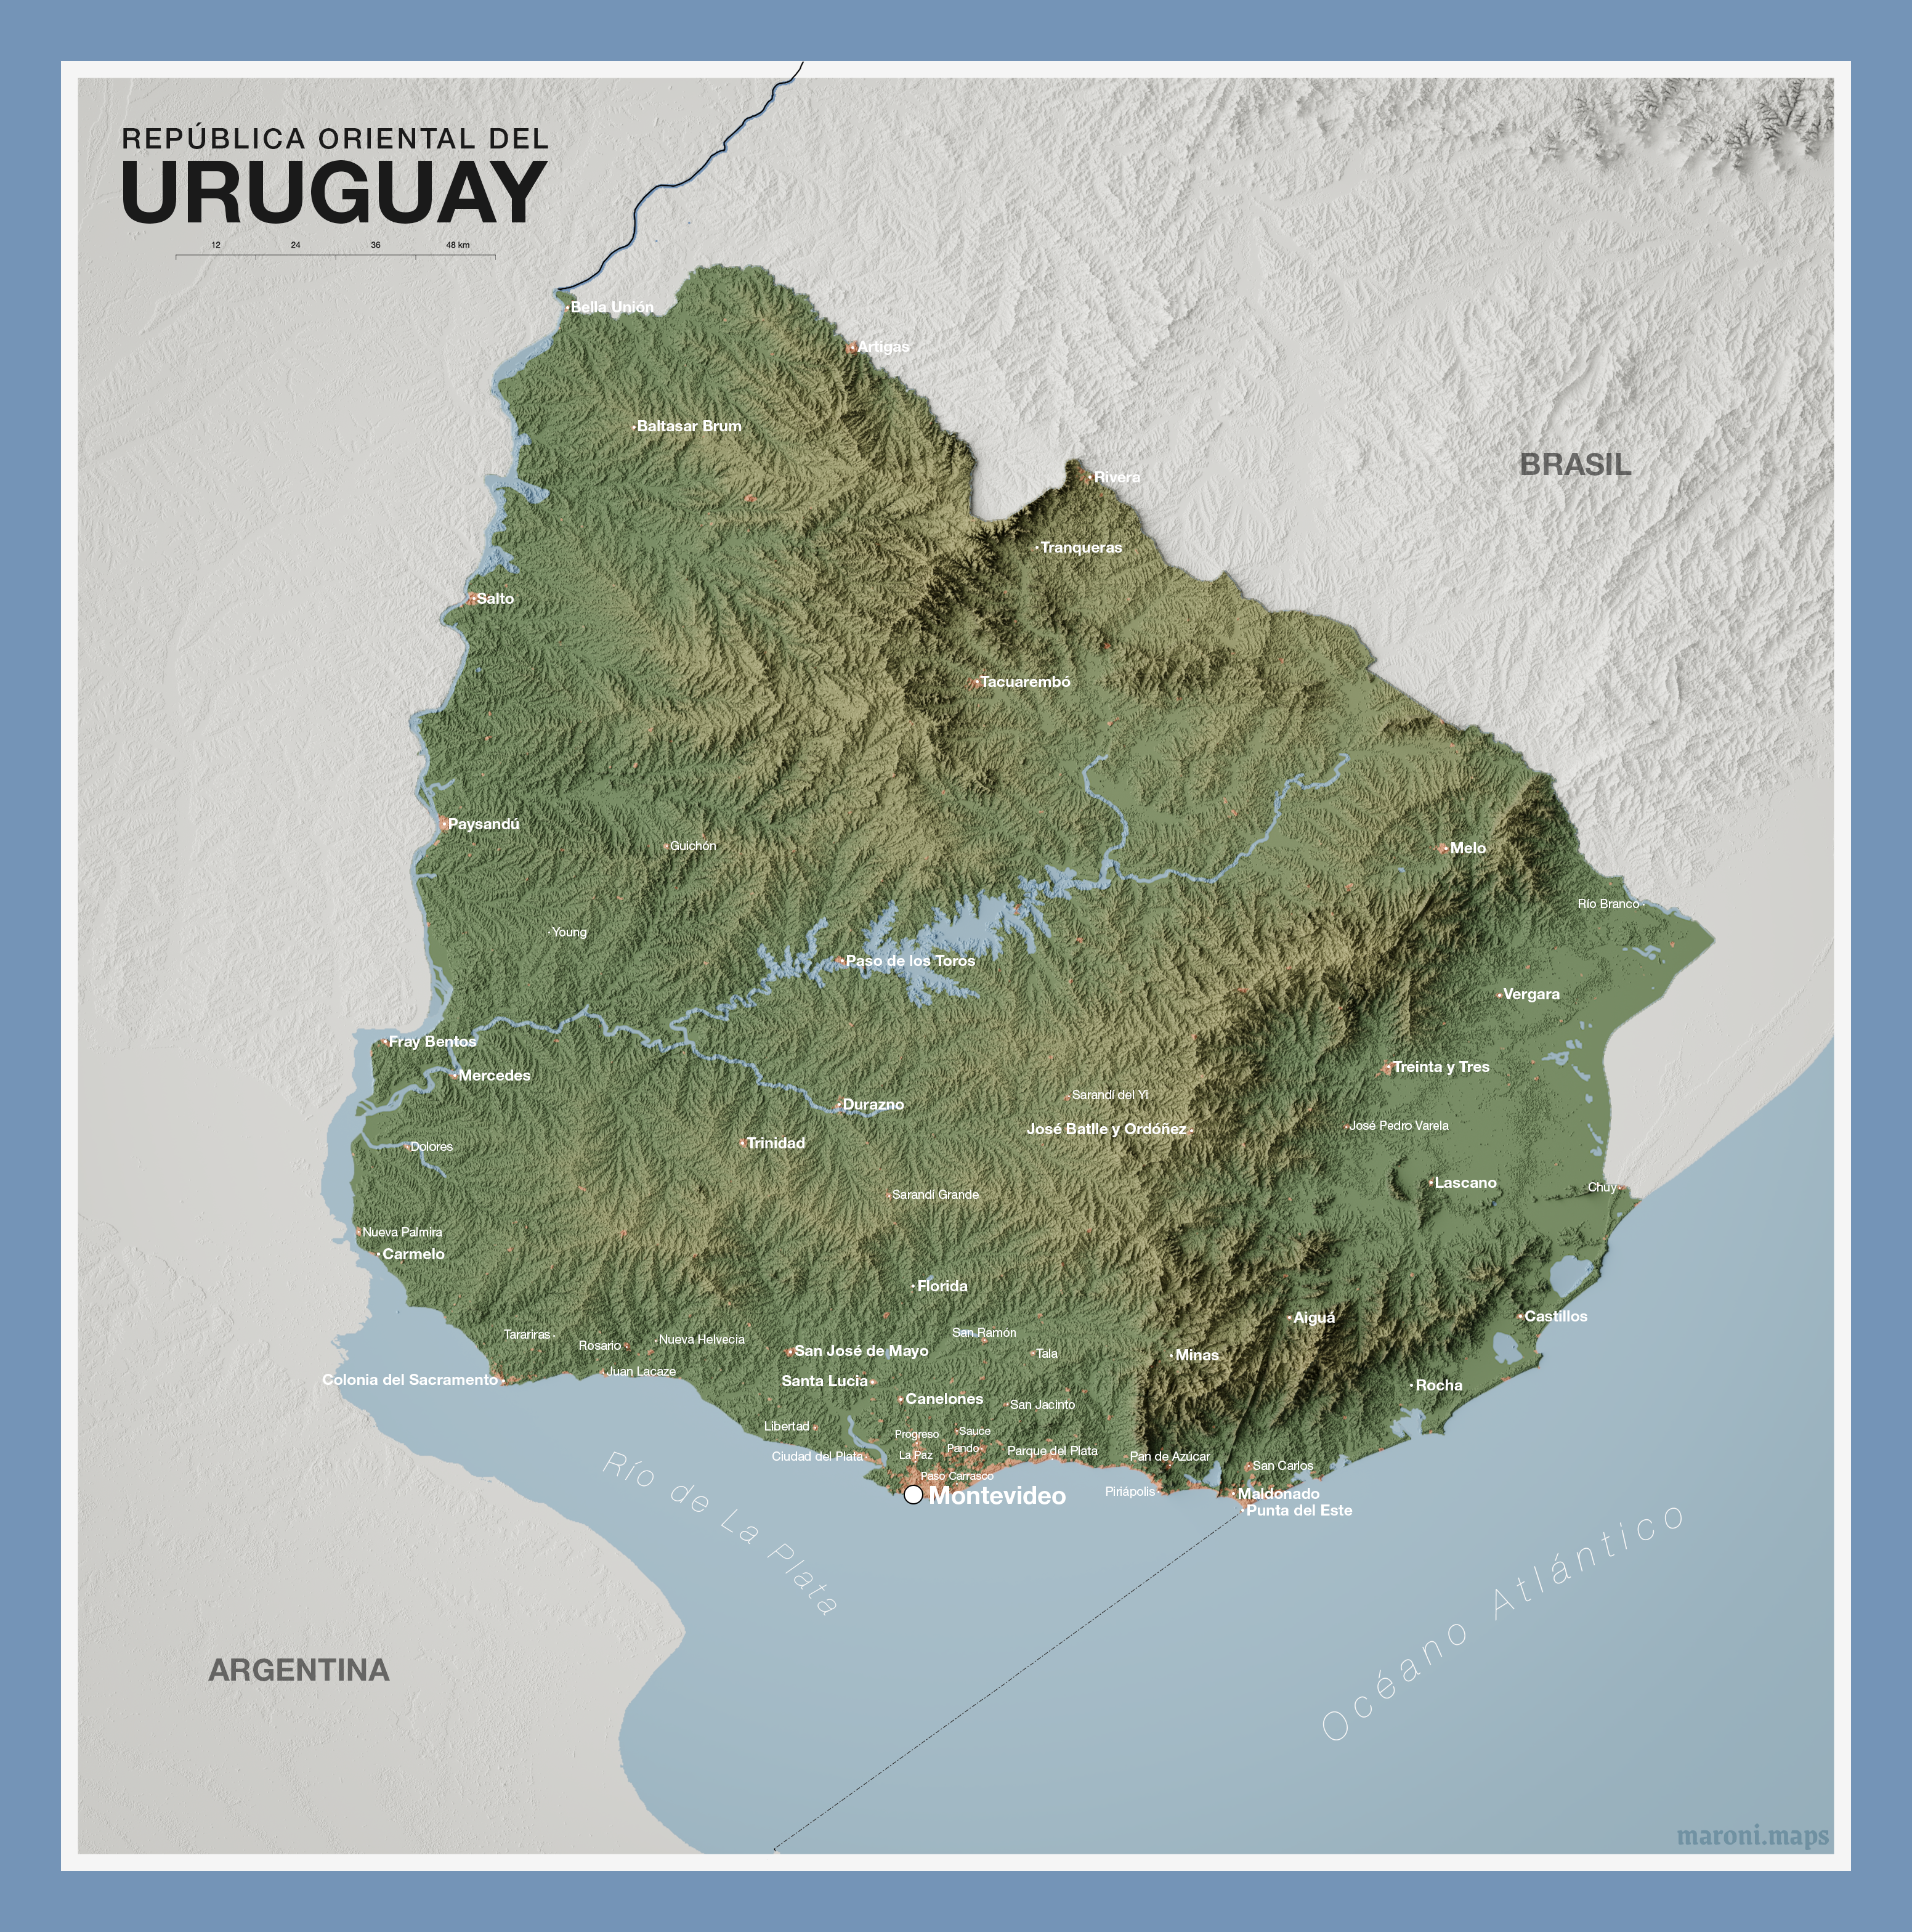
Relief Map of Uruguay
This relief map of Uruguay provides a striking visual representation of the country's topography, highlighting its varie...
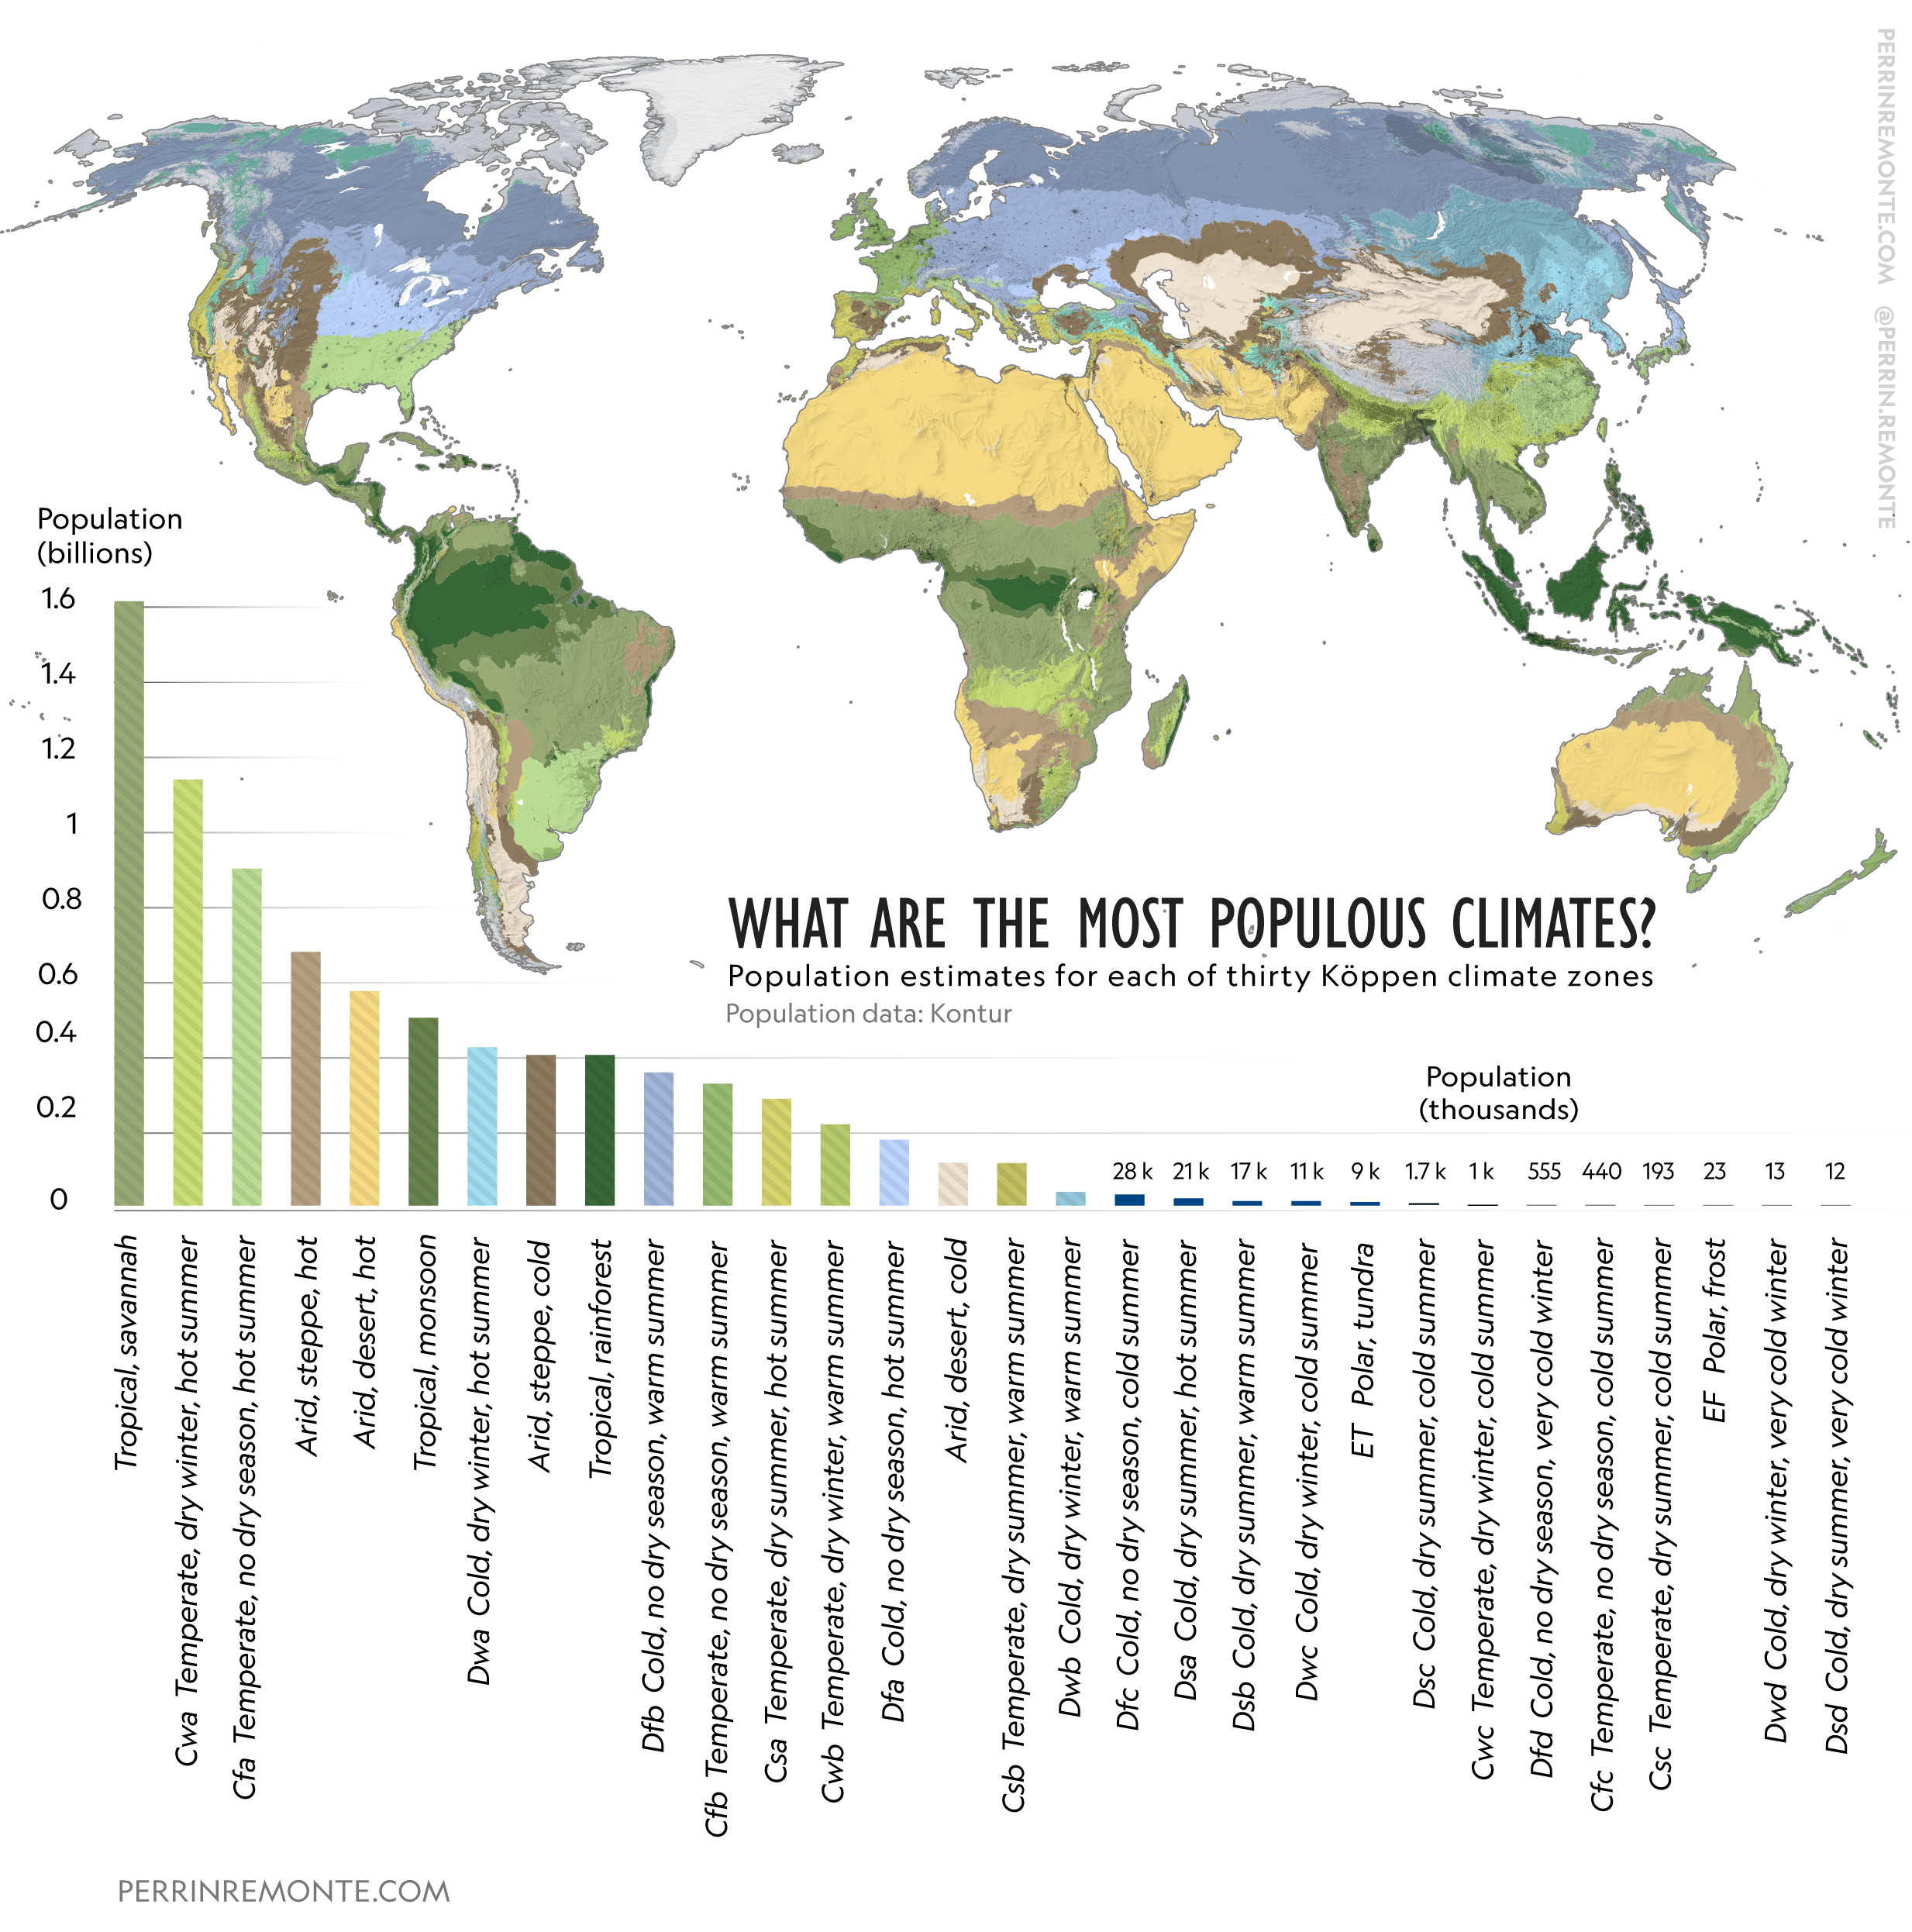
Map of Most Populous Climates
This visualization presents a fascinating overview of the world's most populous climates, illustrating how different cli...
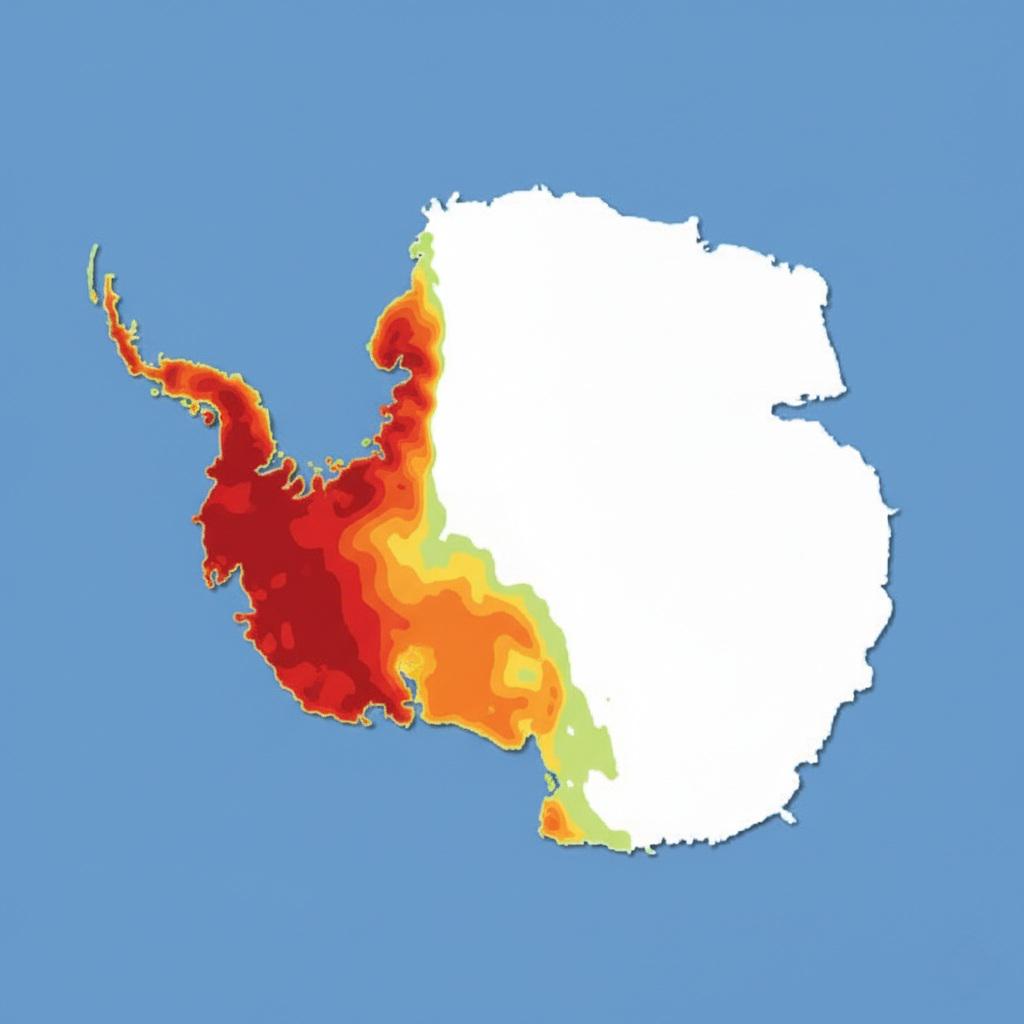
Map of Most Visited Areas of Antarctica
This map visualizes the most visited areas of Antarctica on an annual basis, highlighting the regions that attract the m...
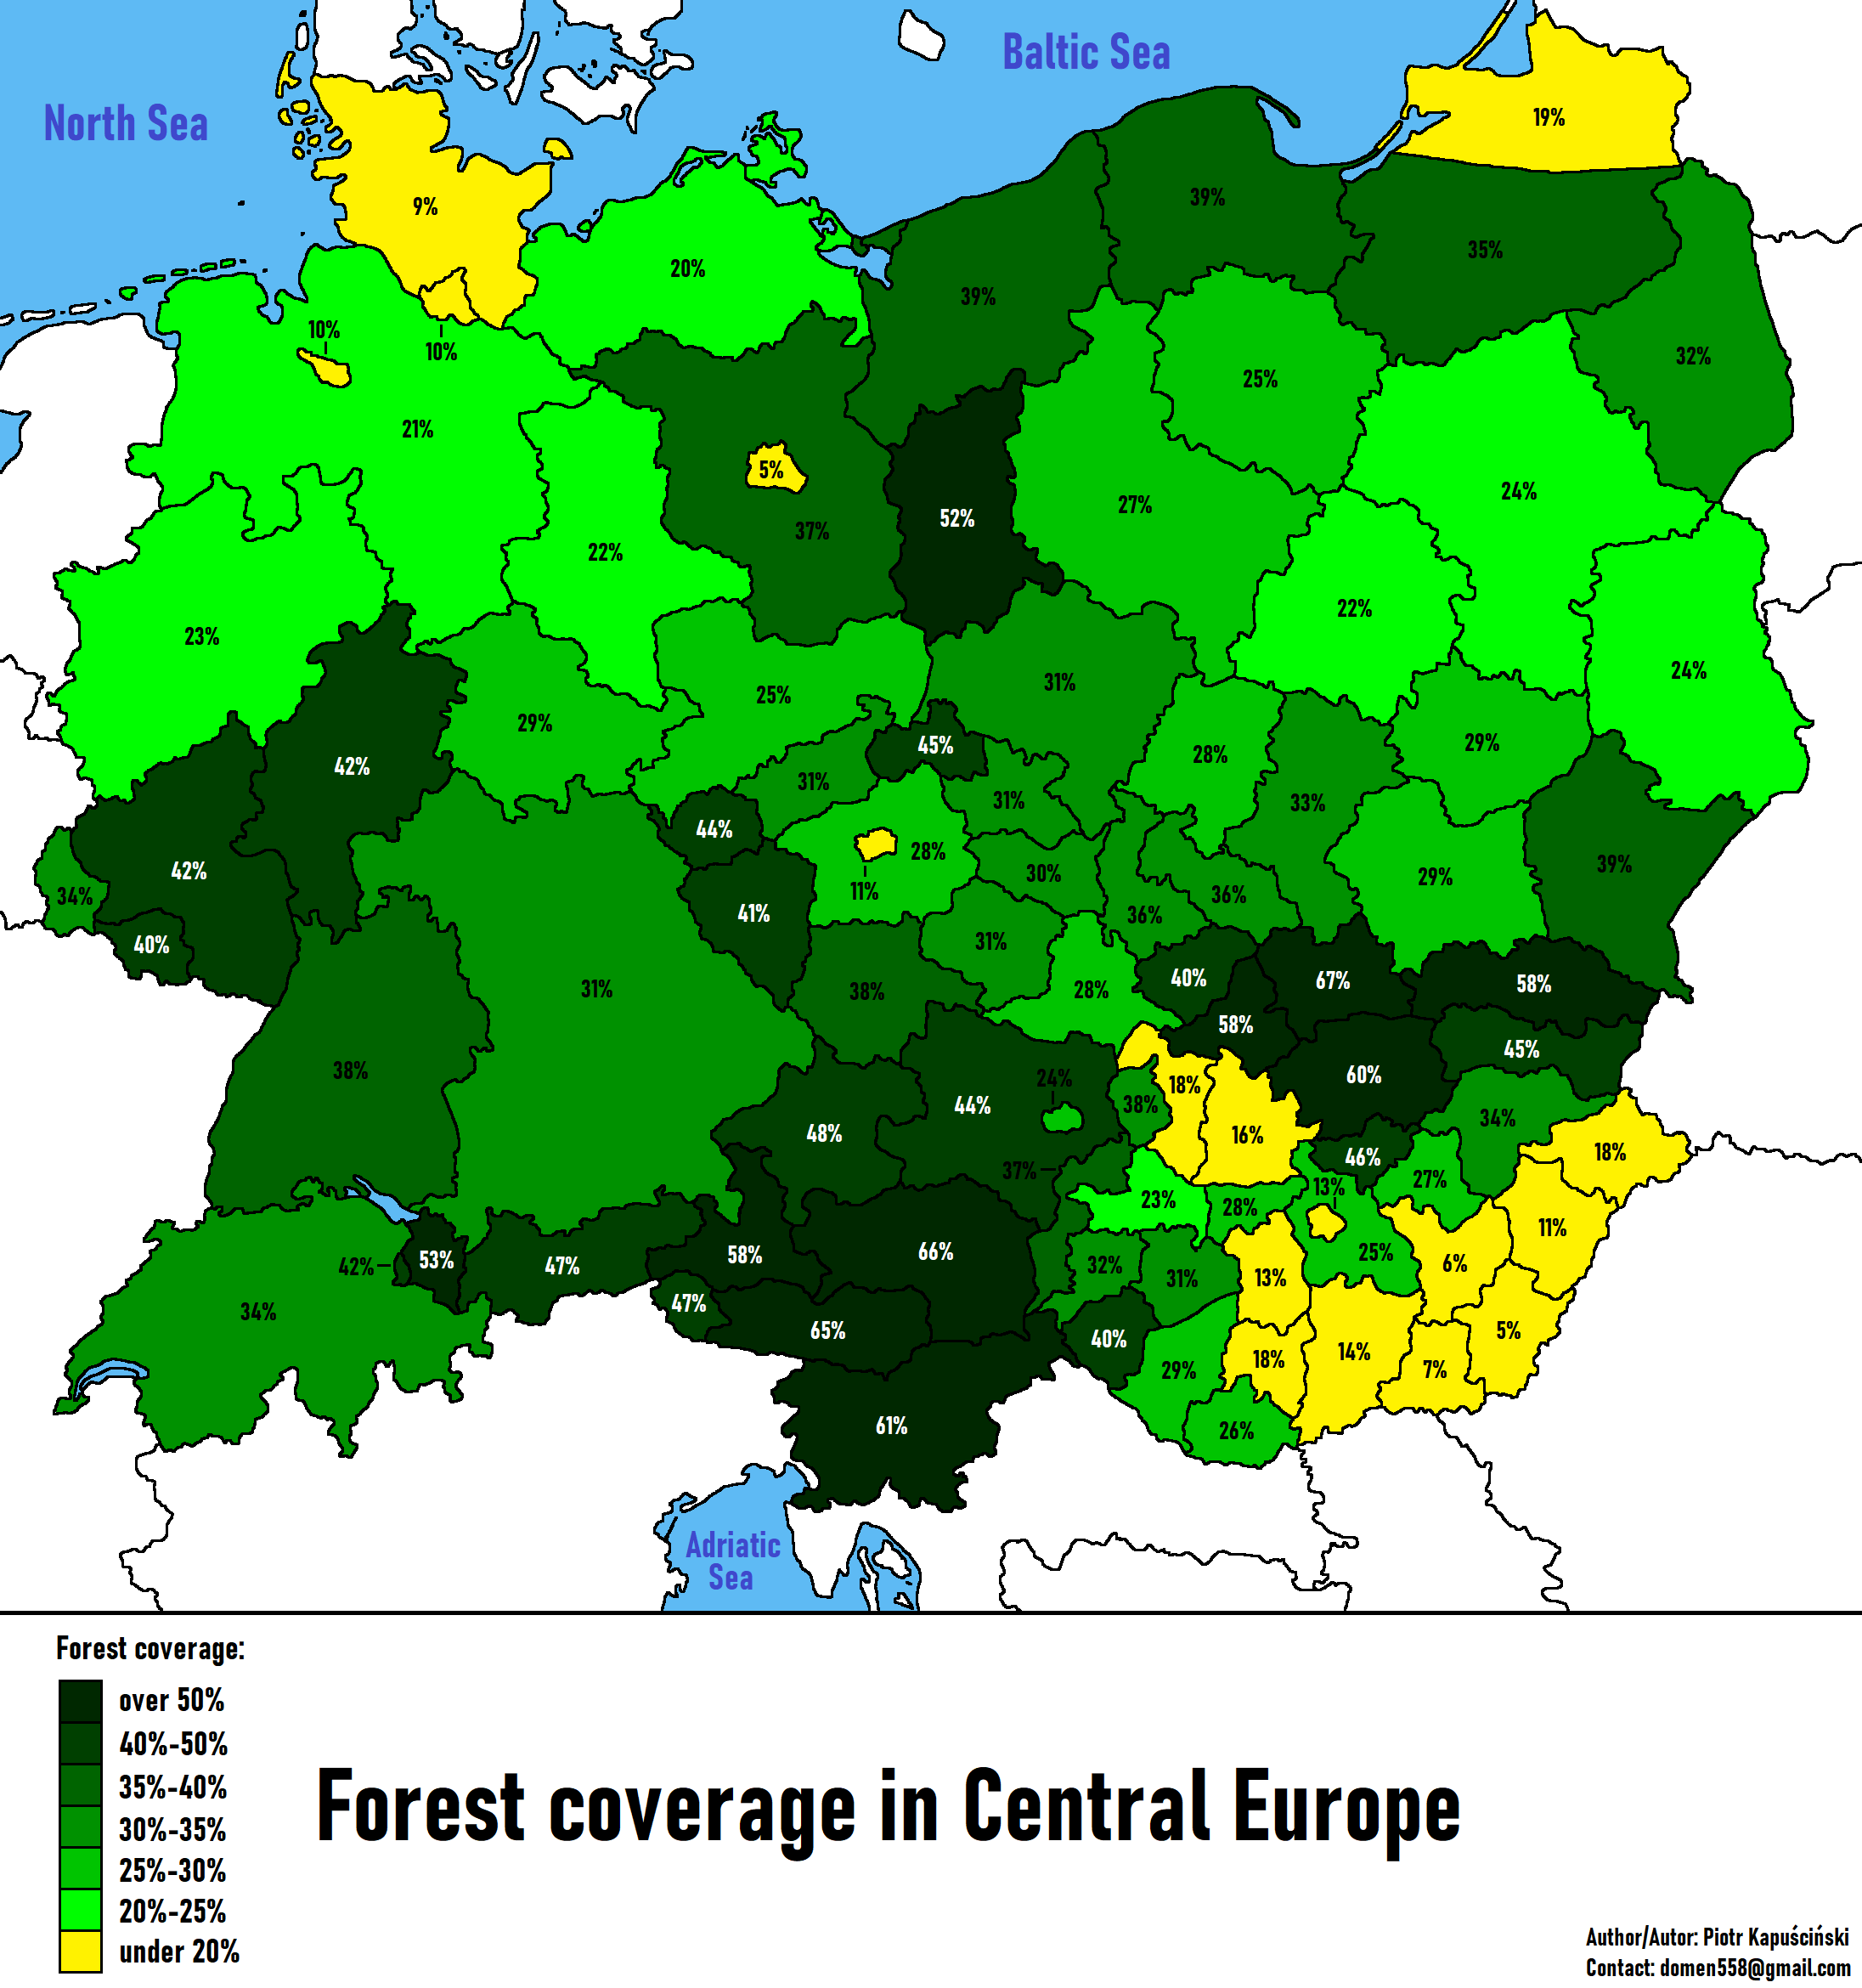
Forest Coverage in Central Europe Map
The "Forest Coverage in Central Europe Map" provides a comprehensive overview of the forested areas across several key c...
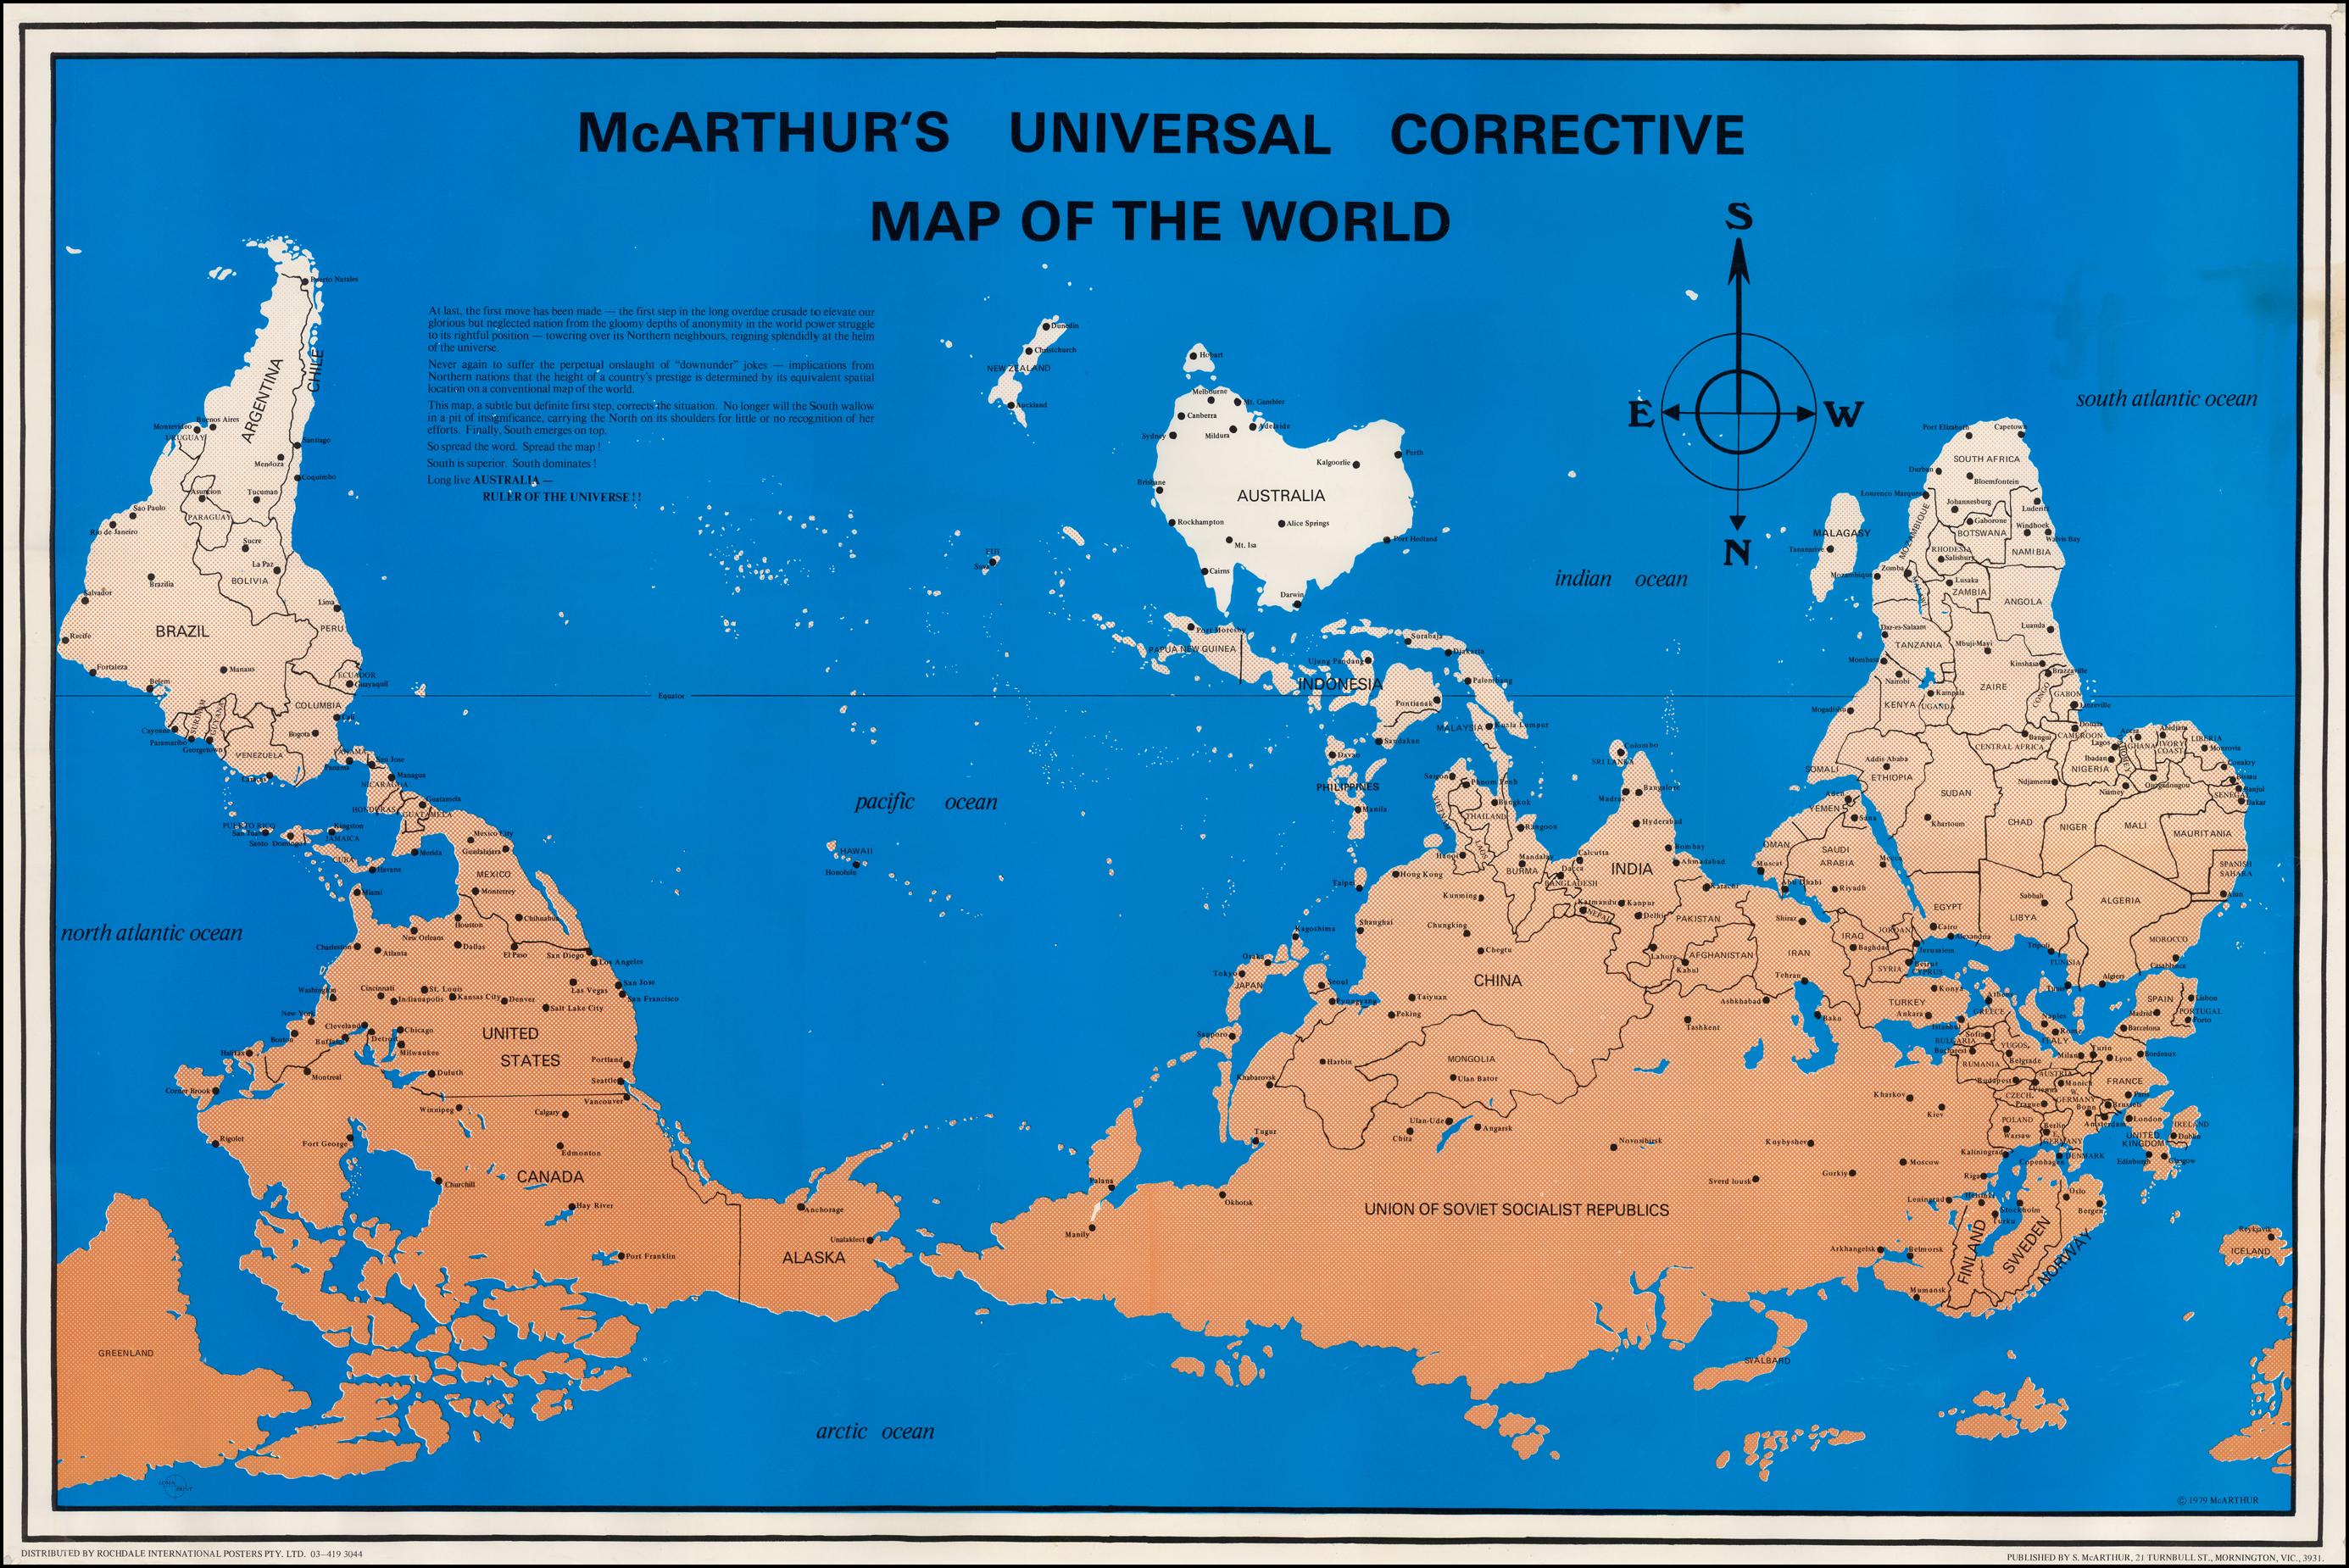
Modern Corrective Upside Down Map
The modern corrective upside down map is a unique visualization that turns the traditional map orientation on its head, ...