global warming Maps
14 geographic visualizations tagged with "global warming"
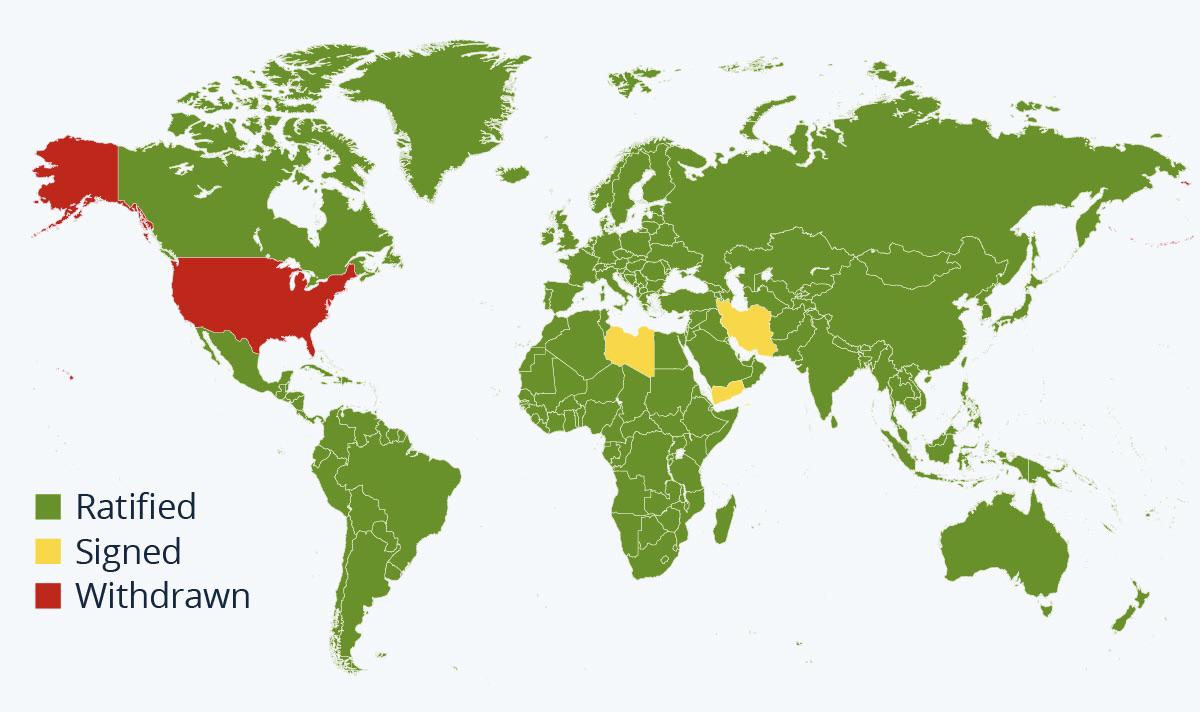
Map of Countries in the Paris Agreement
The visualization titled "A Map Of Every Country That Is In The Paris Agreement" succinctly illustrates the global commi...
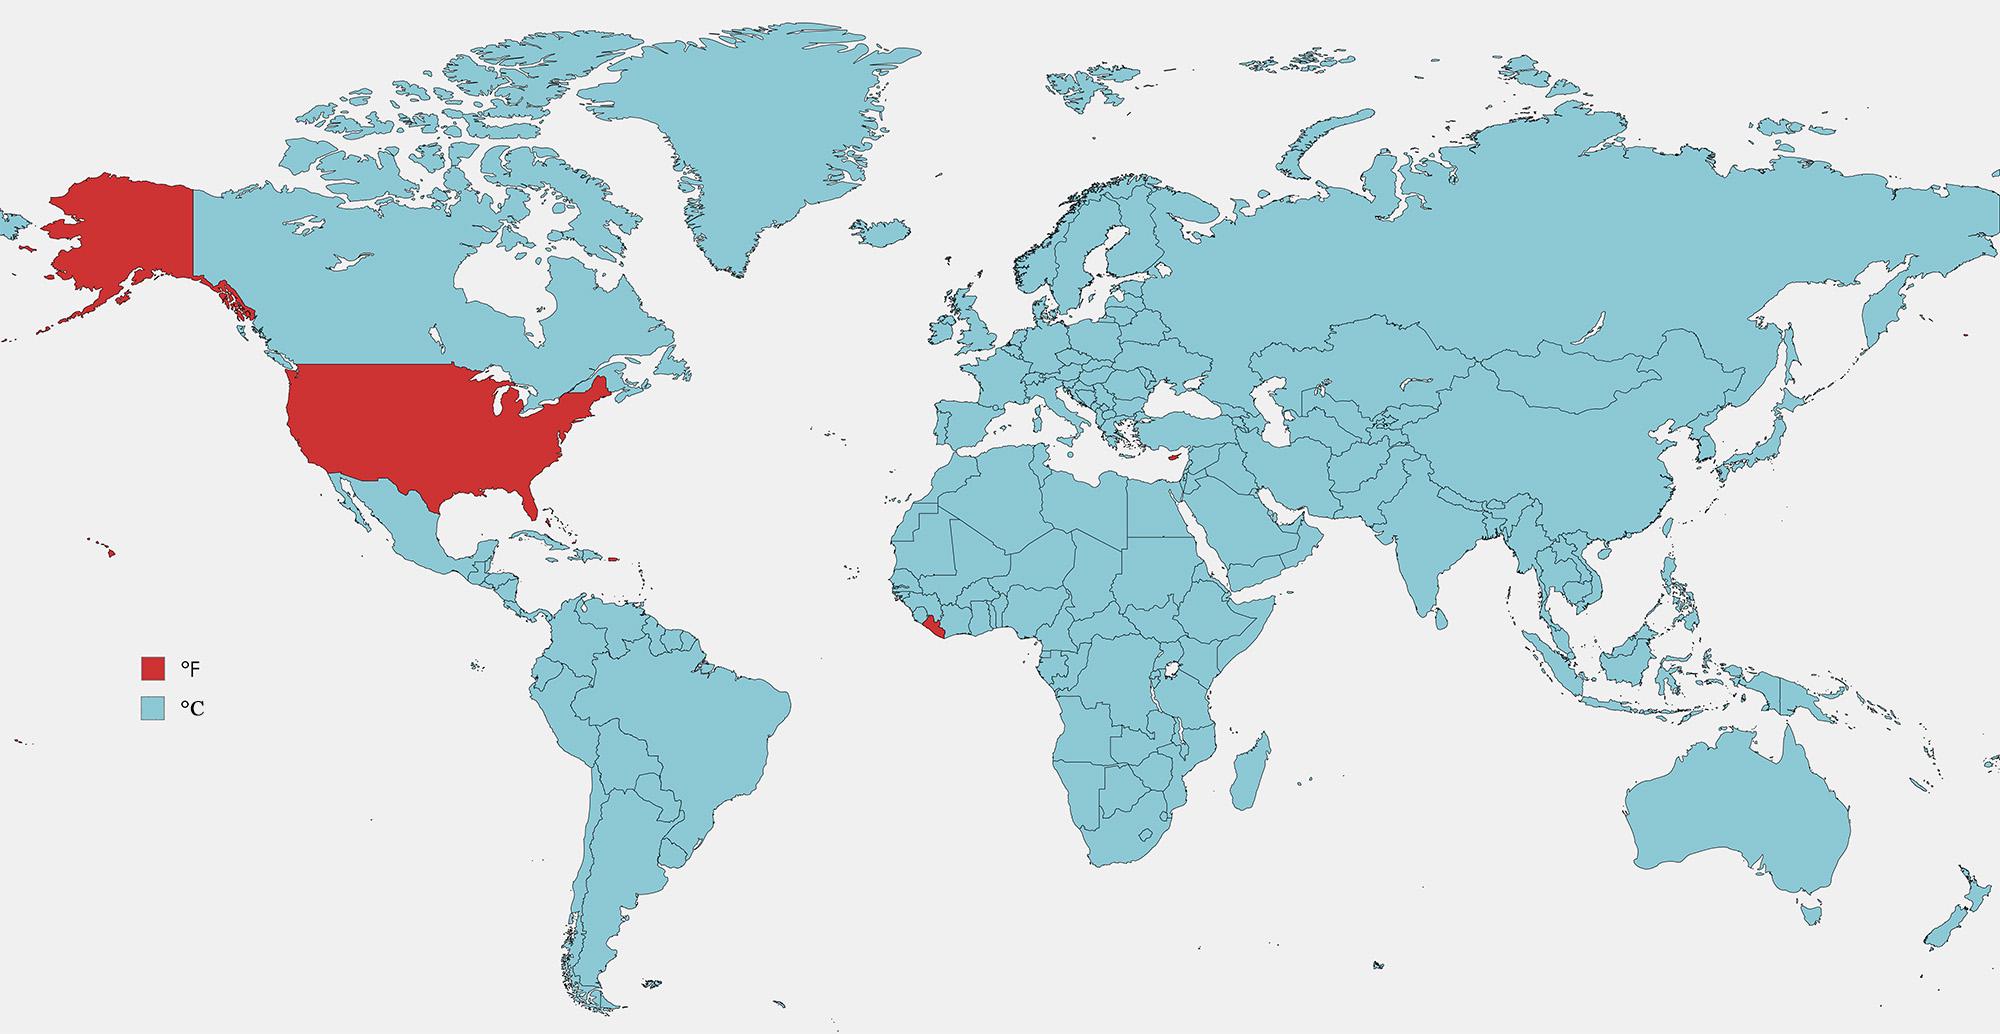
Fahrenheit vs Celsius Usage Map by Country
The visualization titled "Countries that Use Fahrenheit vs Celsius" provides a clear depiction of the global temperature...
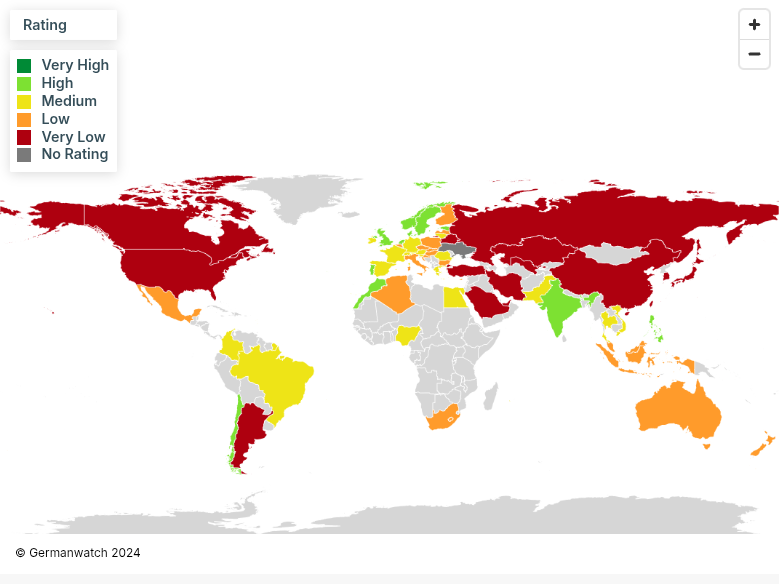
Climate Change Performance Index 2025 Map
The Climate Change Performance Index (CCPI) 2025 Map visualizes the performance of countries in combating climate change...
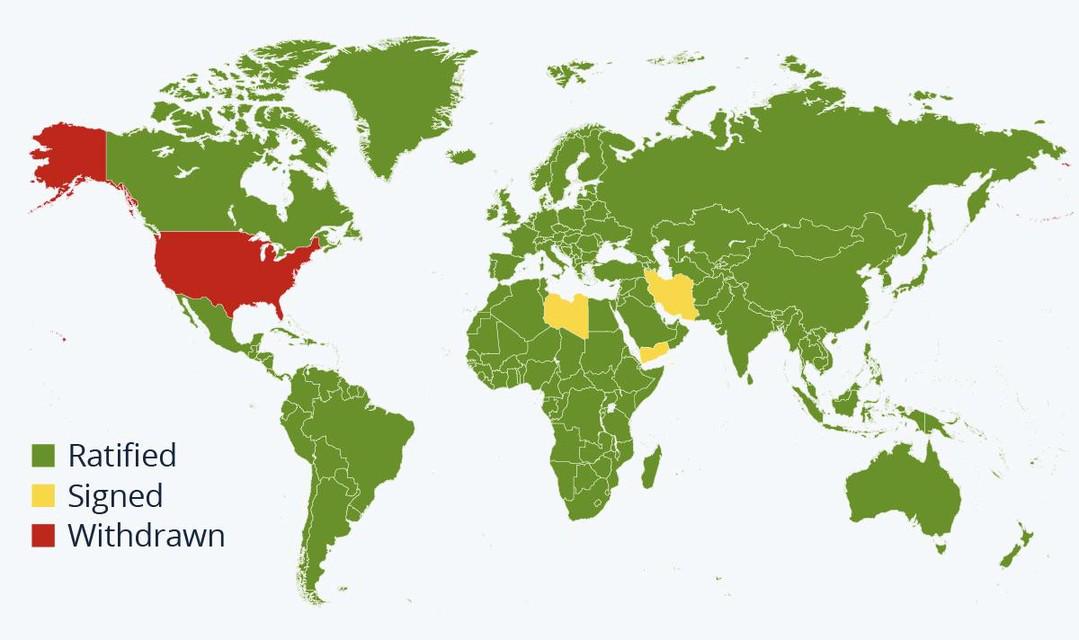
Paris Agreement Participation Status Map
This map provides a visual representation of countries that have ratified, signed, or withdrawn from the Paris Agreement...
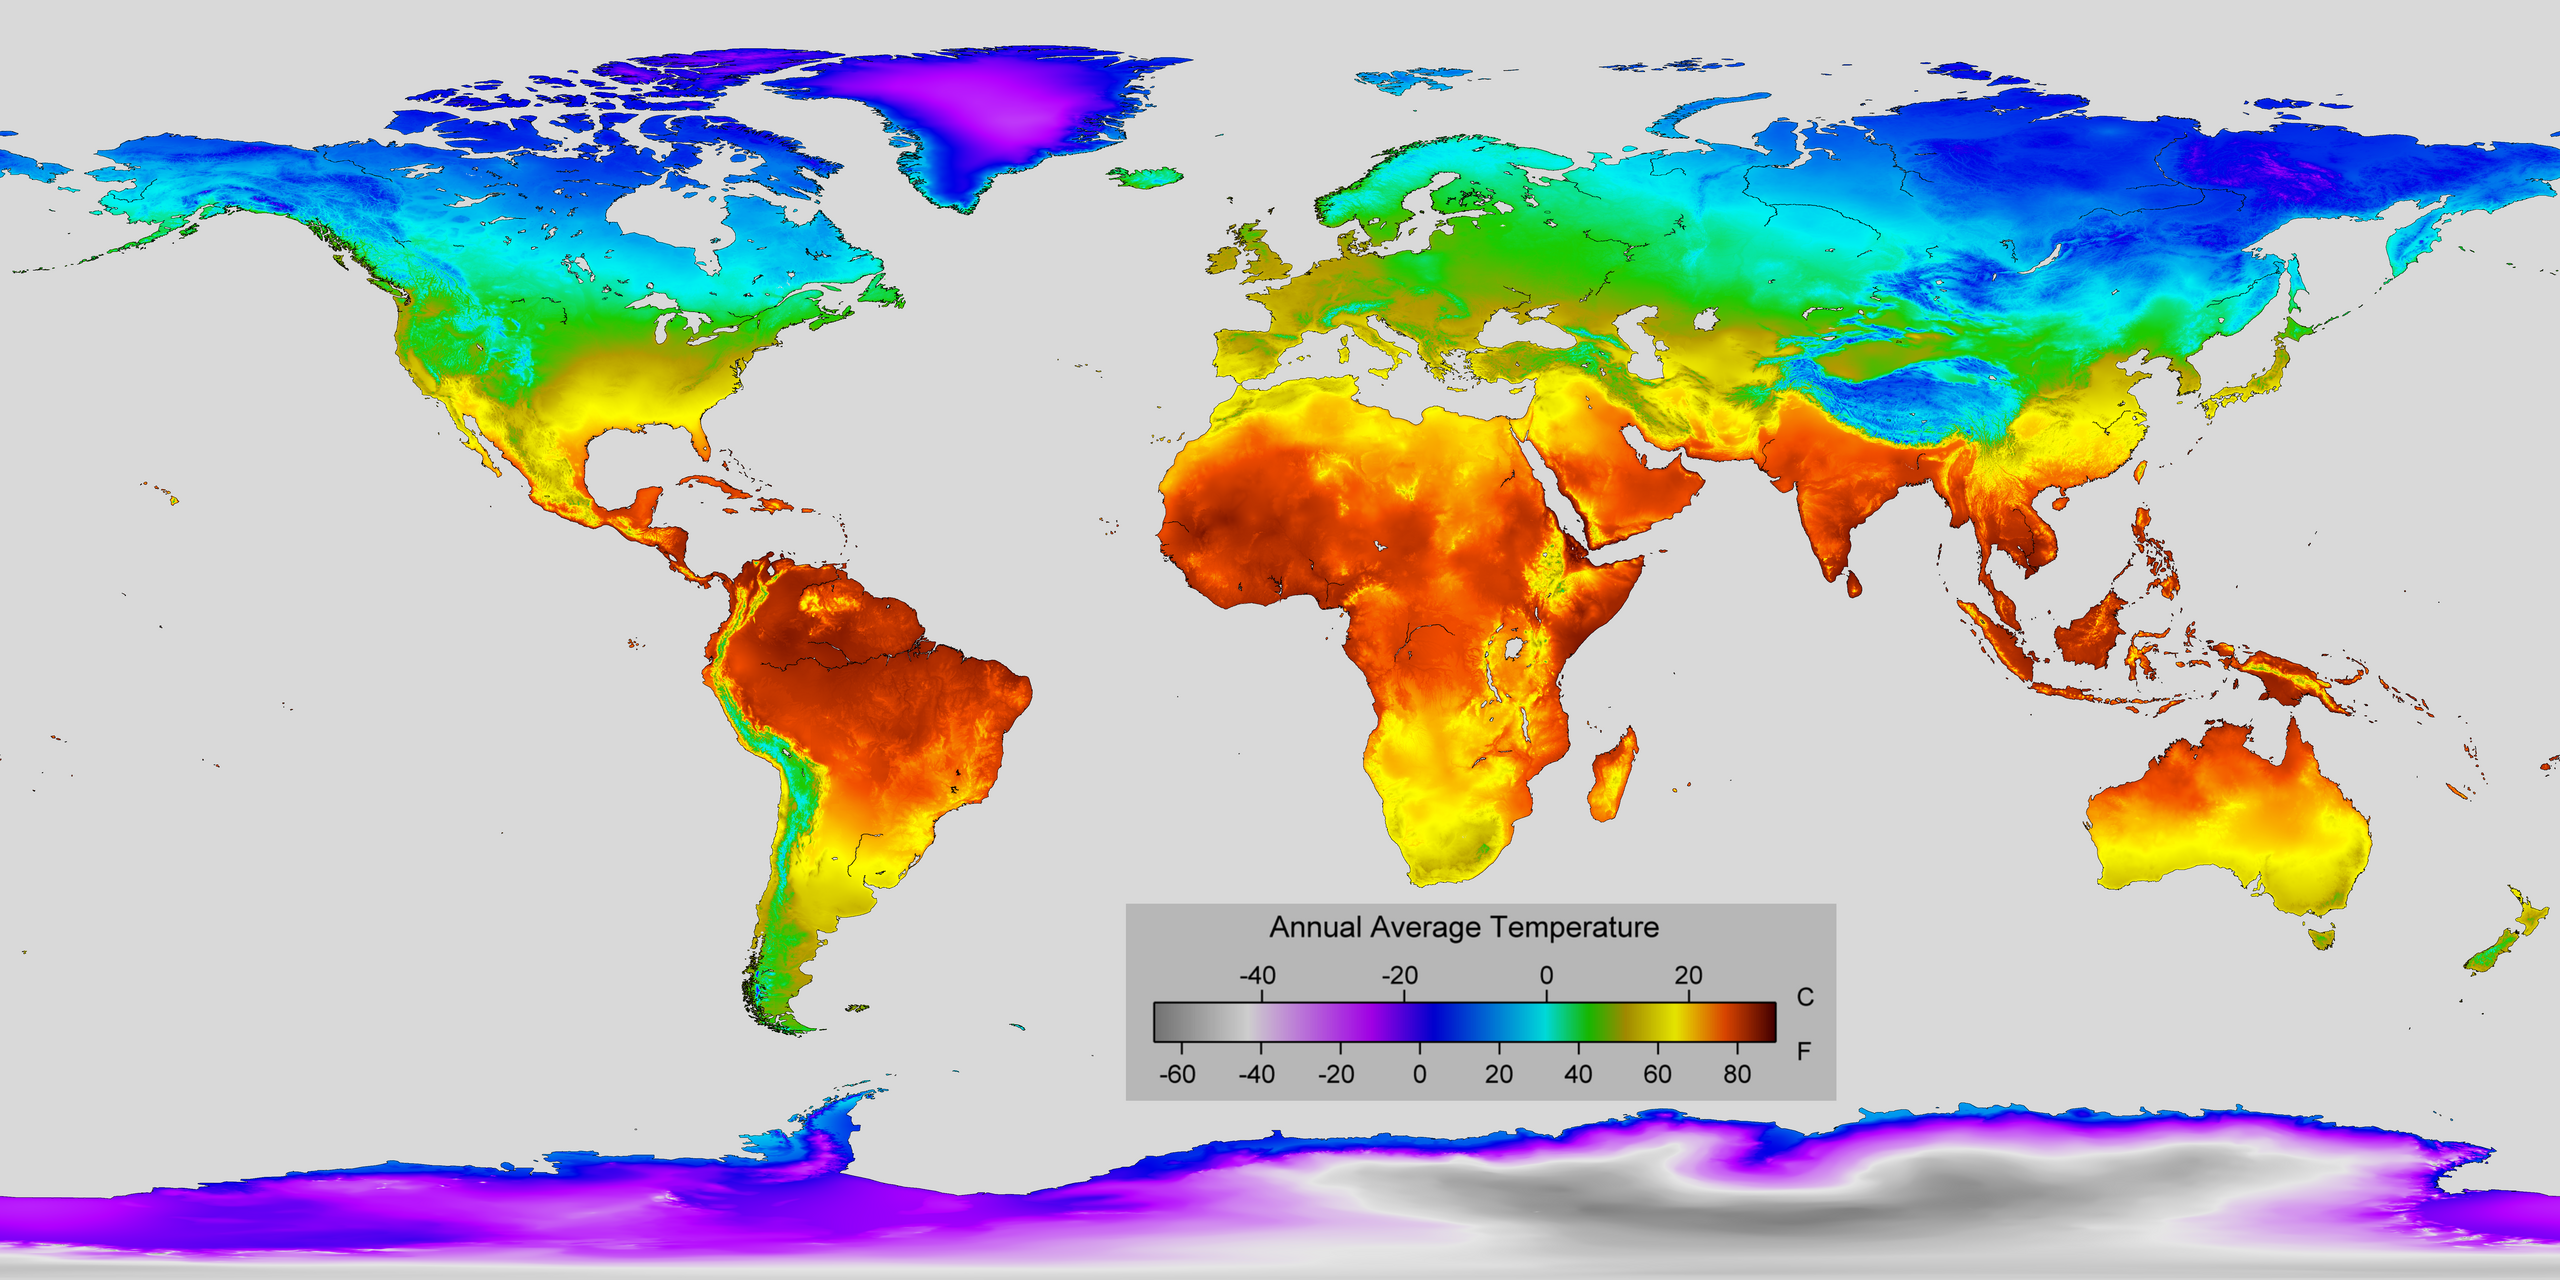
Average Annual Temperature World Map
The "Average Annual Temperature World Map" provides a comprehensive visual representation of temperature variations acro...
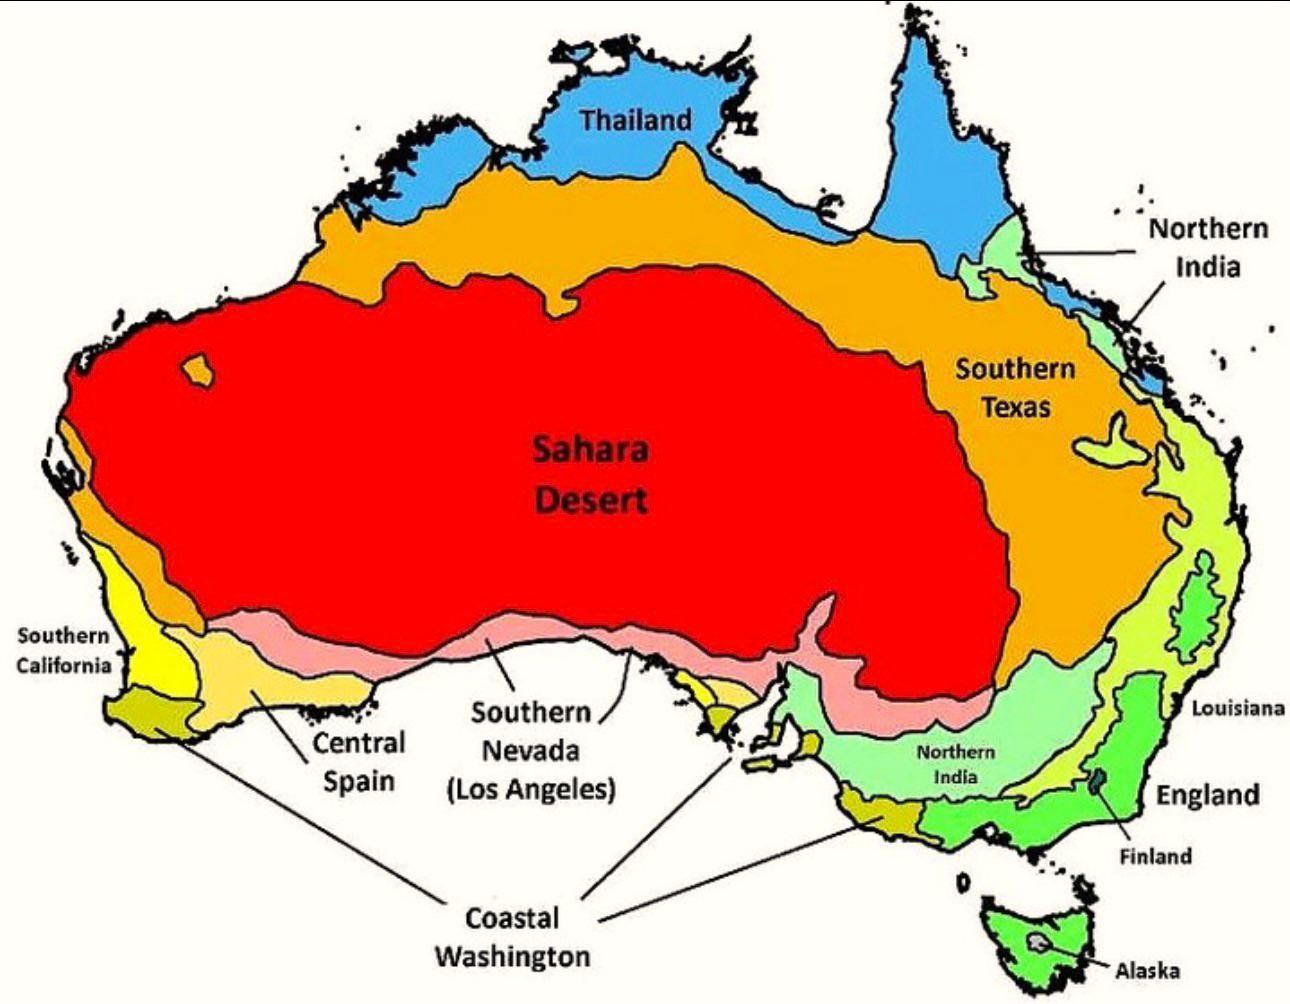
Australia’s Climate Compared to Other Countries Map
The map titled "Australia’s Climate Compared to Other Countries" provides a detailed look at how Australia's climate sta...
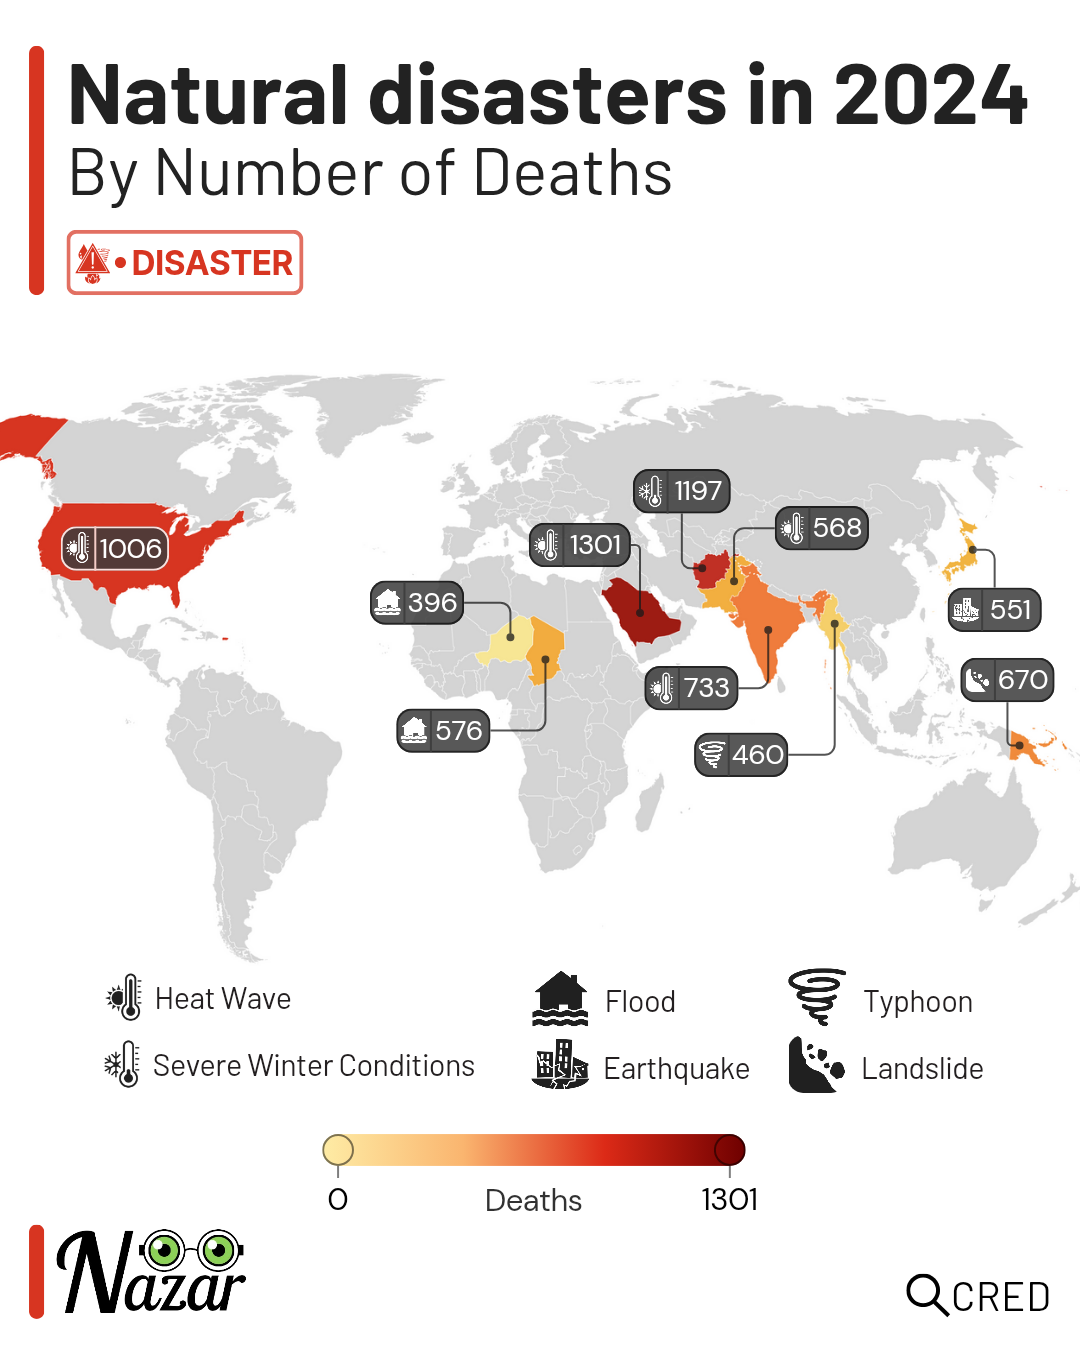
Natural Disasters in 2024 Map
The "Natural Disasters in 2024 Map" provides a stark visualization of the human toll inflicted by various natural disast...
Ocean Currents Map of Earth
The "Ocean Currents Map of Earth" provides a detailed visualization of the major ocean currents that circulate through o...
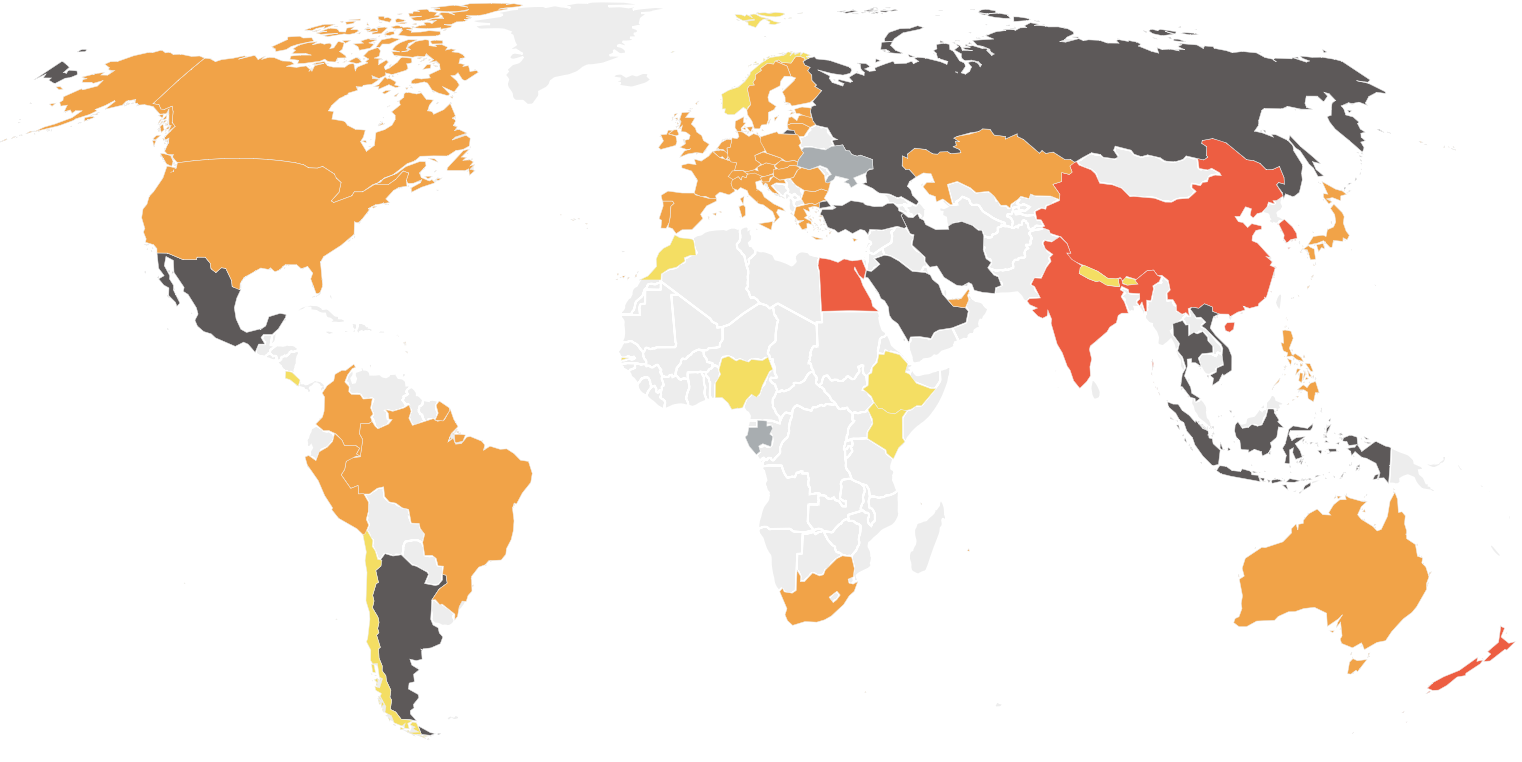
Map of Countries' Progress on Paris Agreement Goals
The "Map of Each Country's Progress on the Paris Agreement Goal to Limit Global Warming to 1.5°C" provides a stark visua...

Climate Zones Map of the World
This climate zones map of the world provides a visual representation of the various climate classifications across diffe...
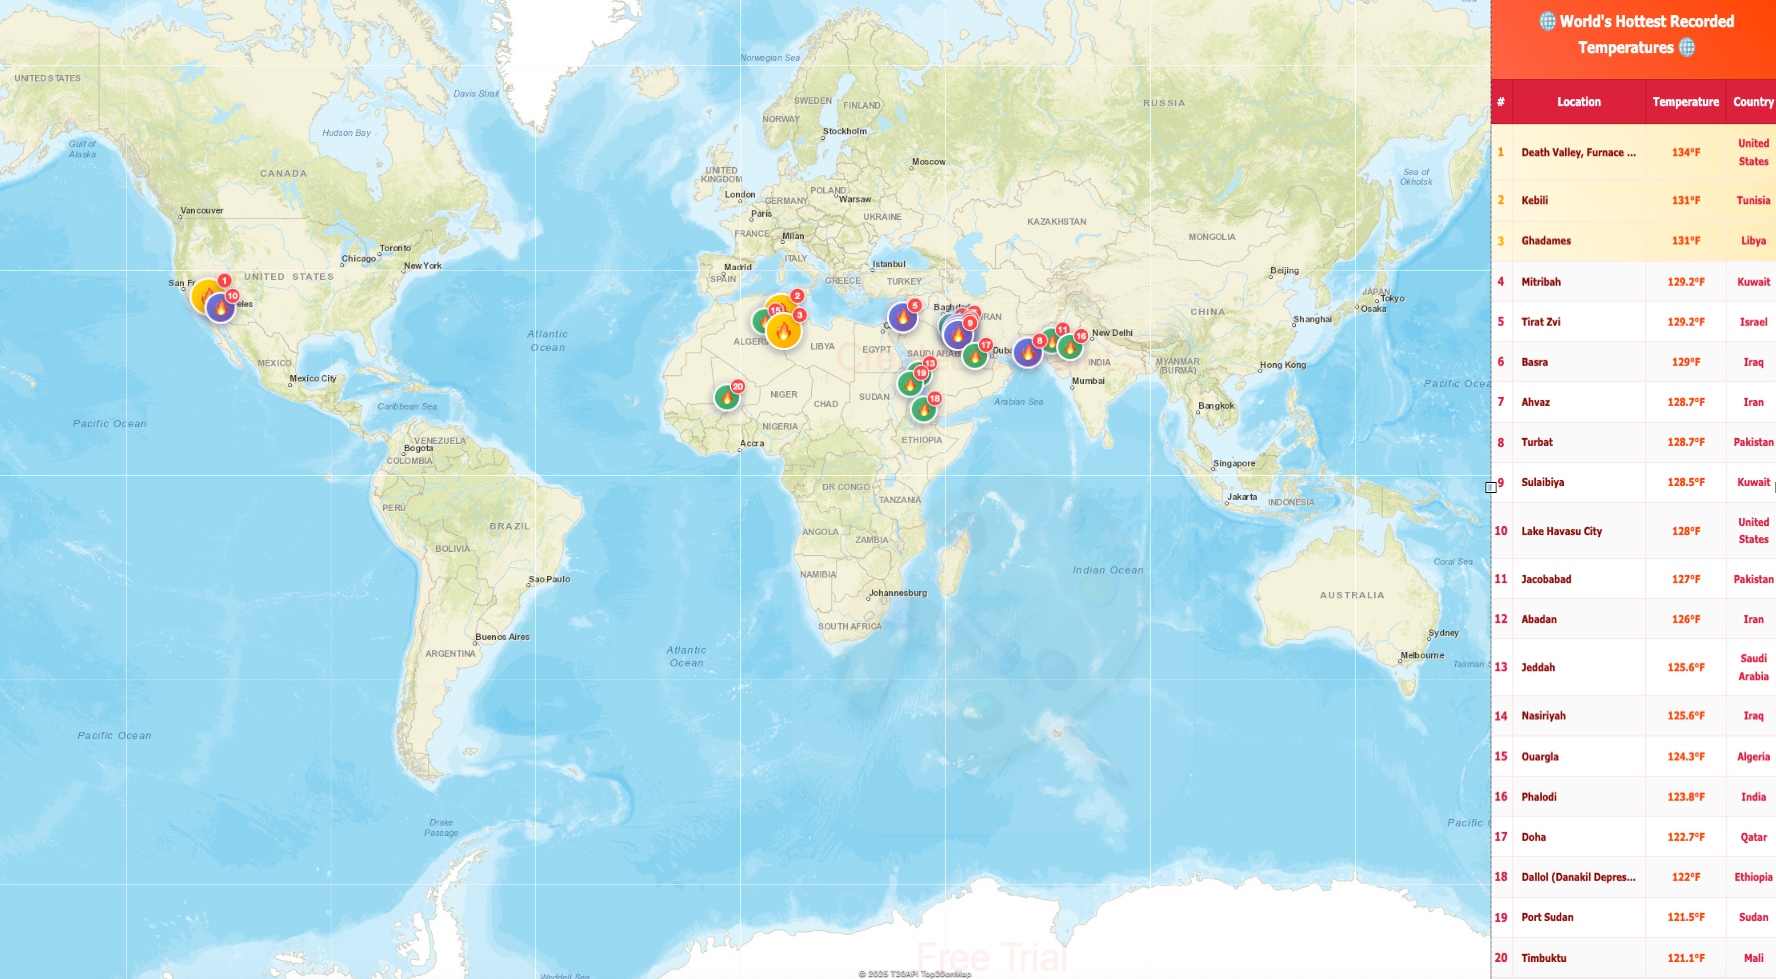
Map of World’s Hottest Recorded Locations
The visualization titled "World’s Hottest Recorded Locations" highlights the extreme temperatures recorded across the gl...
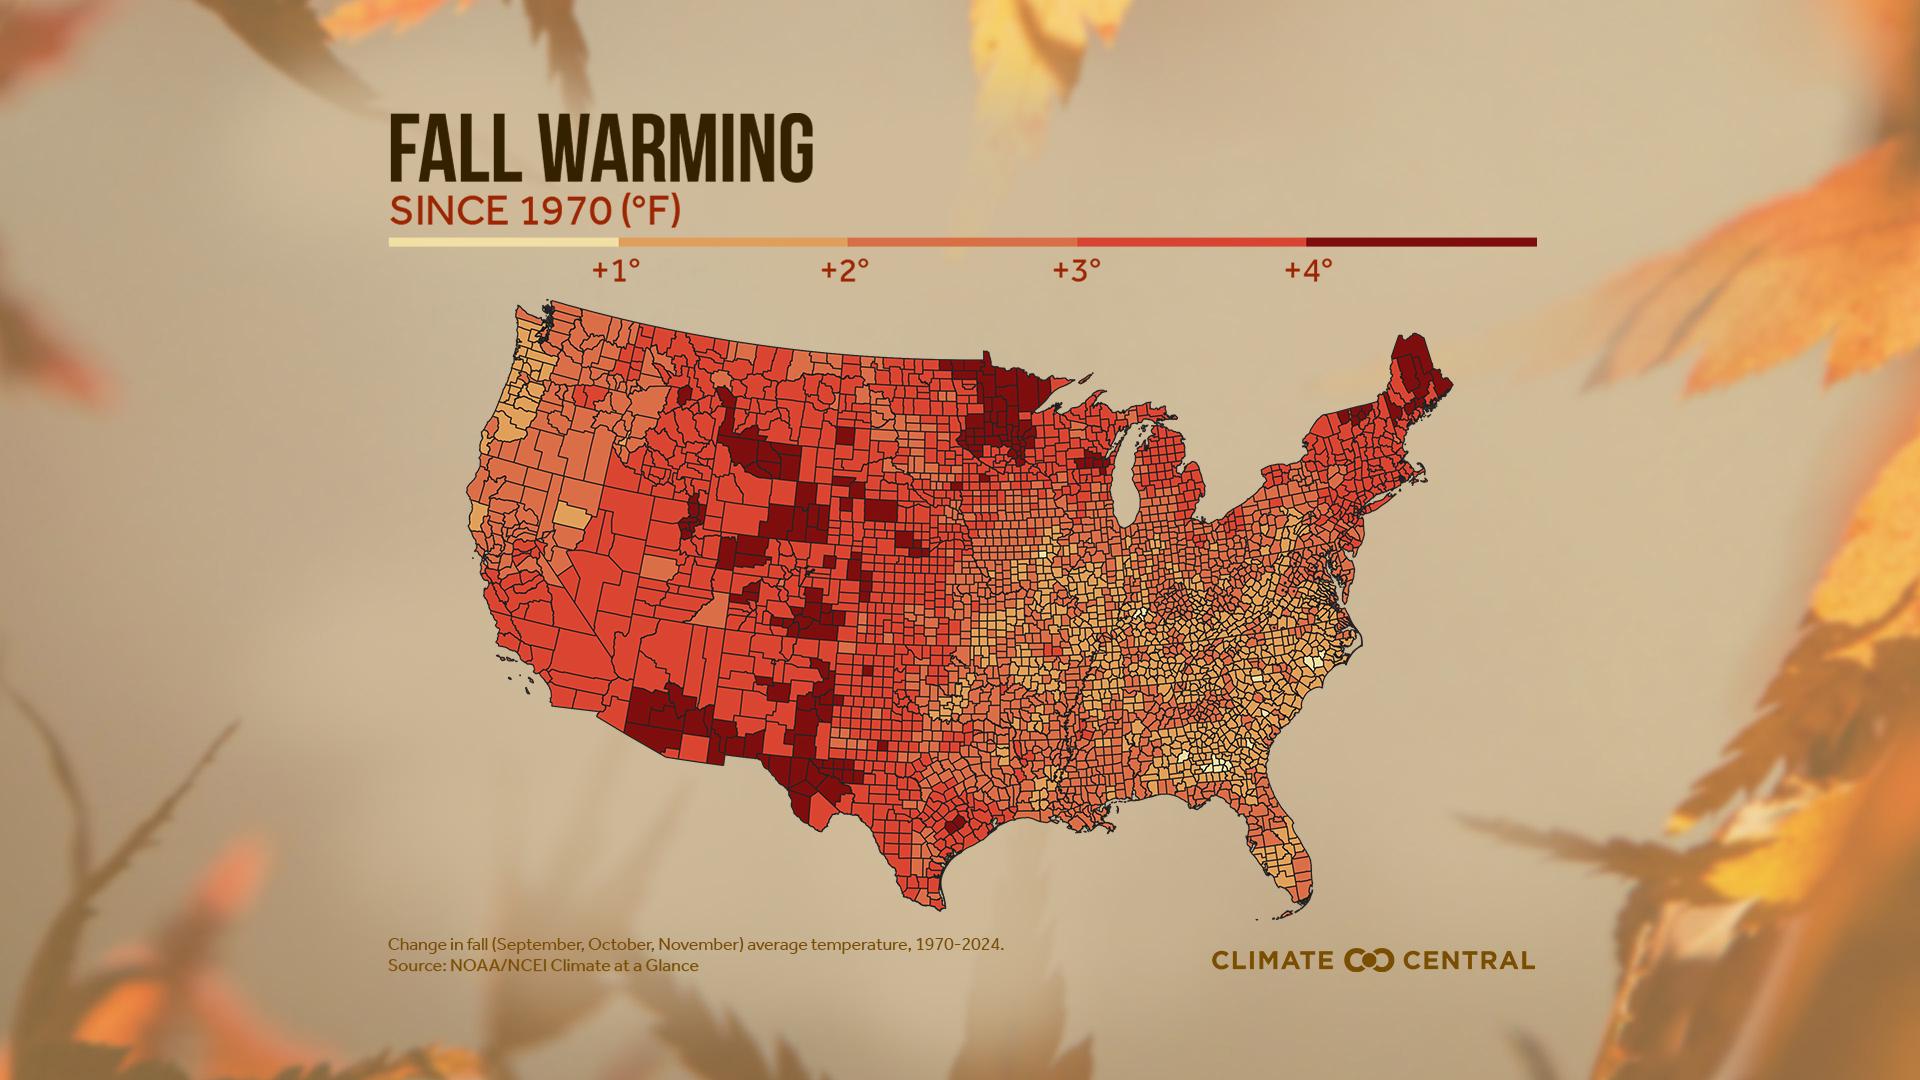
Average Fall Temperature Increase Since 1970 Map
The "Average Fall Temperature Increase Since 1970 Map" provides a visual representation of the changes in fall temperatu...
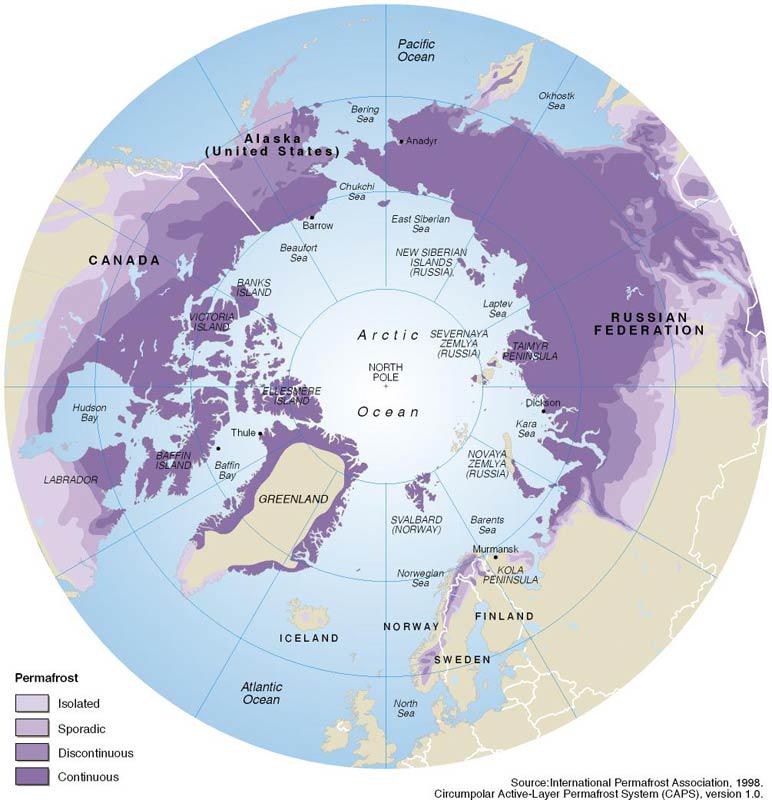
Permafrost Melting and Global Warming Map
This visualization, titled "Permafrost: A Global Warming Loop Map," illustrates the regions of the world where permafros...

Global Temperature Anomalies Map
The Global Temperature Anomalies Map vividly illustrates the deviations in temperature across the globe compared to a lo...