urban heat island Maps
4 geographic visualizations tagged with "urban heat island"

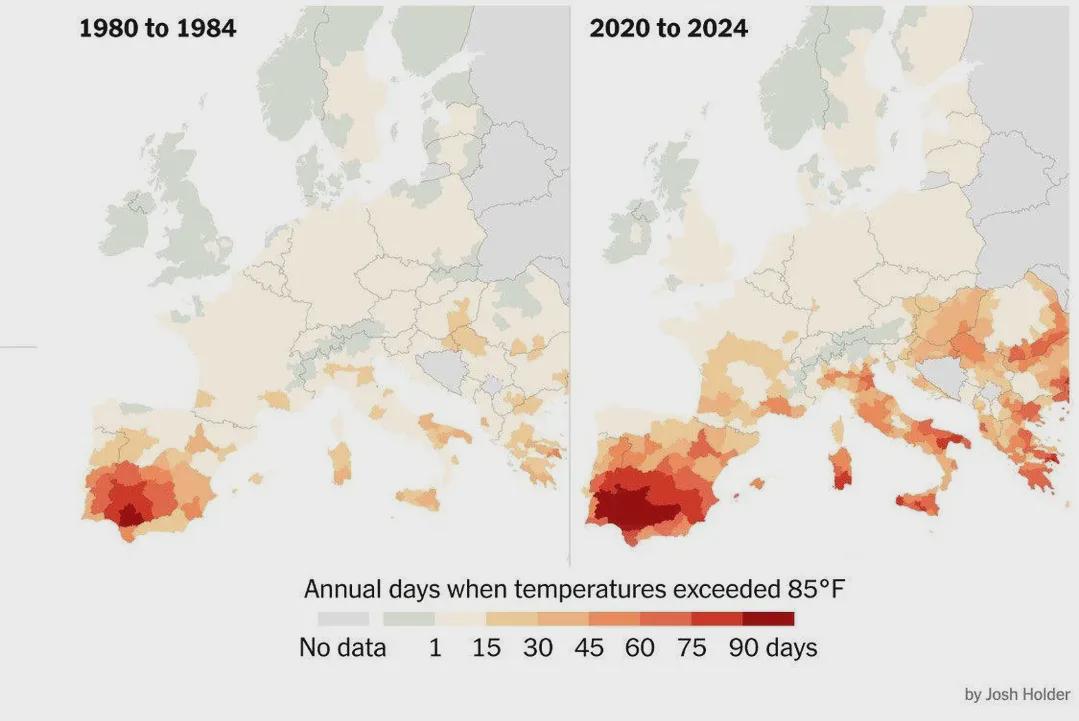
Days Over 30ºC in Europe Map
The visualization titled "Number of Days per Year When Temperatures Exceeded 30ºC (85°F) in Europe" provides a comprehen...
👁 254📅 8/14/2025

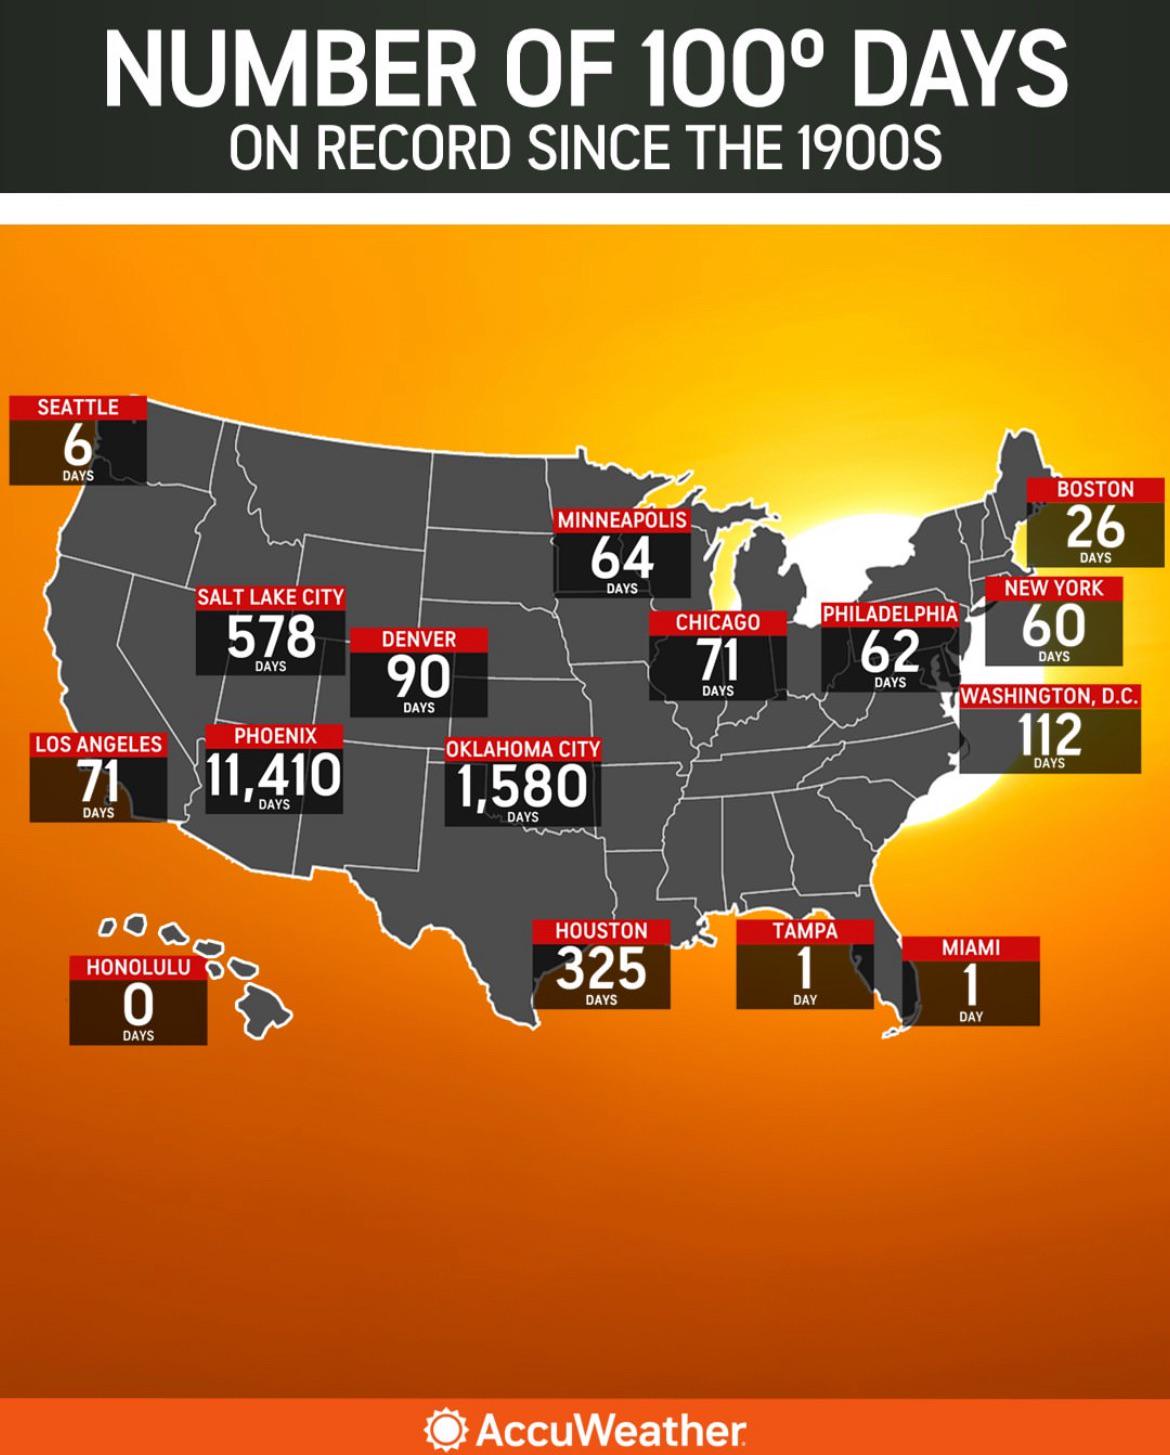
Map of 100° Days Recorded Since 1900
The map titled 'Number of 100° Days on Record Since the 1900s' visually represents the frequency of extreme heat days ac...
👁 218📅 8/21/2025

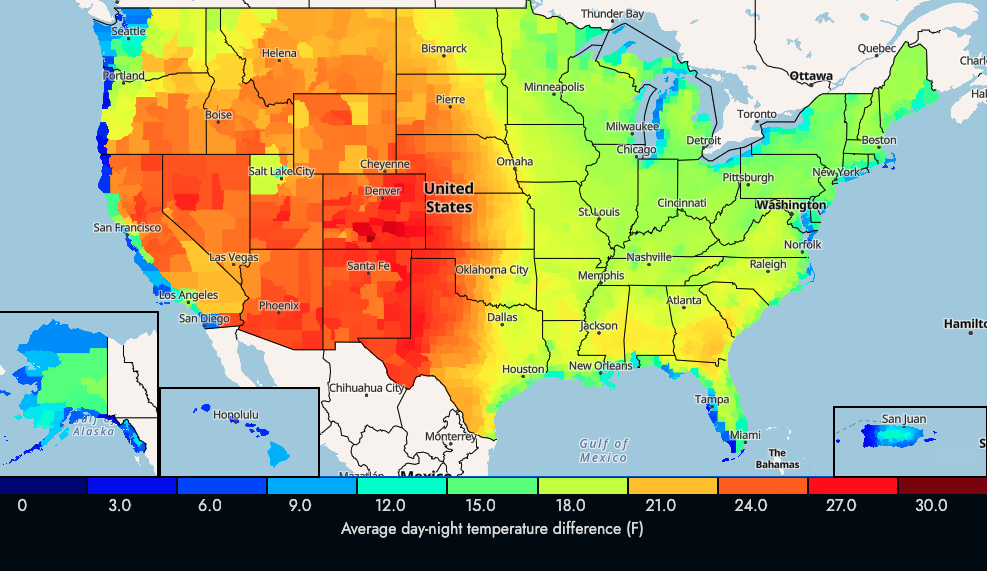
US Average Day-Night Temperature Change Map
The visualization titled "US Average Day-Night Temperature Change in F" illustrates the differences between daytime and ...
👁 52📅 9/29/2025

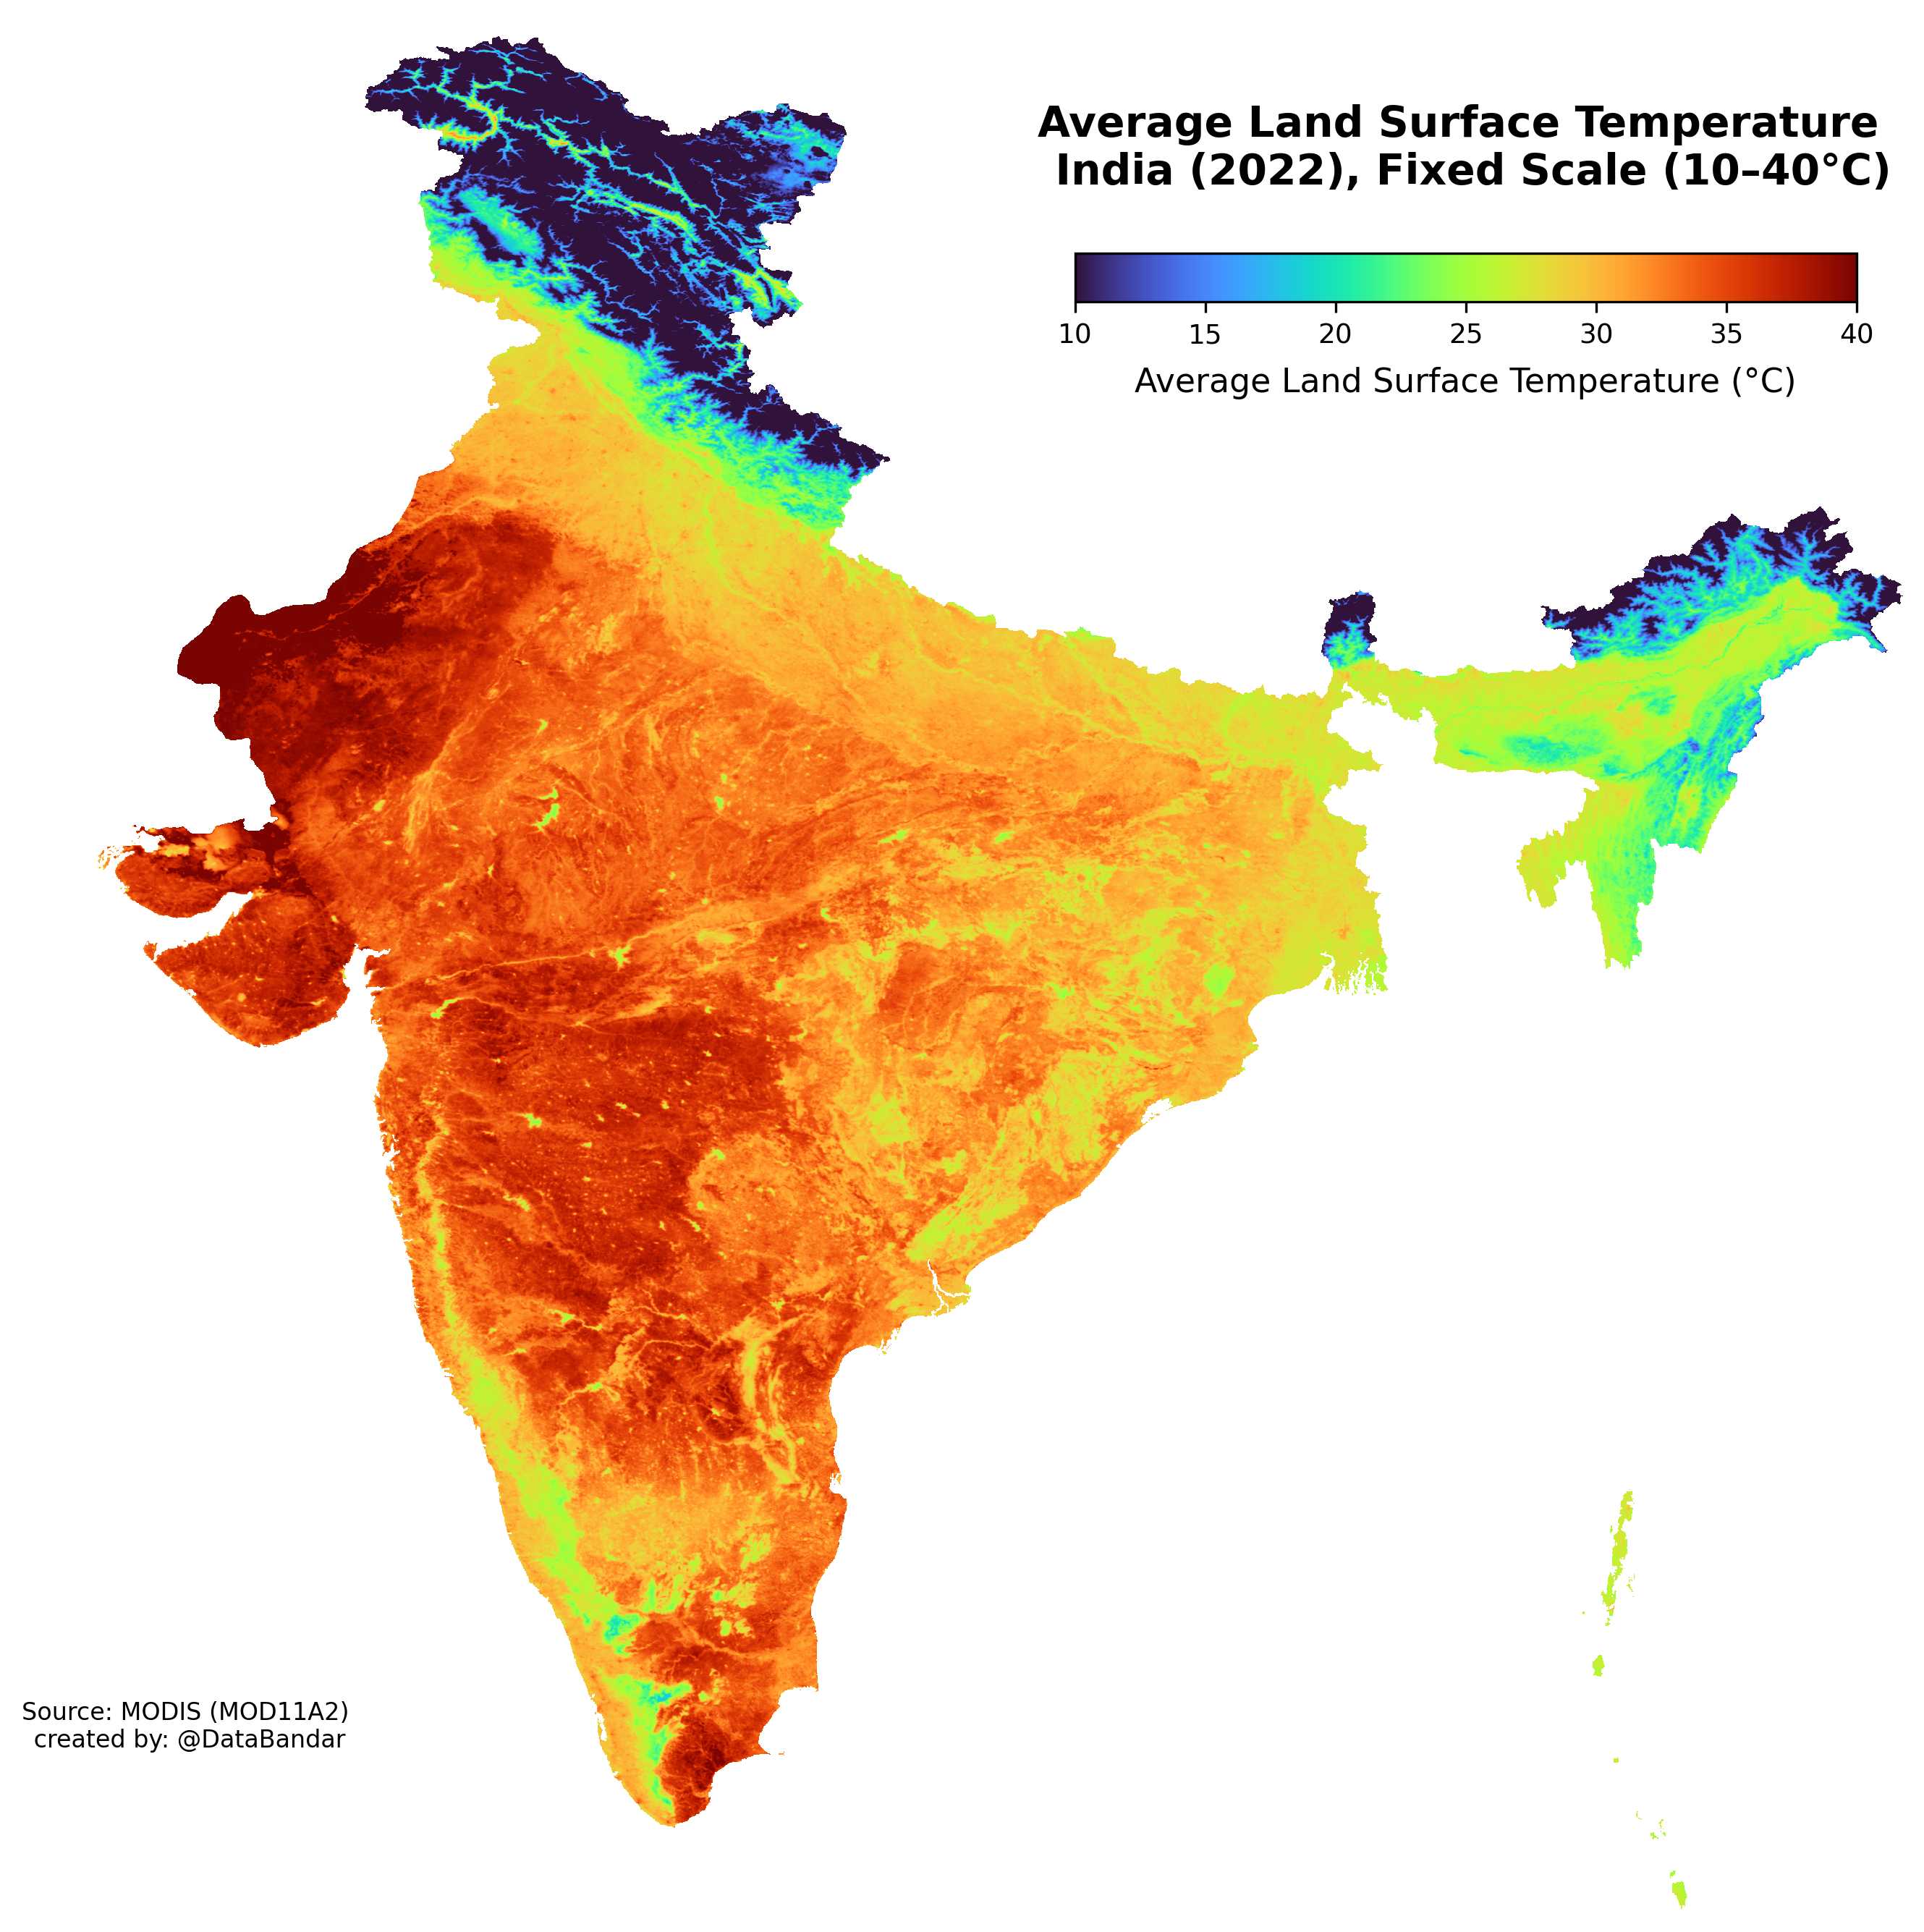
Average Land Surface Temperature Map India 2022
The visualization titled "Average Land Surface Temperature India (2022)" provides a comprehensive view of temperature va...
👁 110📅 8/15/2025