Map of 100° Days Recorded Since 1900

Alex Cartwright
Senior Cartographer & GIS Specialist
Alex Cartwright is a renowned cartographer and geographic information systems specialist with over 15 years of experience in spatial analysis and data...
Geographic Analysis
What This Map Shows
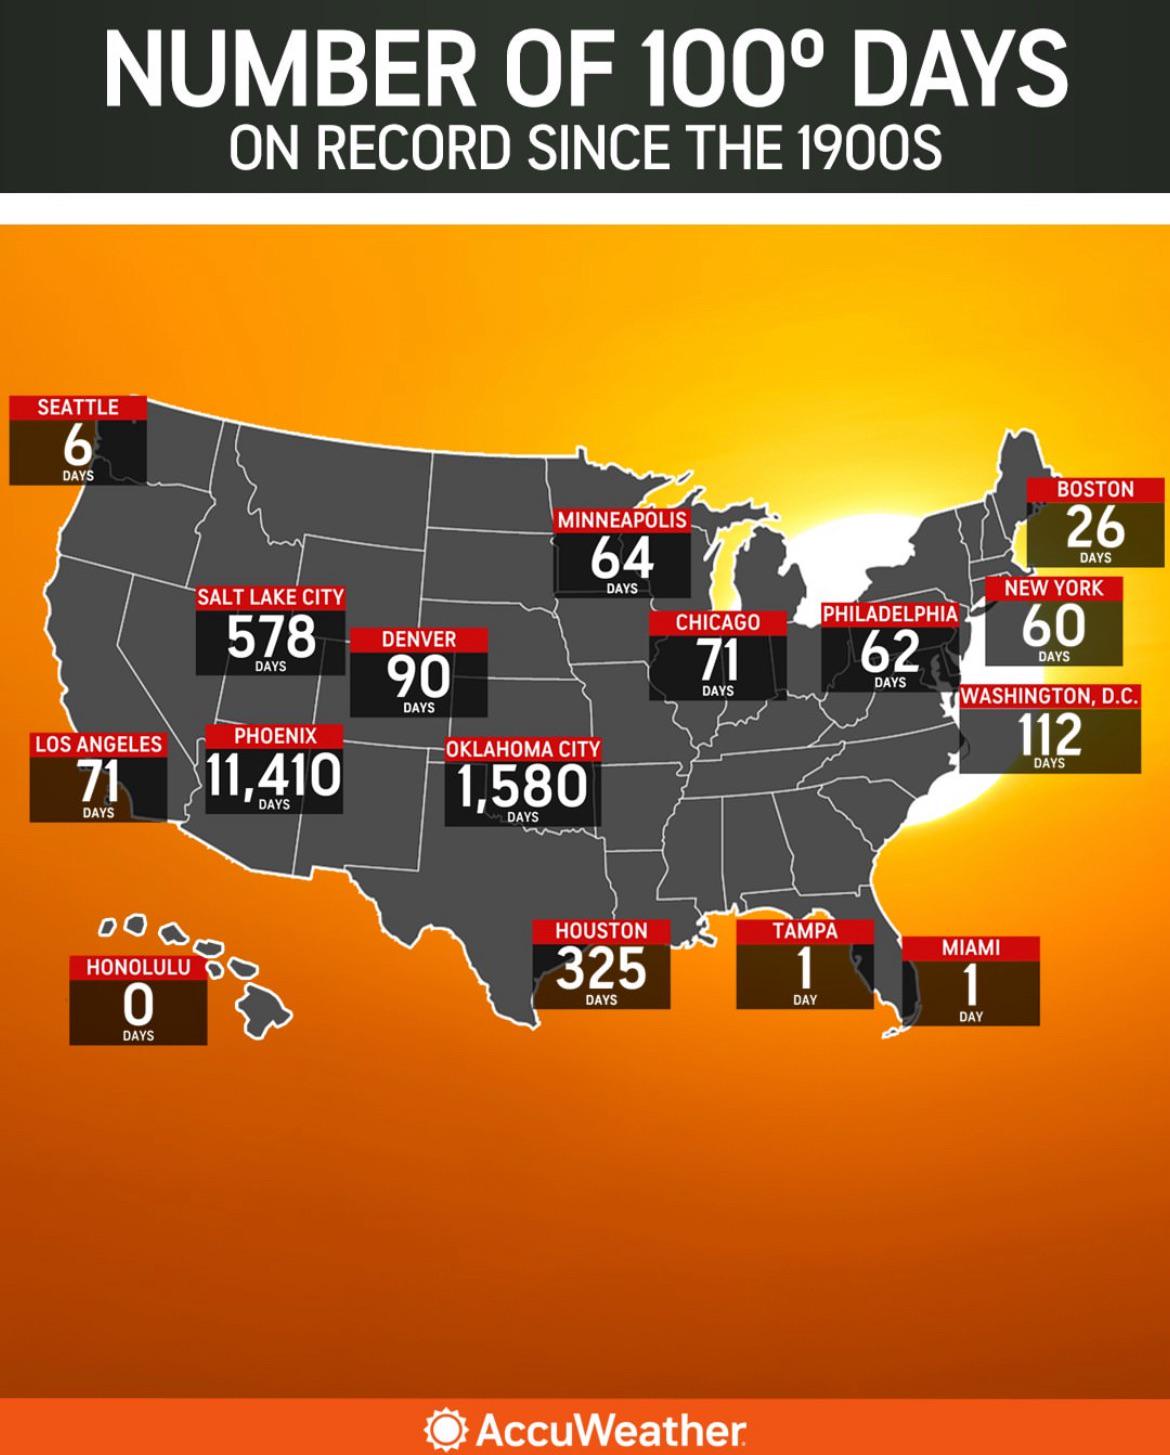
The map titled 'Number of 100° Days on Record Since the 1900s' visually represents the frequency of extreme heat days across the United States over the past century. With rising global temperatures and changing climate patterns, understanding the prevalence of such extreme weather events is crucial for both scientific research and public awareness. This map highlights regions that have experienced significant increases in days reaching or exceeding 100 degrees Fahrenheit, providing a stark visualization of climate change effects.
Deep Dive into Extreme Heat Days
Extreme heat events, defined as days where temperatures soar to 100°F or higher, are becoming increasingly common as global warming progresses. These high-temperature days have severe implications for human health, agriculture, and local ecosystems. The rise in frequency of 100° days can be attributed to several factors, including urbanization, greenhouse gas emissions, and natural climate variability. In the early 1900s, many areas experienced only a handful of such days each year. However, recent decades have shown a marked increase in these extreme temperature days.
Interestingly, the U.S. National Oceanic and Atmospheric Administration (NOAA) reports that the number of 100° days has more than doubled in many regions since the 1970s. For instance, in states like Texas and Arizona, residents can now expect over 50 such days annually, a stark rise from the early 20th century. This shift is not uniform across the nation; some areas have shown resilience due to geographical factors or local climate conditions, while others, especially in the Southeast and Southwest, have become increasingly vulnerable to heat extremes.
A significant contributor to this phenomenon is the urban heat island effect, where cities experience higher temperatures than surrounding rural areas due to human activities and infrastructure. Urban areas, with their extensive concrete surfaces and minimal vegetation, absorb and retain heat more effectively than natural landscapes. This effect can exacerbate heat-related health issues, particularly among vulnerable populations such as the elderly and outdoor workers.
Moreover, the increasing frequency of extreme heat days poses challenges for agriculture. Crops are sensitive to temperature fluctuations, and excessive heat can lead to reduced yields, crop failures, and increased irrigation demands. Farmers in regions such as California, which have already been grappling with prolonged droughts and heatwaves, face daunting challenges as they strive to adapt to these changing conditions.
Regional Analysis
When examining the map, a clear regional variation emerges regarding the number of 100° days recorded. The Southwest, particularly states like Arizona and Nevada, stands out as the most affected region. Cities like Phoenix have recorded over 100 days of 100°F temperatures in recent years, with locals often adapting their lifestyles to cope with the extreme heat.
Conversely, the Midwest, while experiencing fewer 100° days historically, has not been entirely spared. States such as Illinois and Indiana have seen a notable increase in high-temperature occurrences, with urban areas like Chicago facing challenges in mitigating heat-related health risks. Interestingly, the Northeastern U.S. has also begun to experience a rise in extreme heat days, as climate change shifts regional weather patterns.
In contrast, the Pacific Northwest remains relatively insulated from such extremes, primarily due to its maritime climate. However, the region is not immune to the broader implications of climate change, such as increased wildfire risks and altered precipitation patterns. This highlights the interconnectedness of climate systems and the importance of regional analysis in understanding the impacts of extreme heat days.
Significance and Impact
The rise in the number of 100° days recorded across the U.S. is not just a statistical observation; it has profound implications for public health, environmental policy, and urban planning. Understanding these trends is vital for local governments and communities as they develop strategies for heat mitigation and climate resilience.
Moreover, the scientific community is increasingly concerned about the long-term impacts of heat extremes on biodiversity and ecological systems. As temperatures rise, species that cannot adapt or migrate face the threat of extinction. This underscores the importance of preserving natural habitats and implementing conservation strategies that can help mitigate these effects.
Looking ahead, projections suggest that if current trends continue, we may see an even greater increase in extreme heat days by the mid-century, with some models forecasting parts of the U.S. could experience 100° days on a near-daily basis during summer months. This potential reality underscores the urgent need for action on climate change and the importance of understanding the factors contributing to these rising temperatures. As communities, we must prioritize sustainable practices and policies that can help mitigate the impacts of climate change and protect both human and ecological health.
This map serves as a critical reminder of the changes we are witnessing and the importance of collective action to address the challenges posed by our warming planet.
Visualization Details
- Published
- August 21, 2025
- Views
- 186
Comments
Loading comments...