Average Land Surface Temperature Map India 2022

Marcus Rodriguez
Historical Geography Expert
Marcus Rodriguez specializes in historical cartography and geographic data analysis. With a background in both history and geography, he brings unique...
Geographic Analysis
What This Map Shows
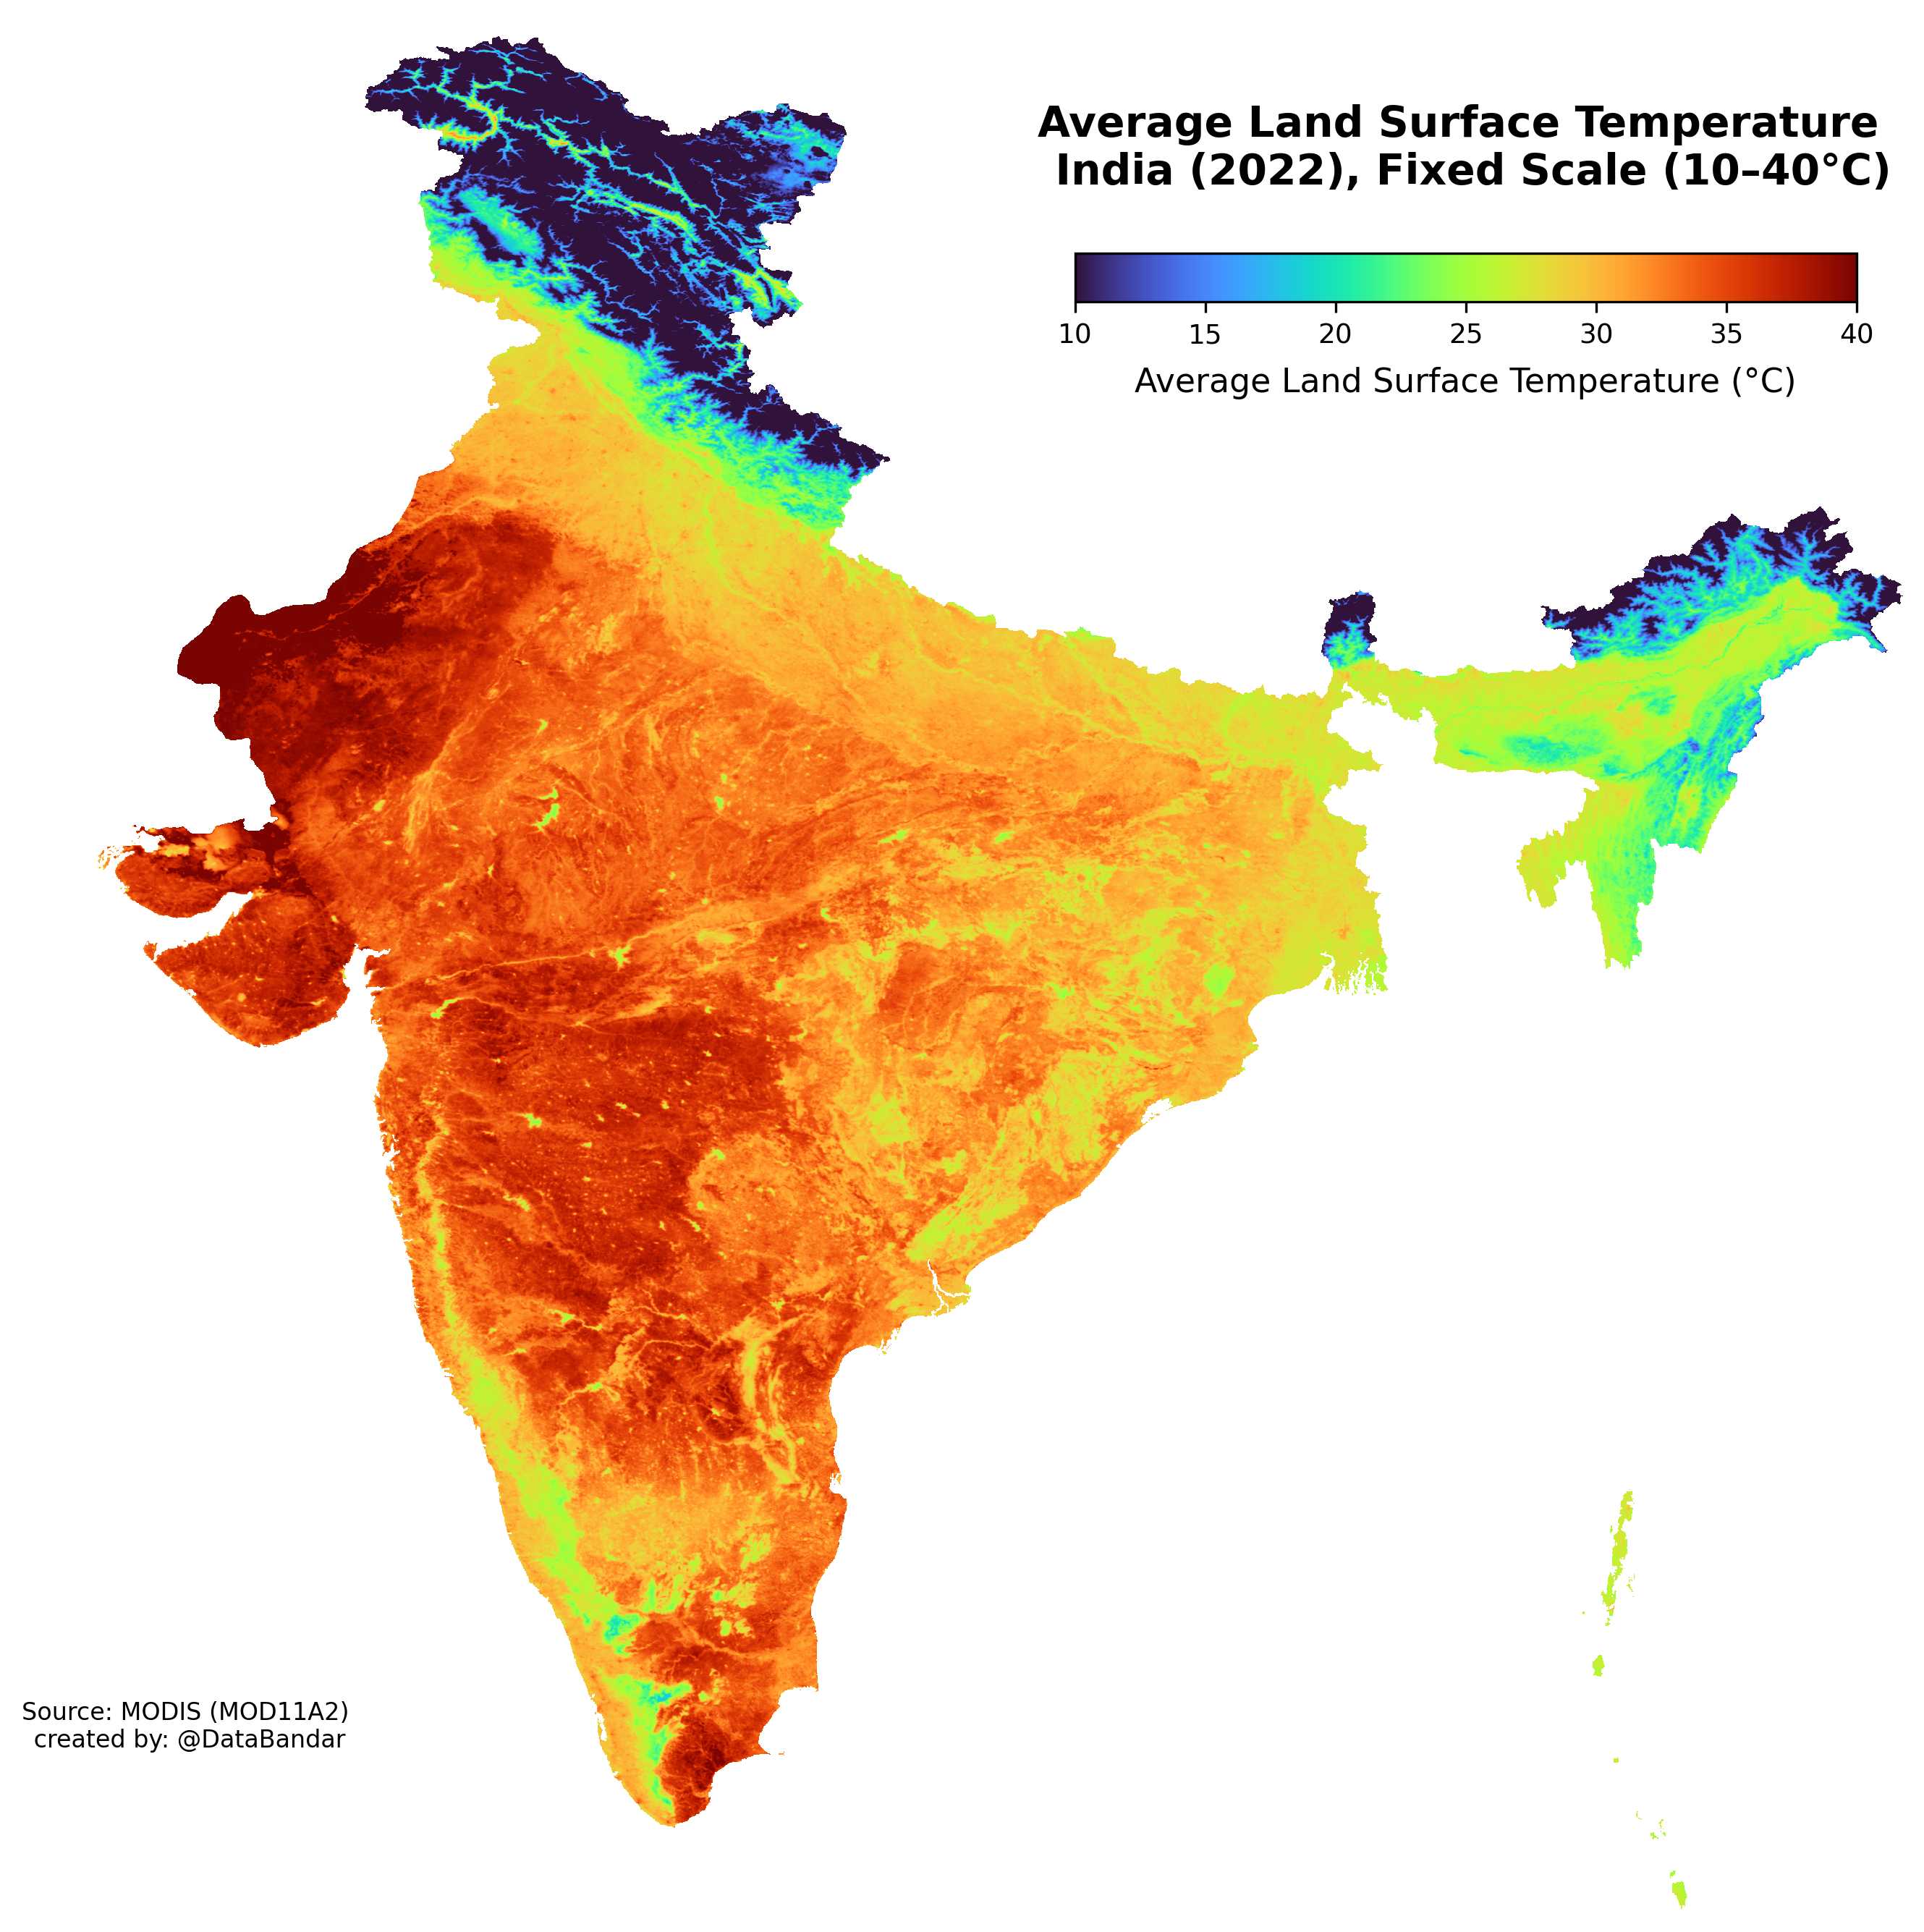
The visualization titled "Average Land Surface Temperature India (2022)" provides a comprehensive view of temperature variations across the Indian subcontinent. By displaying average land surface temperatures in various regions, this map allows us to understand the climatic conditions that prevail in different parts of India during the year 2022. The colors on the map represent temperature gradients, enabling us to identify not just the warmer and cooler regions but also to connect those variations to broader climatic patterns.
So, what does this mean for us? The average land surface temperature is a significant indicator of climate change and environmental health, influencing everything from agriculture and water resources to urban planning and public health. Understanding these temperatures is vital in a country as diverse as India, where geographical features and human activity can lead to distinct microclimates.
Deep Dive into Average Land Surface Temperature
Average land surface temperature, often referred to as LST, is crucial for studying climate dynamics. This measure reflects the heat emitted from the earth’s surface, which can vary widely based on numerous factors, including land cover, vegetation, and human activity. In India, the LST is influenced by its topography, ranging from the towering Himalayas in the north to the vast Thar Desert in the west and the fertile plains of the Ganges River.
Interestingly, the average land surface temperature in India has been on a rising trend over the past few decades. According to the India Meteorological Department (IMD), the average temperature has increased by about 0.7°C over the last century. This increase is alarming, especially when correlated with the intensification of extreme weather events such as heatwaves, droughts, and heavy monsoon rains.
Have you ever wondered how these temperatures affect agriculture? Well, the agriculture sector is particularly sensitive to temperature fluctuations. For instance, regions like Punjab, which is known as the “Granary of India,” are experiencing challenges due to rising temperatures that affect crop yields. Farmers are increasingly turning to heat-resistant crop varieties and altering sowing schedules to adapt to these changes.
Moreover, urban areas like Delhi and Mumbai experience what is known as the urban heat island effect. This phenomenon occurs when urbanization leads to higher temperatures in cities compared to their rural surroundings due to human activities and infrastructure. Urban planning must take these temperature variations into account to mitigate heat impacts on residents.
Regional Analysis
When we dissect the map, we can see significant regional variations in average land surface temperatures across India. The northern states, particularly Punjab and Haryana, often show higher temperatures during summer months, averaging around 32°C to 34°C. In stark contrast, the northeastern states, such as Meghalaya and Arunachal Pradesh, tend to have lower averages, sometimes dipping below 25°C, thanks to their lush greenery and elevation.
Furthermore, coastal areas like Kerala and Tamil Nadu experience milder temperatures due to the influence of the Arabian Sea and the Bay of Bengal, ranging from 28°C to 30°C. However, this is balanced by high humidity levels, making it feel even warmer. On the other hand, central India, particularly regions in Madhya Pradesh and Maharashtra, shows a broader temperature range, with summer highs that can reach up to 45°C.
What’s fascinating is that the Thar Desert in Rajasthan showcases some of the most extreme temperatures, with summer highs often exceeding 50°C. This stark contrast between regions highlights the complex interplay between geography and climate.
Significance and Impact
Understanding the average land surface temperature is not just an academic exercise; it has real-world implications. For instance, these temperatures affect water availability, which is crucial for both human consumption and agriculture. Regions experiencing higher temperatures may face increased evaporation rates, leading to water scarcity—a pressing issue in many parts of India.
Additionally, the data from the average land surface temperature can inform policies related to climate adaptation and mitigation. As India grapples with the challenges of climate change, including erratic monsoon patterns and rising sea levels, accurate temperature data is integral to developing effective strategies.
Looking to the future, projections suggest that if current trends continue, India may witness an increase in average temperatures by an additional 1.5°C to 2°C by the end of the century. This could exacerbate existing challenges related to food security, health, and economic stability. Therefore, the implications of understanding land surface temperatures extend beyond geography and into the realms of public policy and climate action.
In conclusion, the average land surface temperature map of India for 2022 serves as a crucial tool for understanding not only the current climatic landscape but also the future challenges that lie ahead for this vibrant and diverse nation.
Visualization Details
- Published
- August 15, 2025
- Views
- 112
Comments
Loading comments...