population growth Maps
29 geographic visualizations tagged with "population growth"
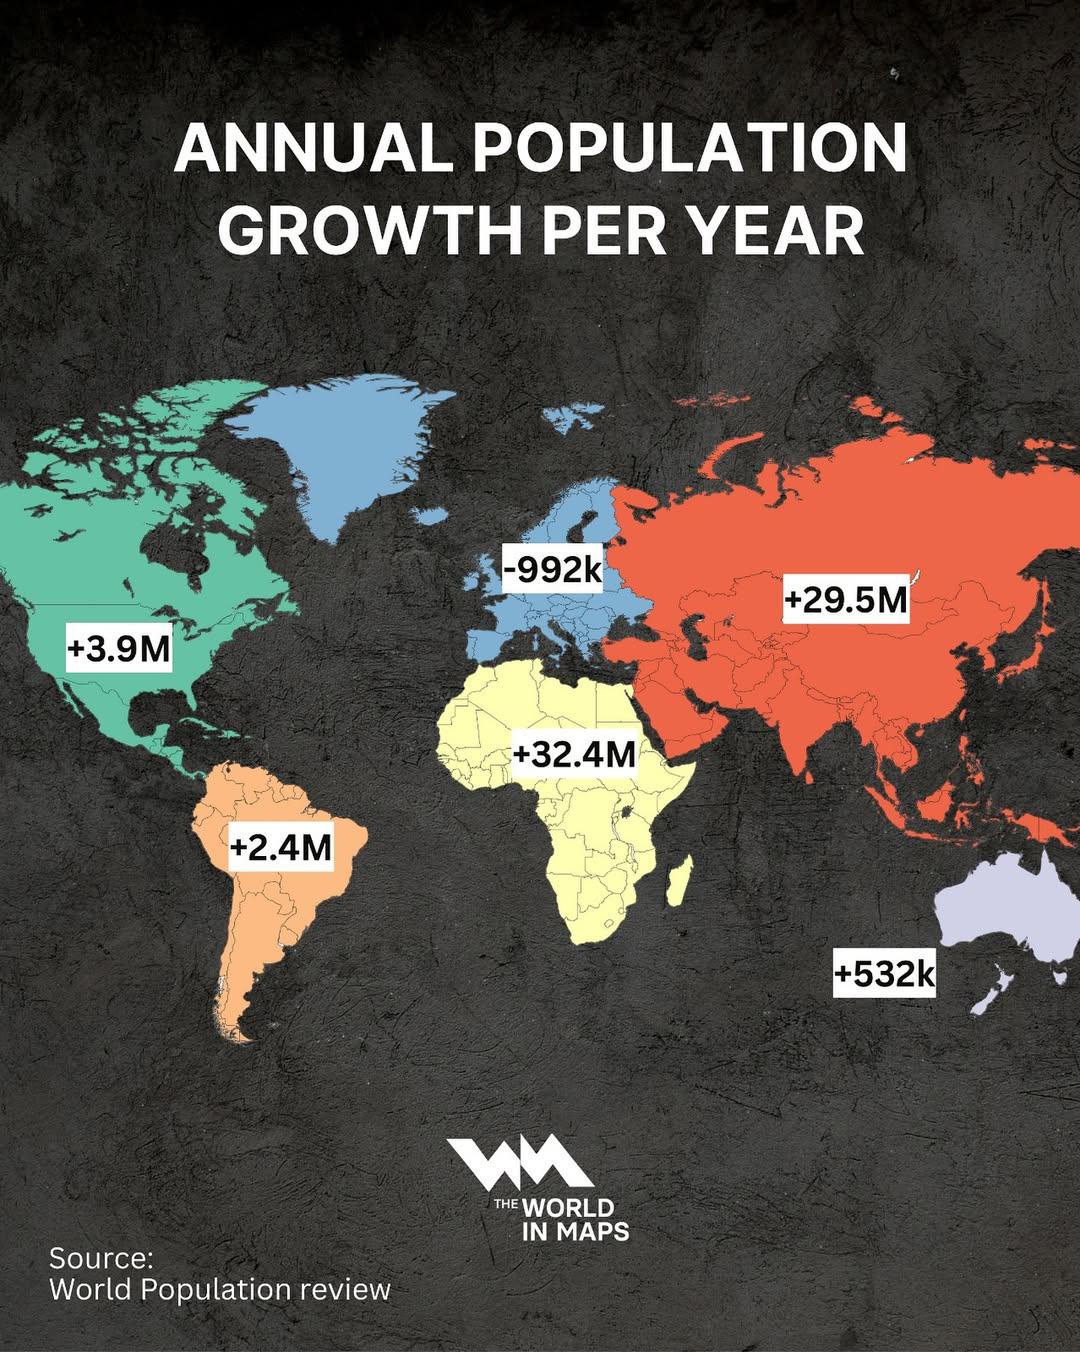
Annual Population Growth by Continent Map
The "Annual Population Growth by Continent Map" visually represents the trends in population increase across different c...
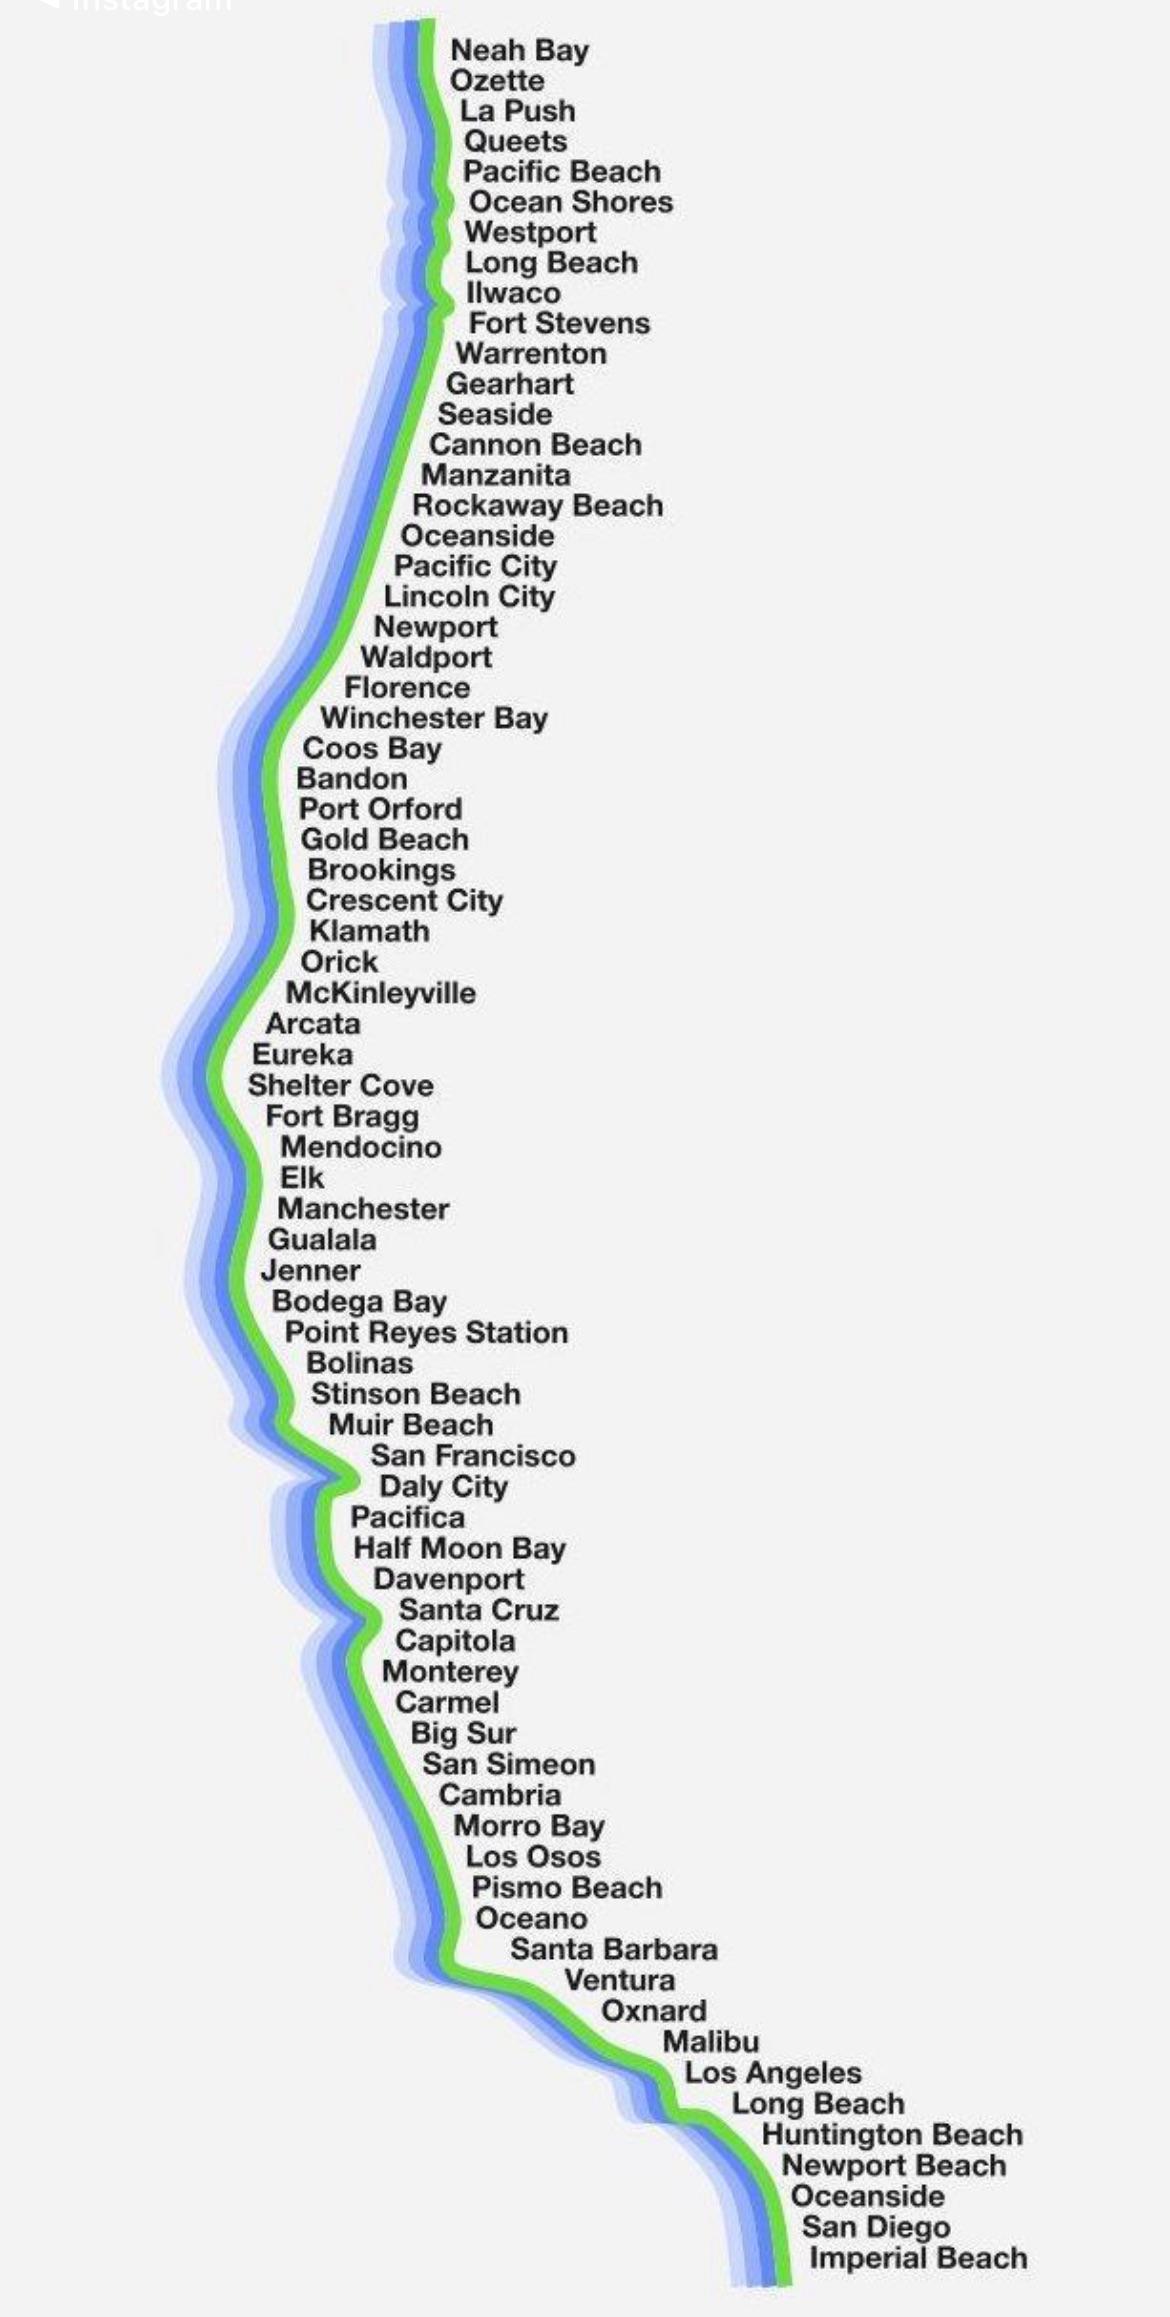
Map of US West Coast Cities (Not OC)
The "Map of the US West Coast Cities (Not OC)" provides a detailed visualization of major urban centers along the Pacifi...
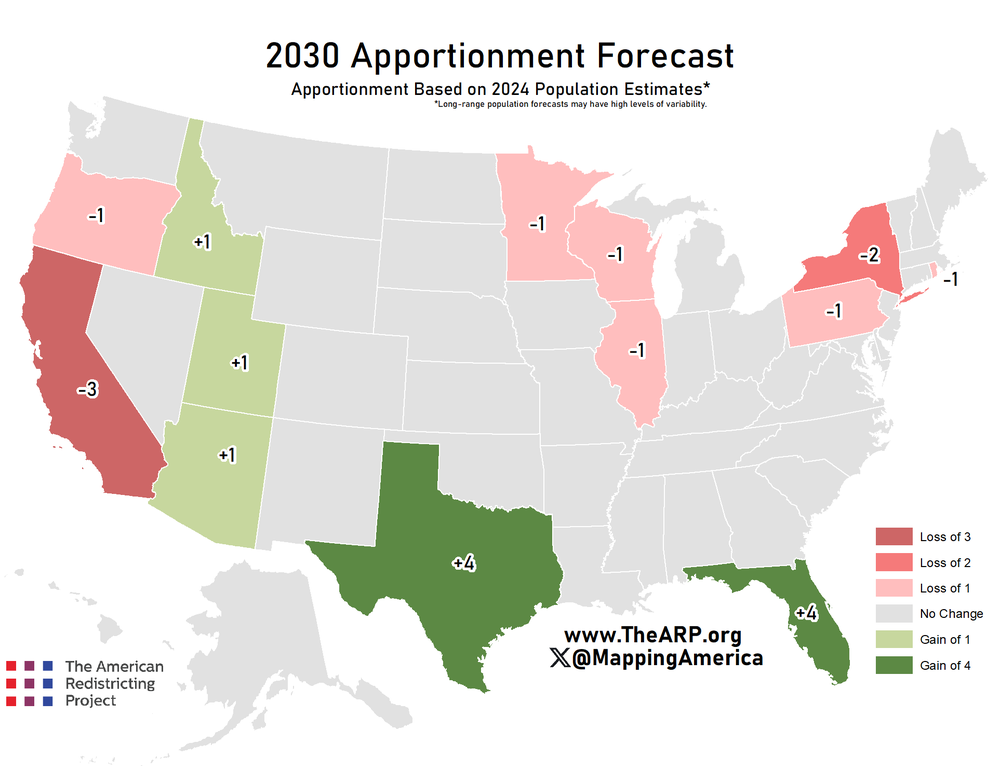
Electoral College Votes Forecast Map 2030
The "Forecast Apportionment of Electoral College Votes of 2030" map illustrates the projected distribution of electoral ...
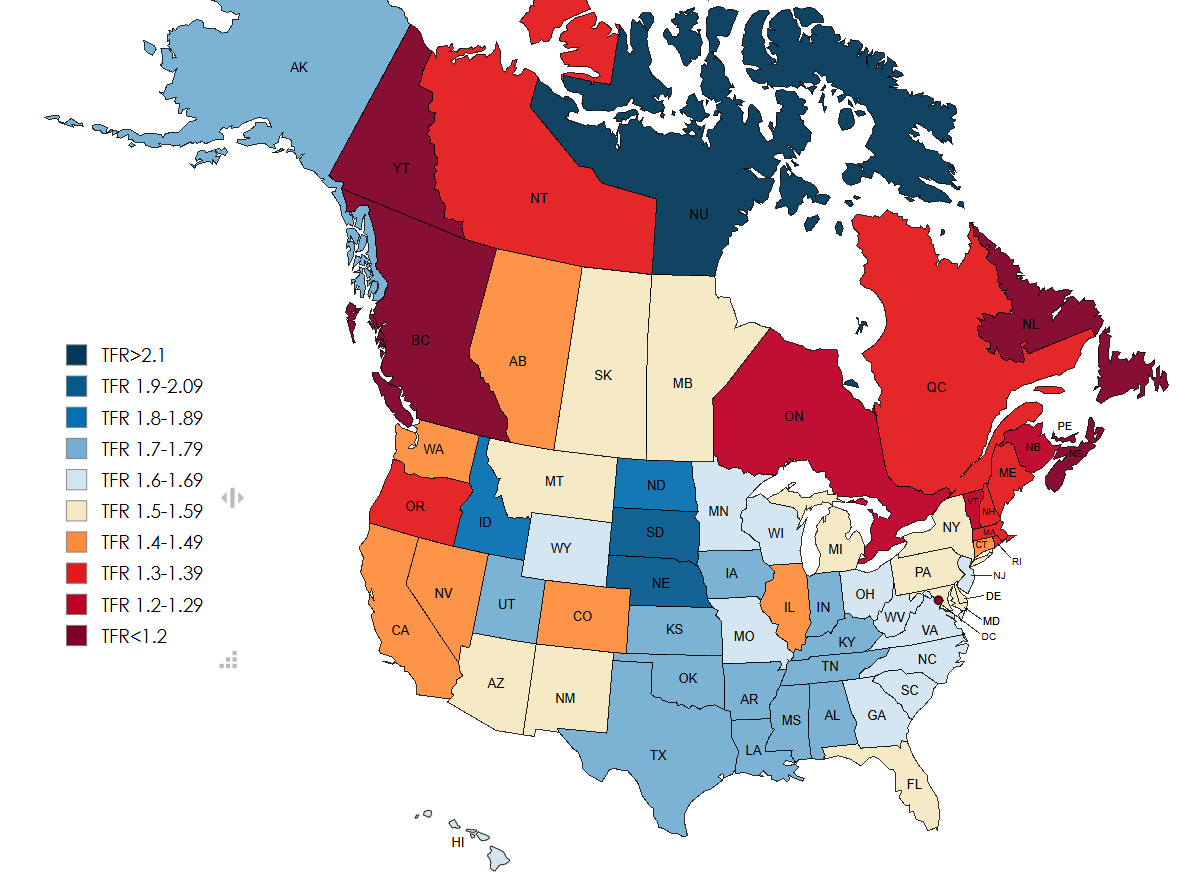
Fertility Rates in US and Canada 2024 Map
The "Fertility Rates in US and Canada 2024 Map" provides a comprehensive visualization of the fertility rates across dif...
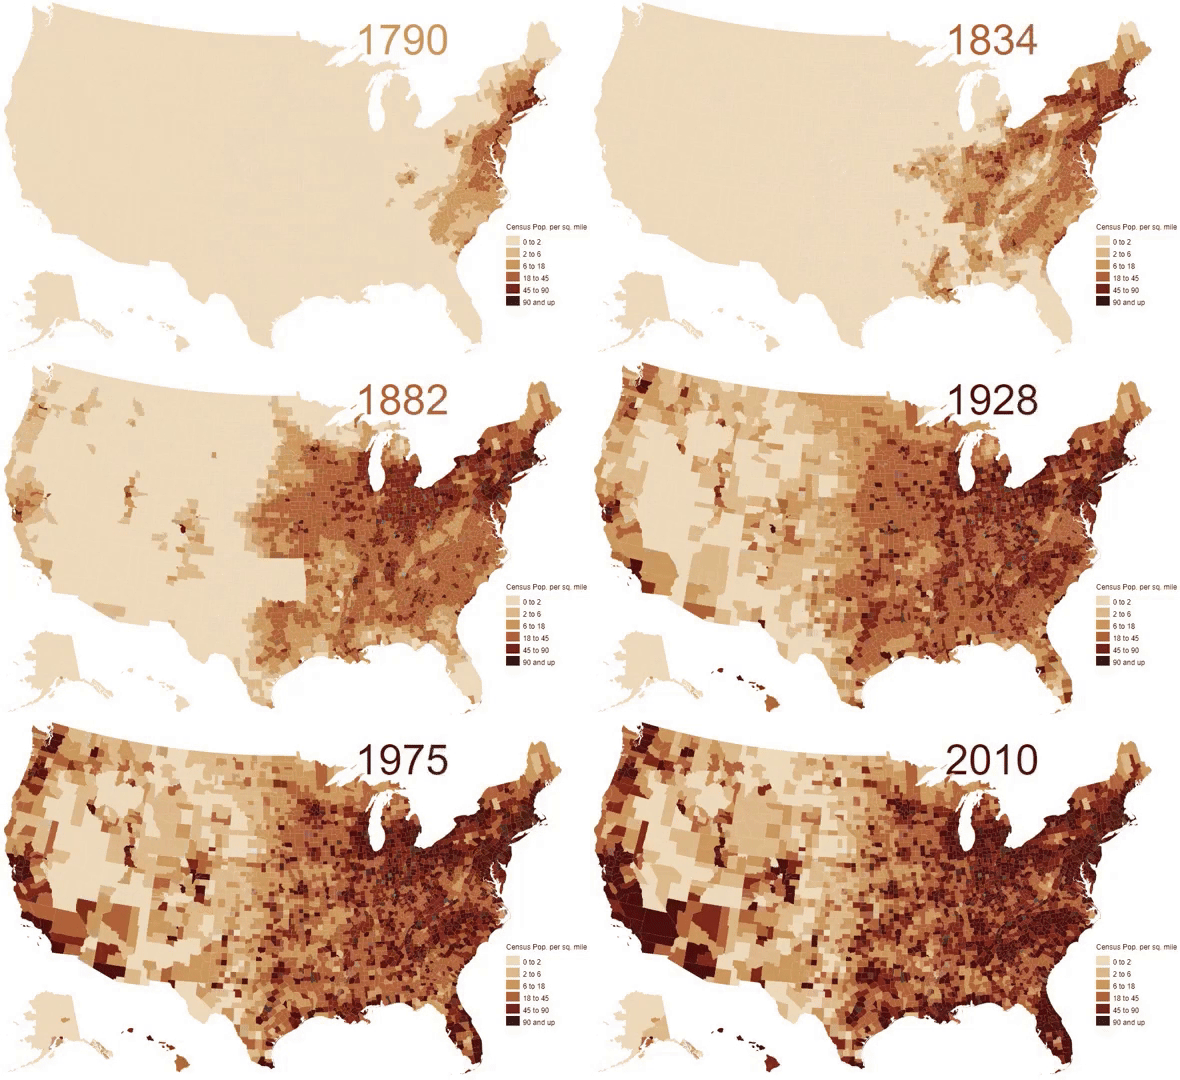
US Population Growth Over 200 Years Map
The visualization titled "200 years of US population growth in 30 seconds" encapsulates a remarkable narrative of demogr...
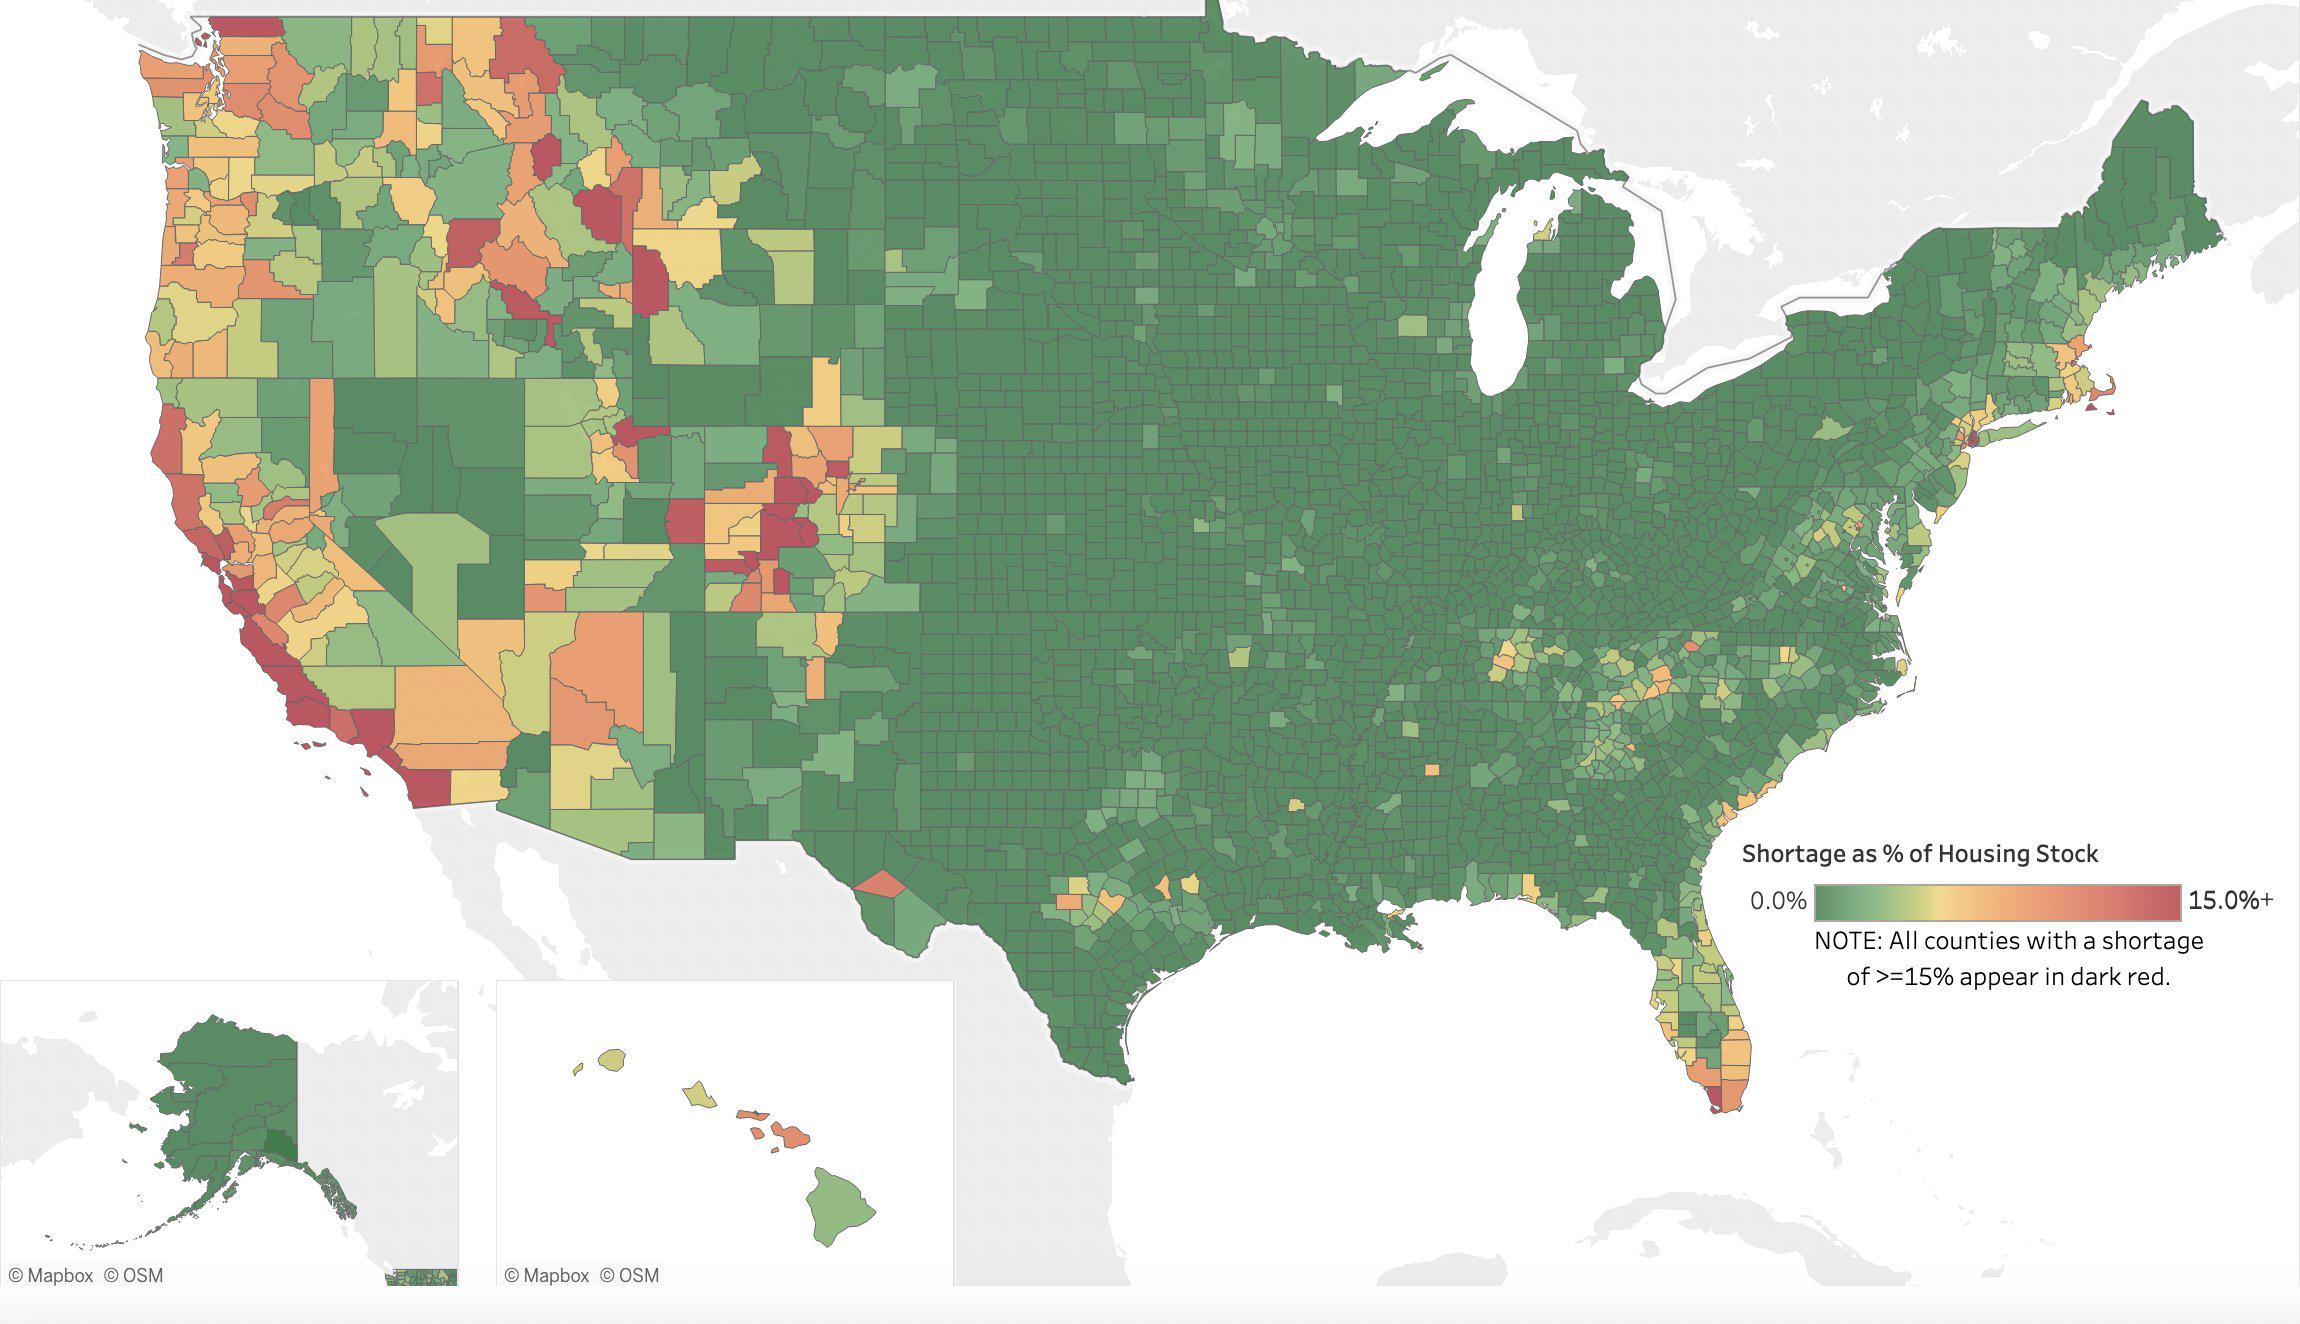
Housing Shortage as Percentage of Stock Map
The visualization titled "Shortage as % of Housing Stock in USA" provides a comprehensive overview of the housing landsc...
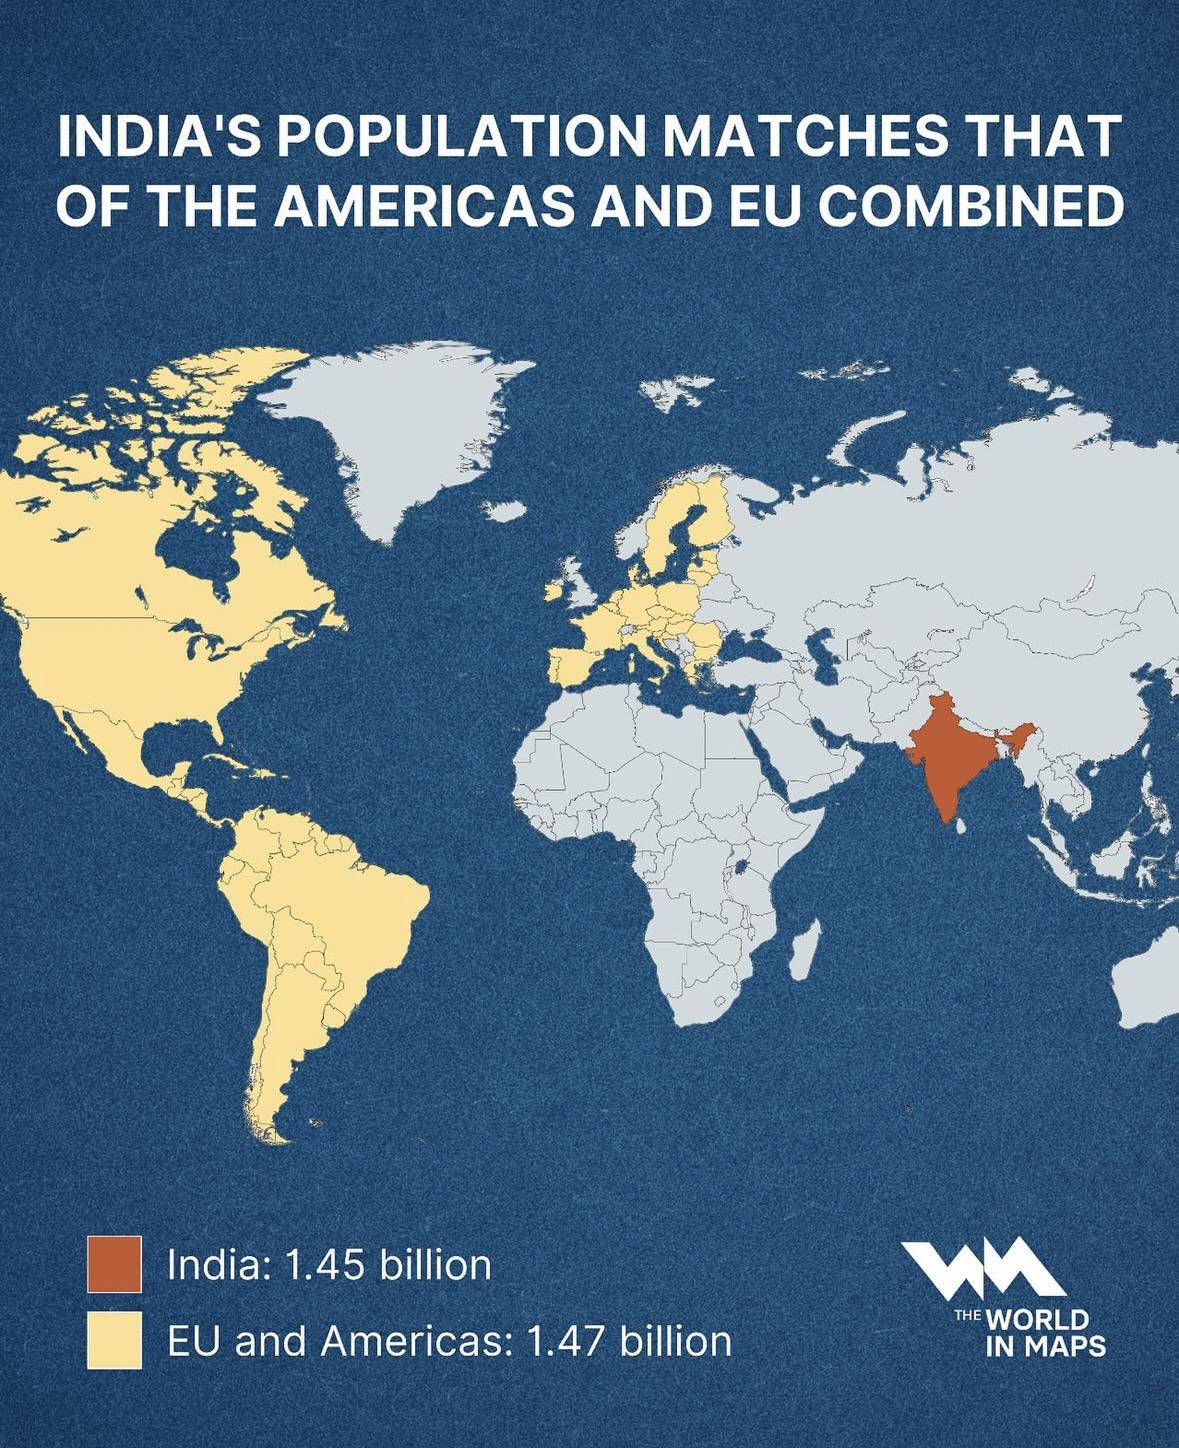
India Population Compared to Americas & EU Map
This map illustrates a striking demographic milestone: India’s population, standing at approximately 1.45 billion, now n...
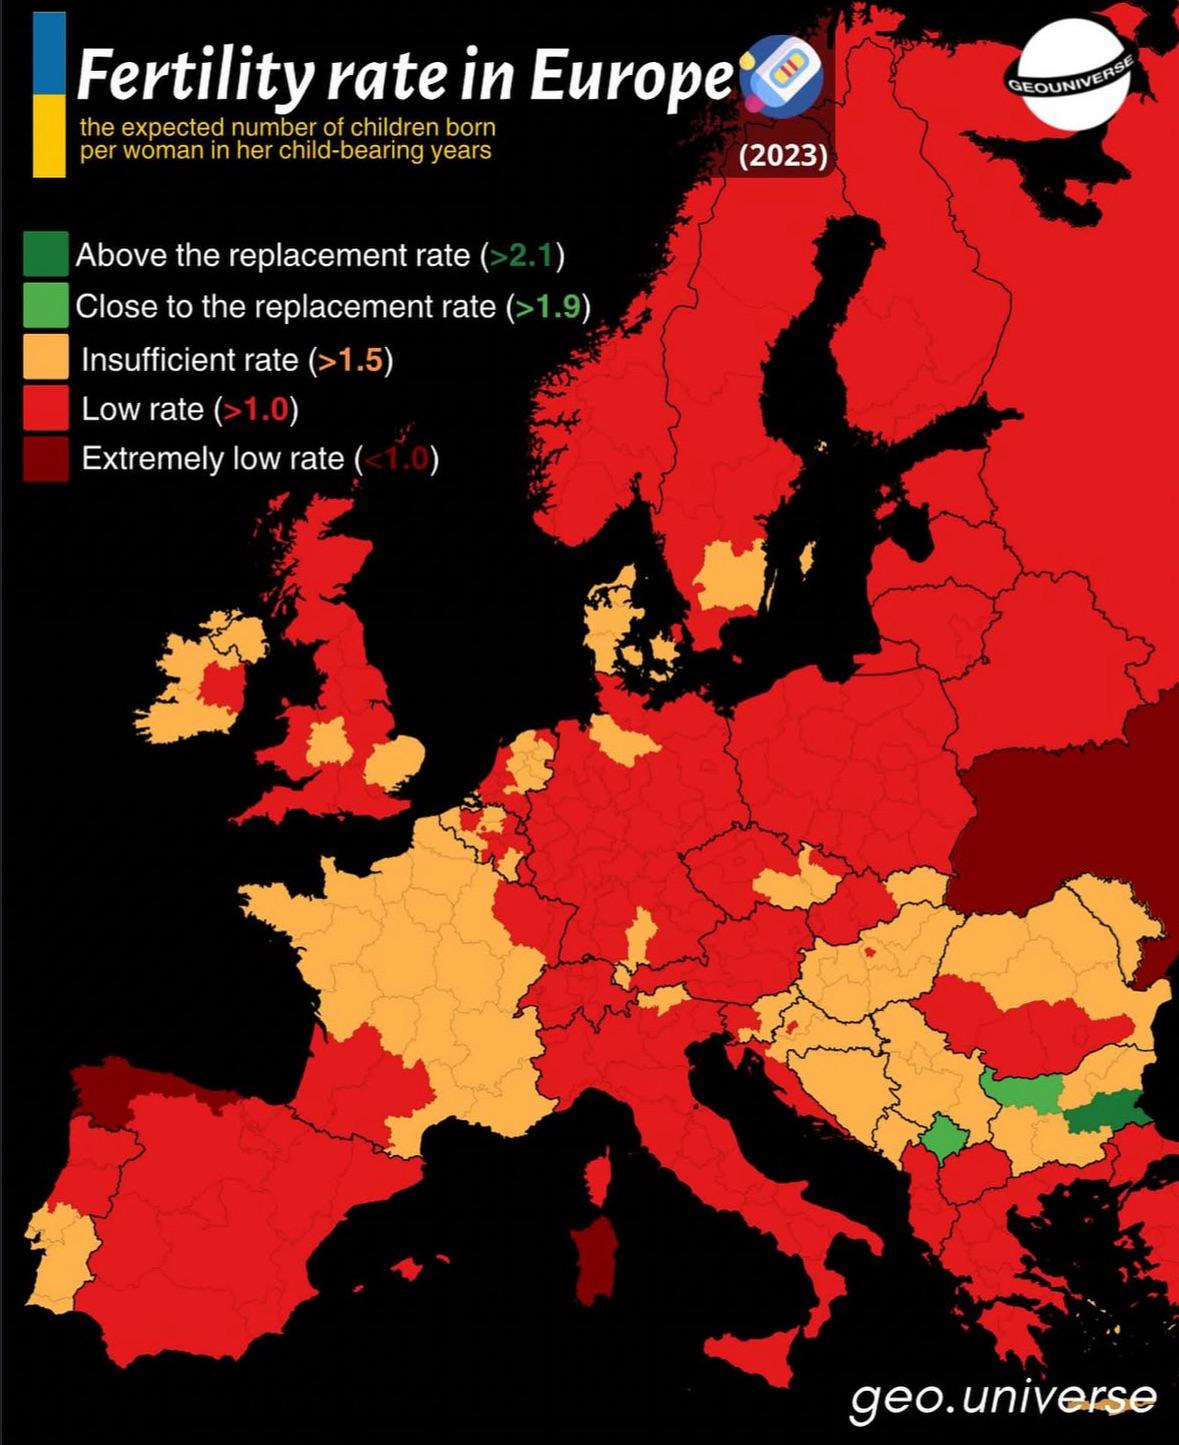
Fertility Rate in Europe Map
The "Fertility Rate in Europe Map" provides a visual representation of the average number of children born to a woman ov...
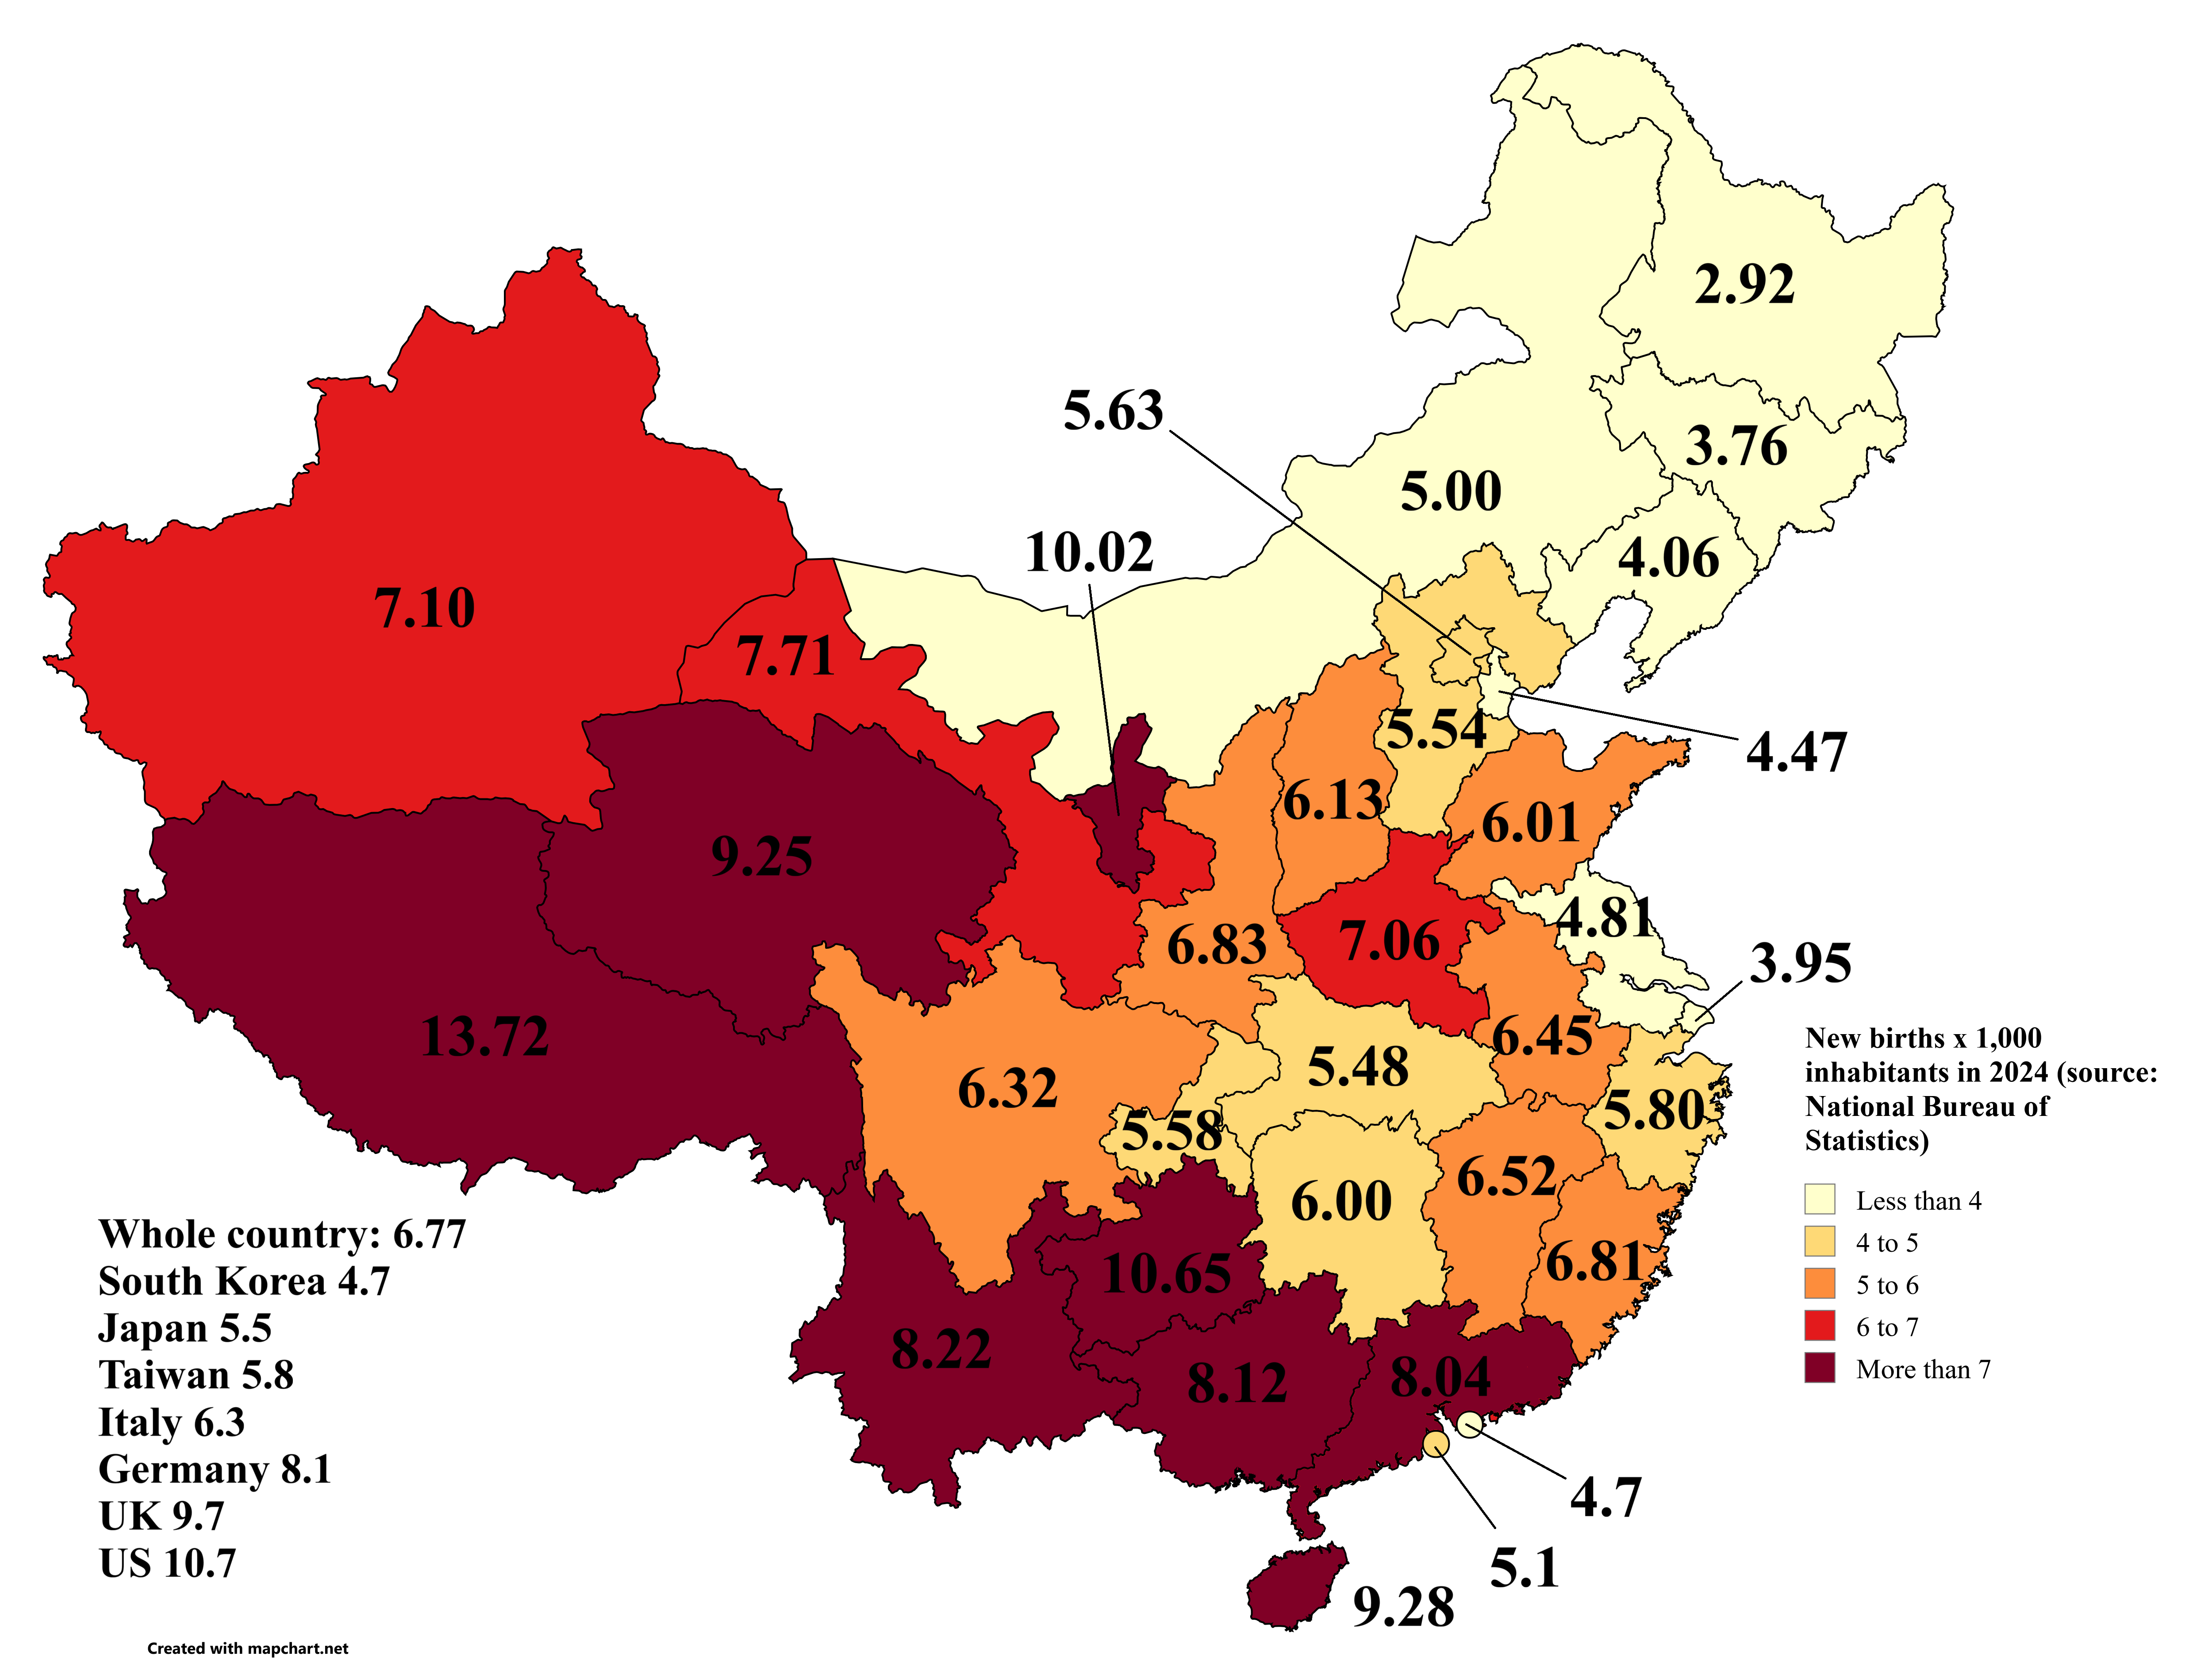
Birth Rate Map of Chinese Provinces in 2024
This map visually represents the birth rate in Chinese provinces for the year 2024, measured in the number of newborns p...
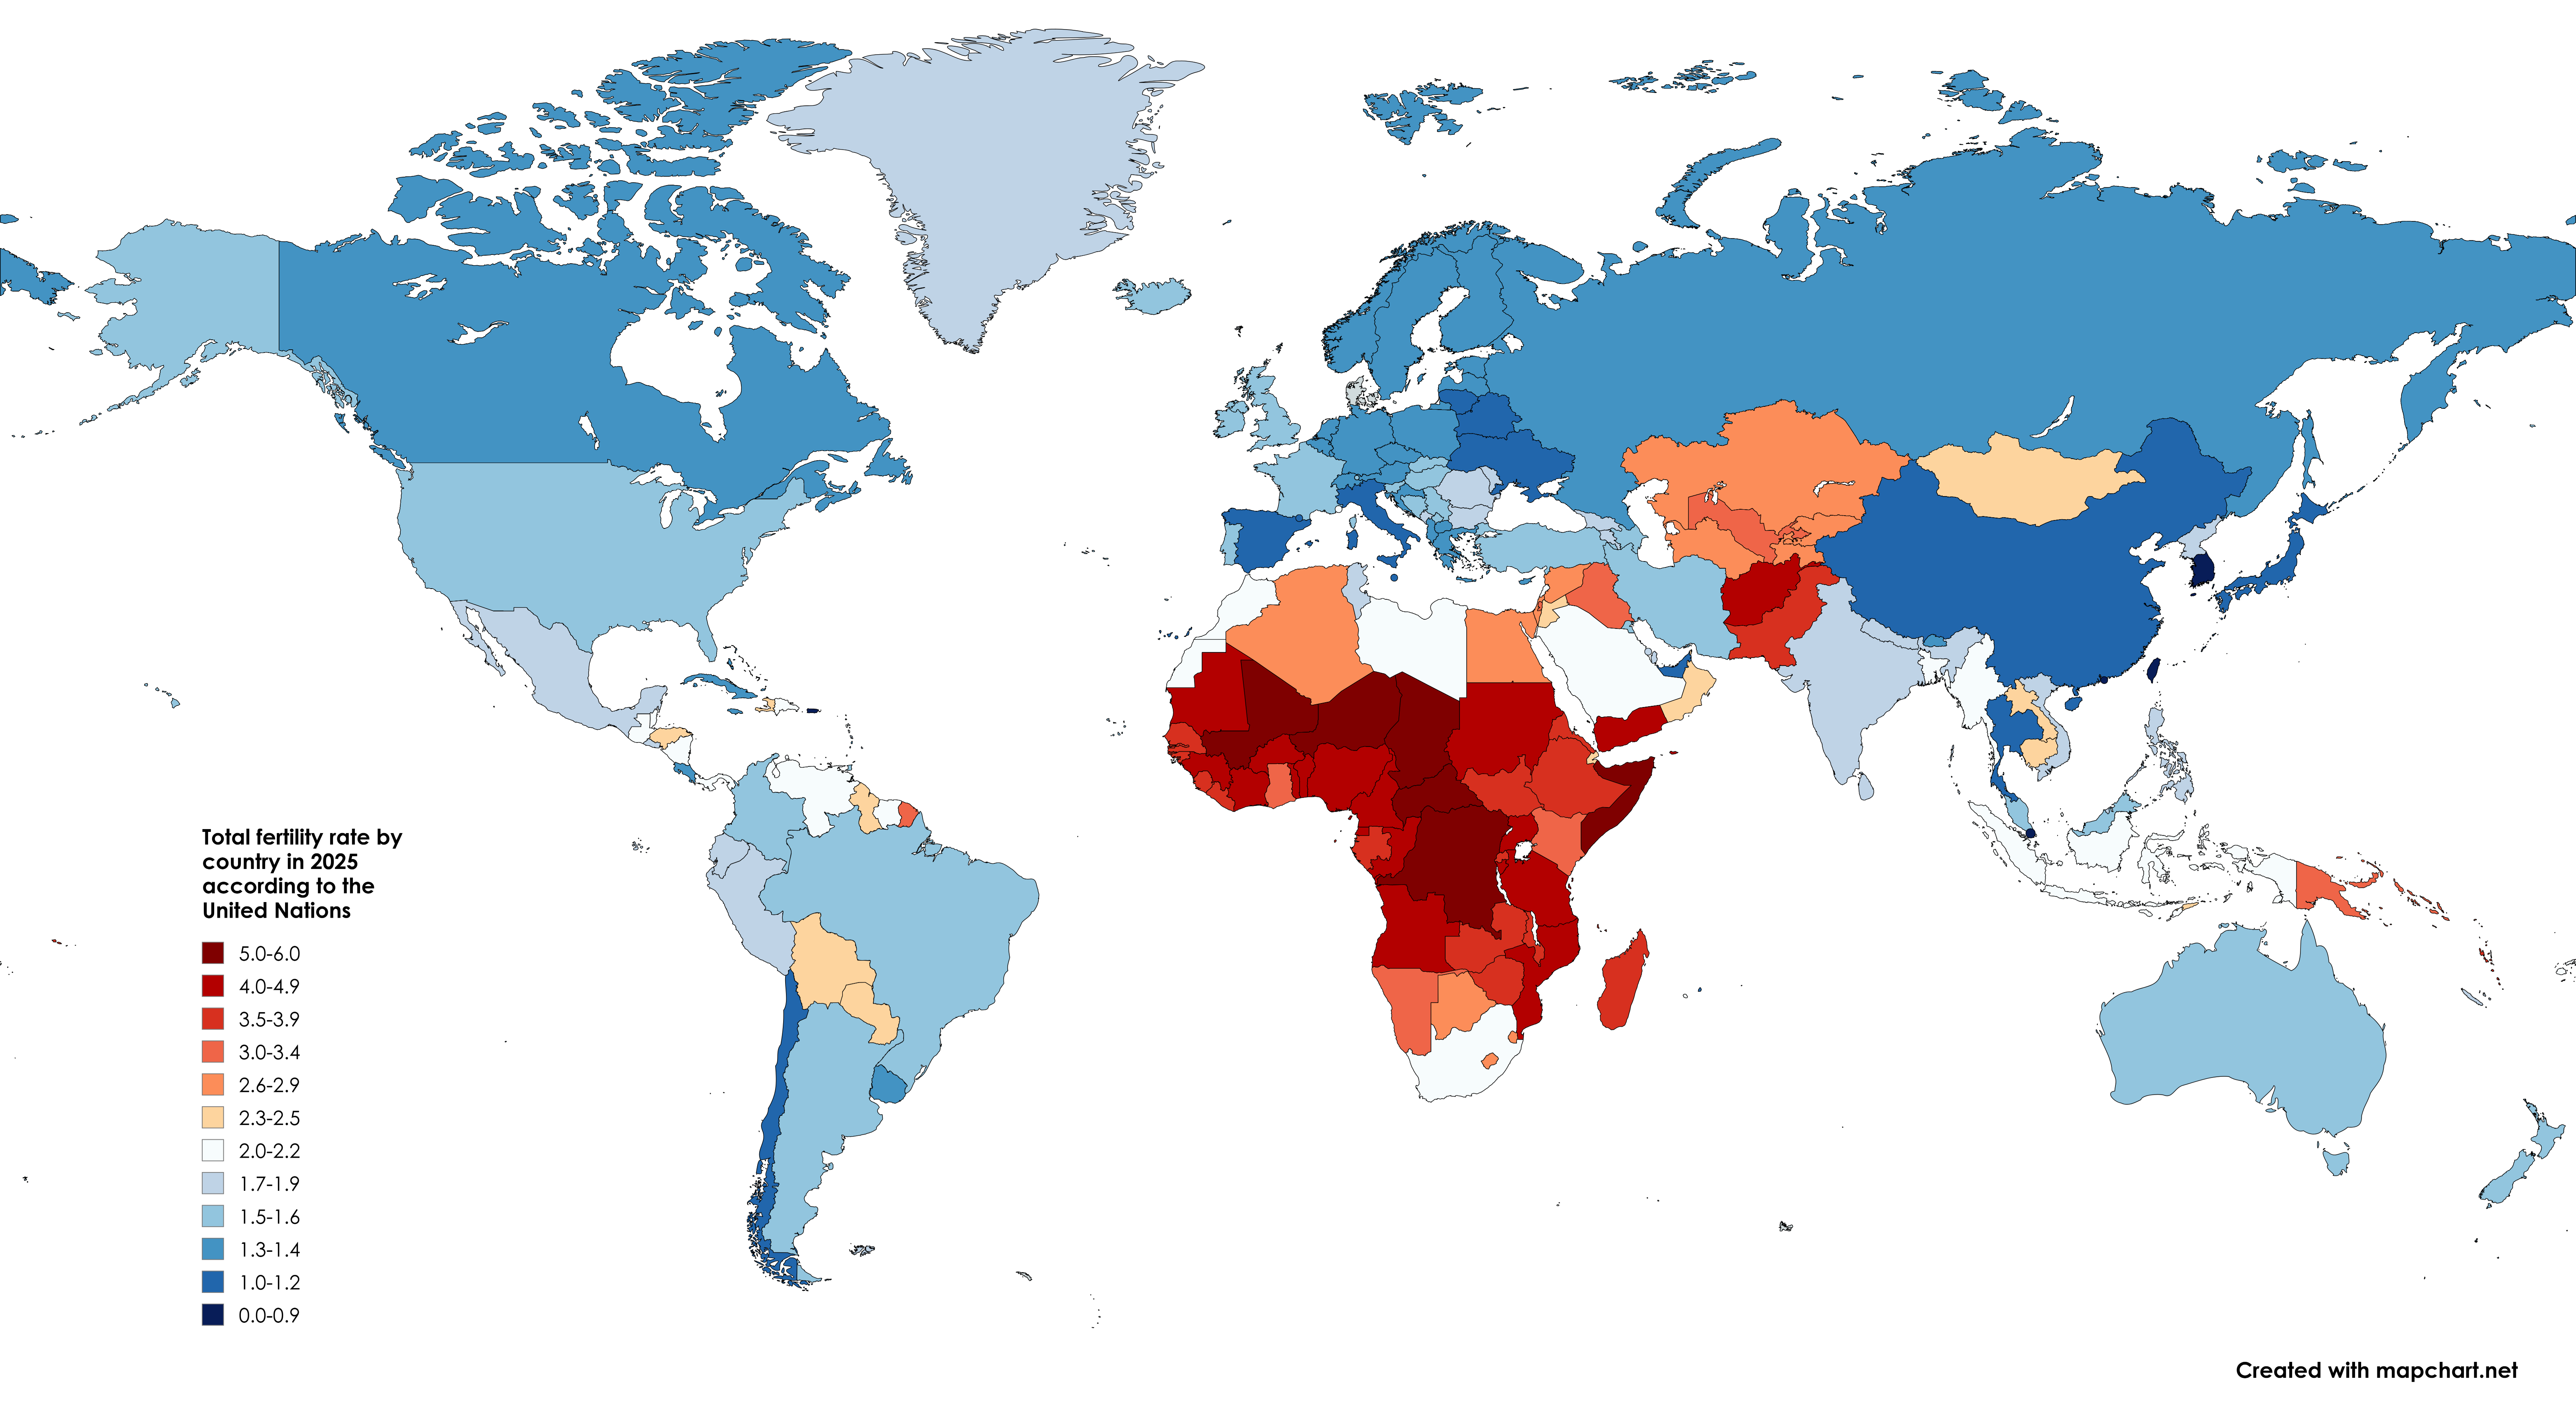
Total Fertility Rate by Country Map 2025
This map visualizes the total fertility rate (TFR) by country in 2025, based on projections from the United Nations. The...
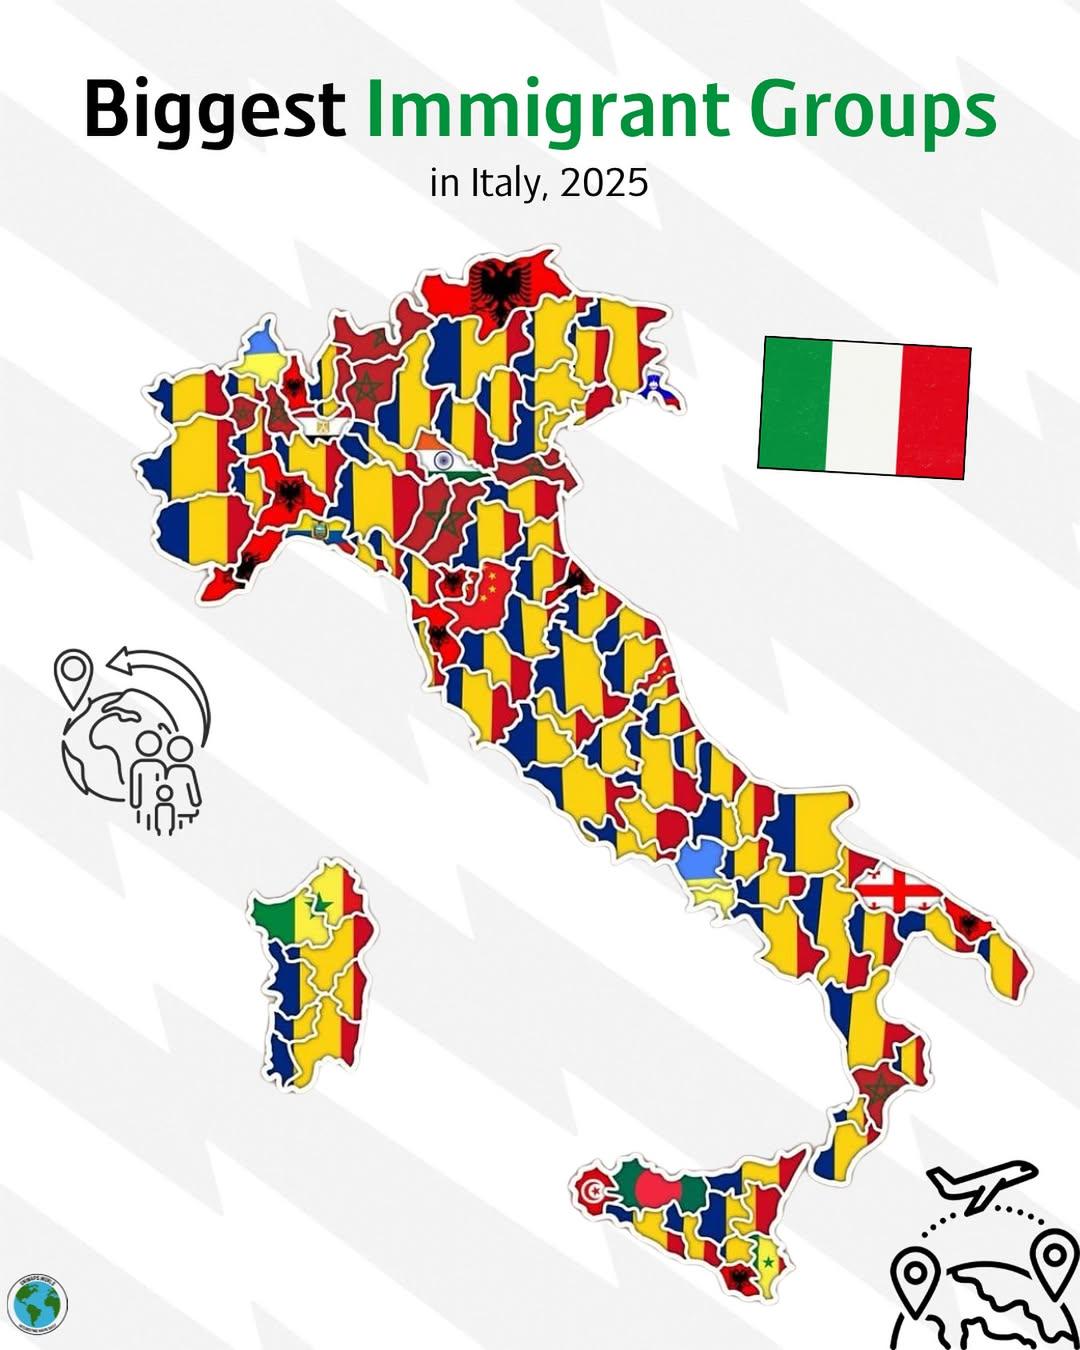
Biggest Immigrant Groups in Italy Map
The \...
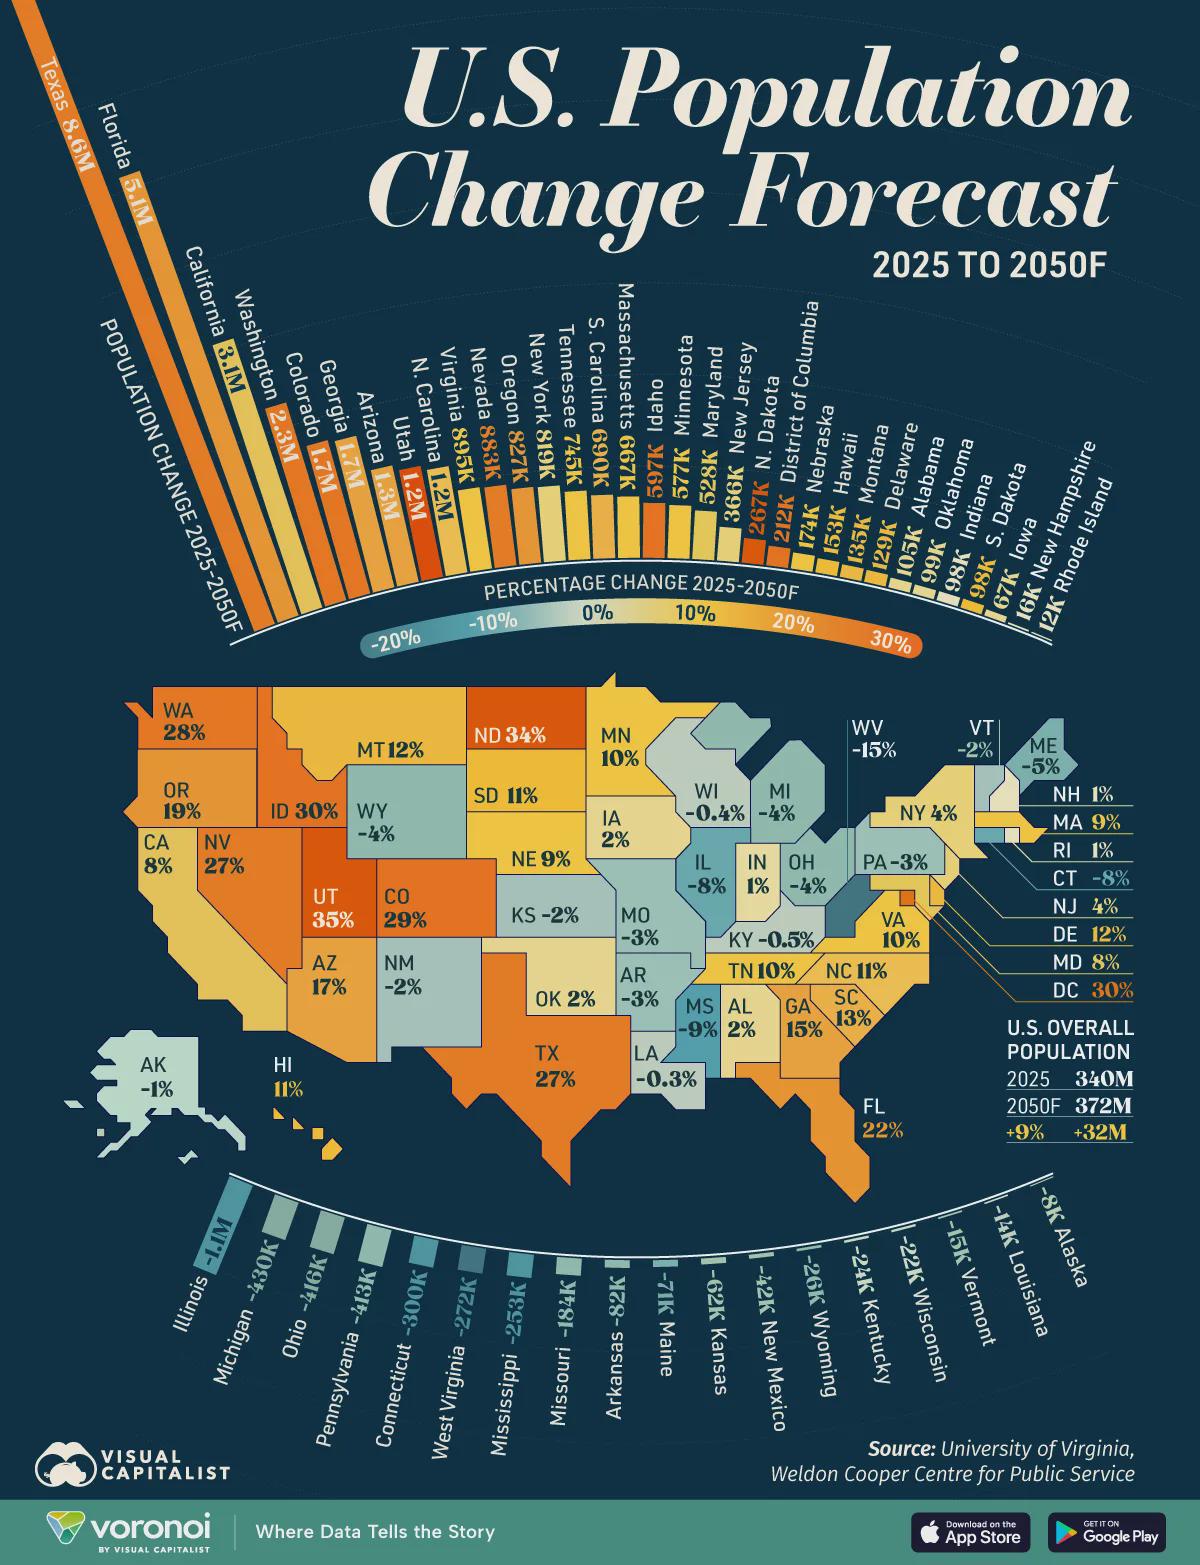
Fastest Growing States Map 2025 to 2050
The "Fastest Growing States Map 2025 to 2050" presents a projection of population growth across the United States, highl...
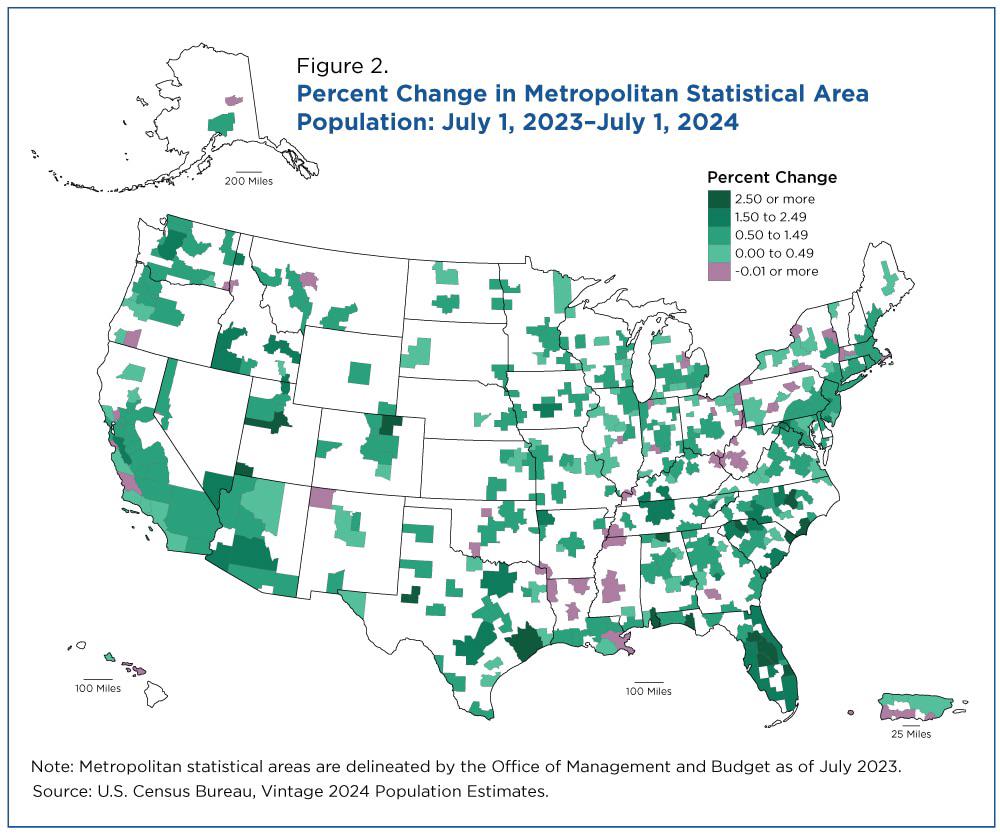
Metropolitan Area Growth Map July 2023 - July 2024
The \...
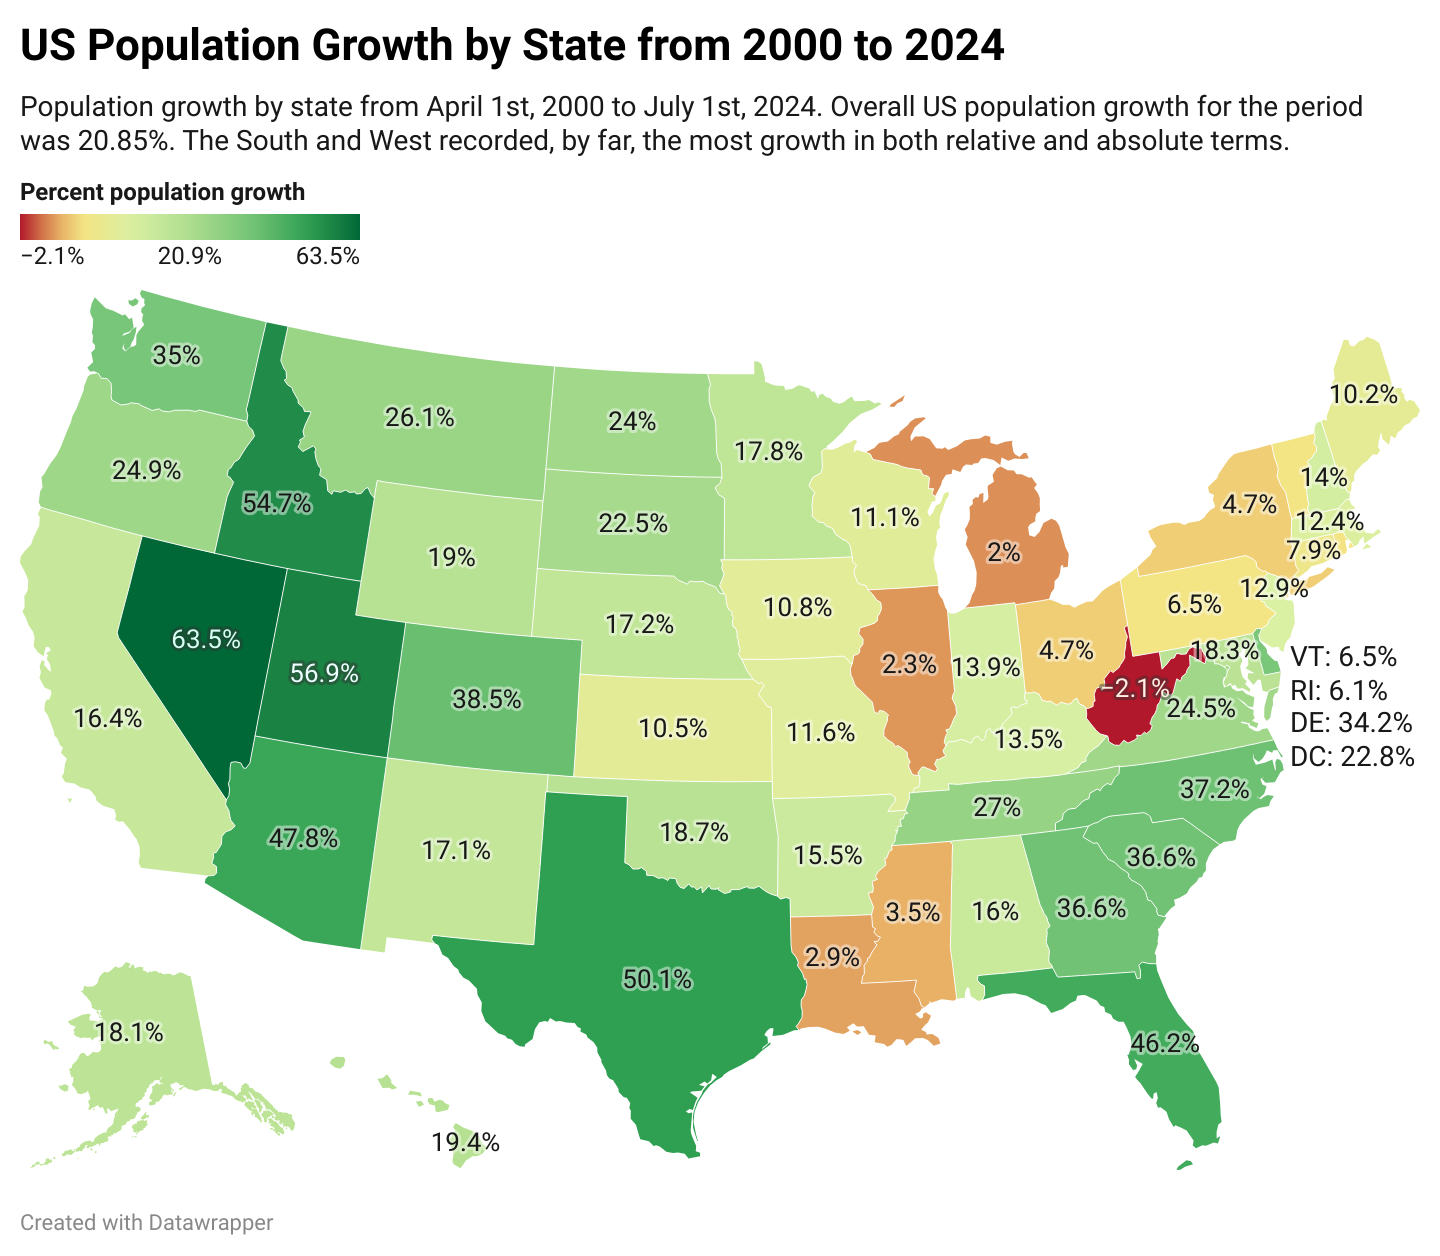
Population Growth by State Map
This map visualizes population growth by state throughout the 21st century, illustrating how demographic shifts have tra...
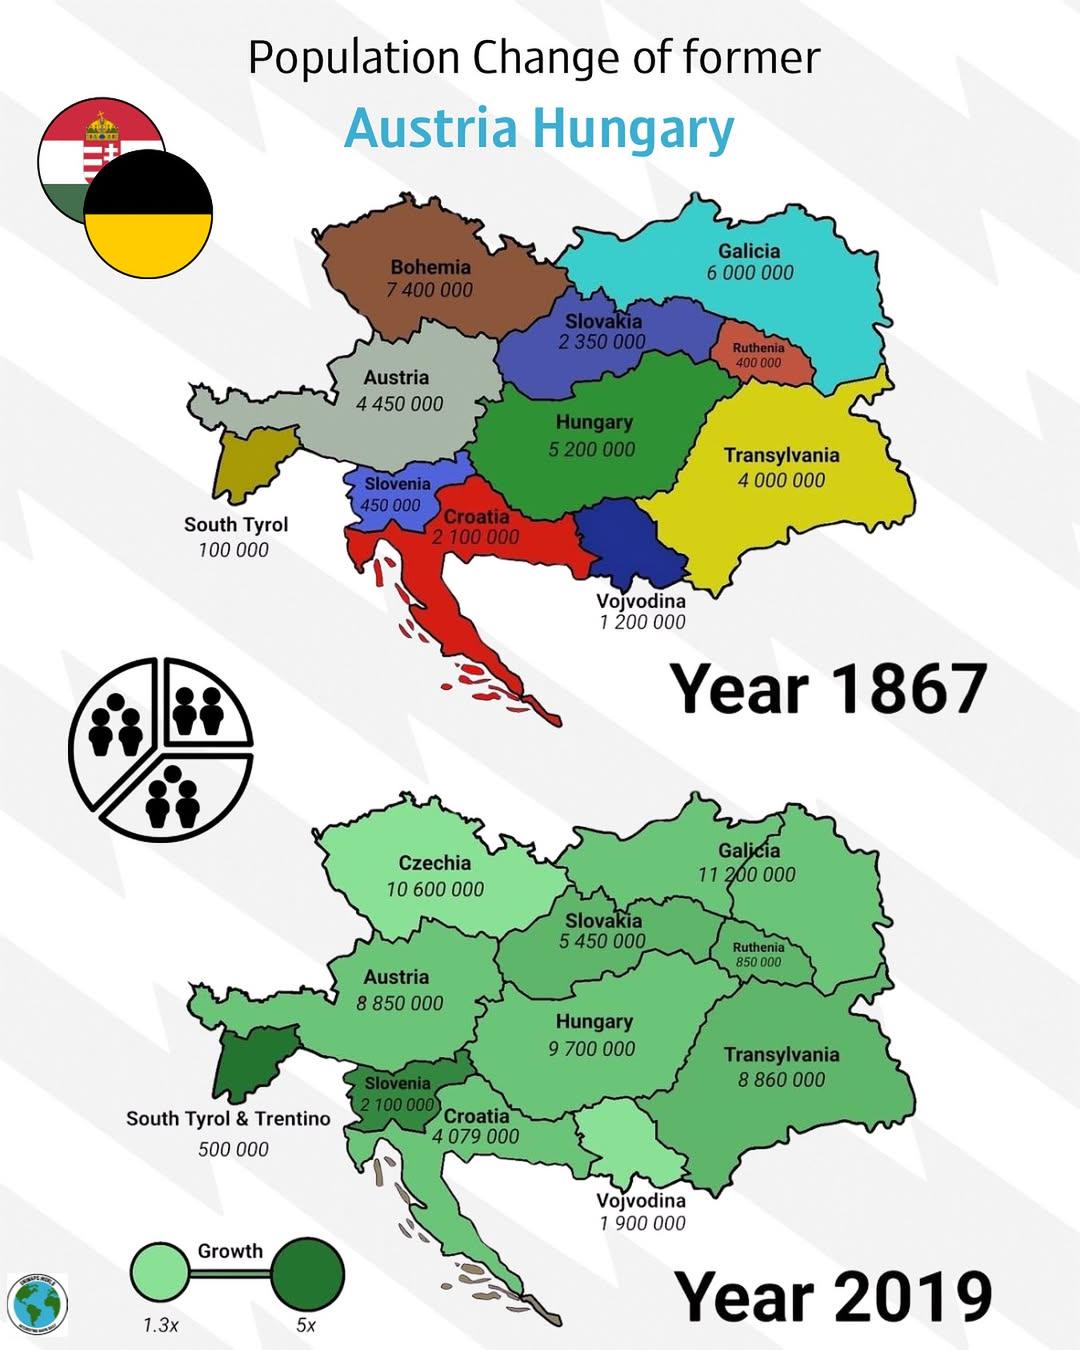
Population Growth Map of Austria-Hungary 1867 vs 2019
...
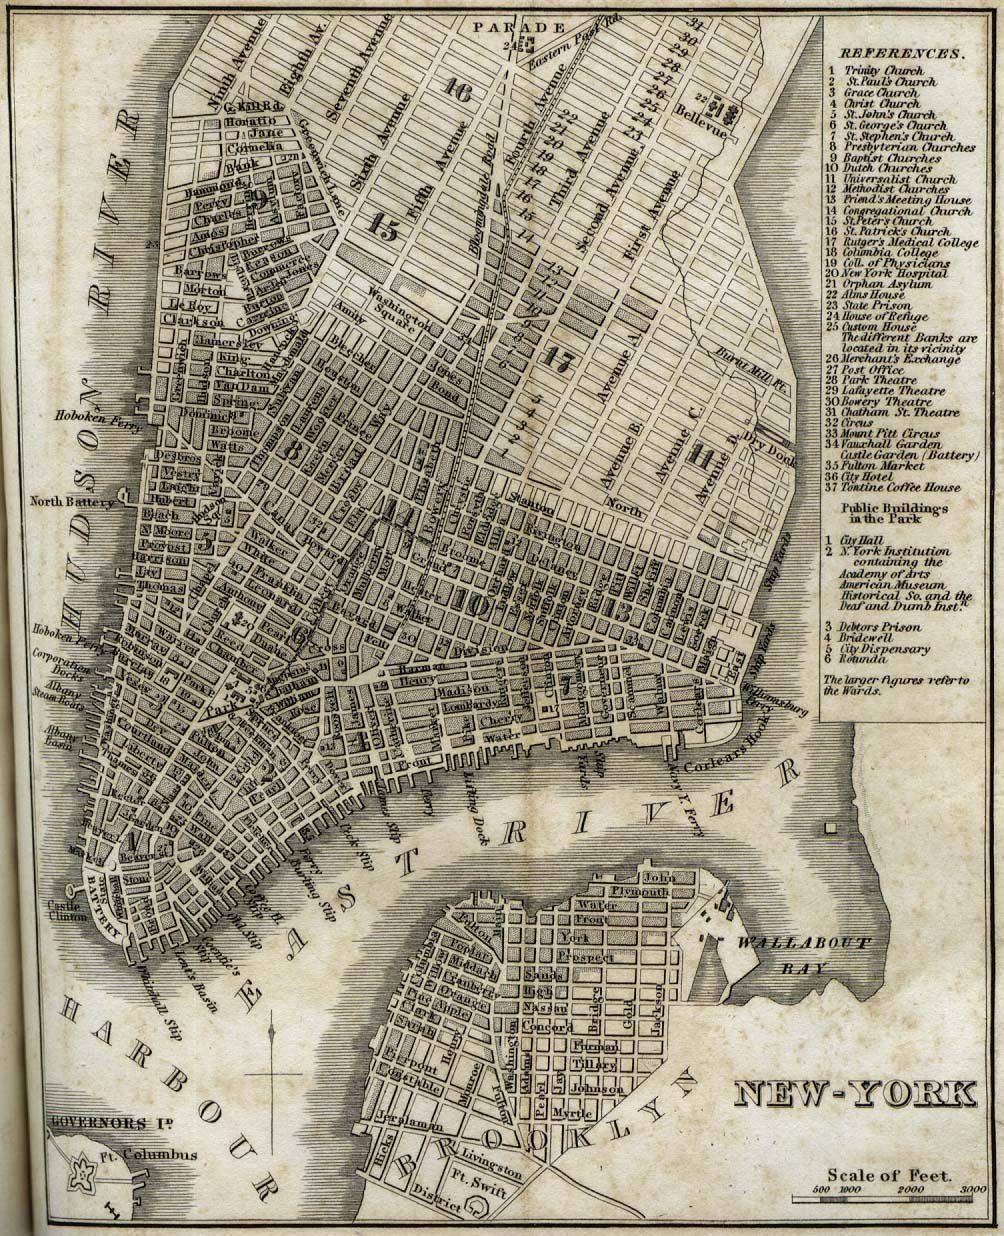
Map of New York City in 1842
The "New-York" map from 1842 by H.S. Tanner provides a detailed depiction of New York City during a transformative perio...
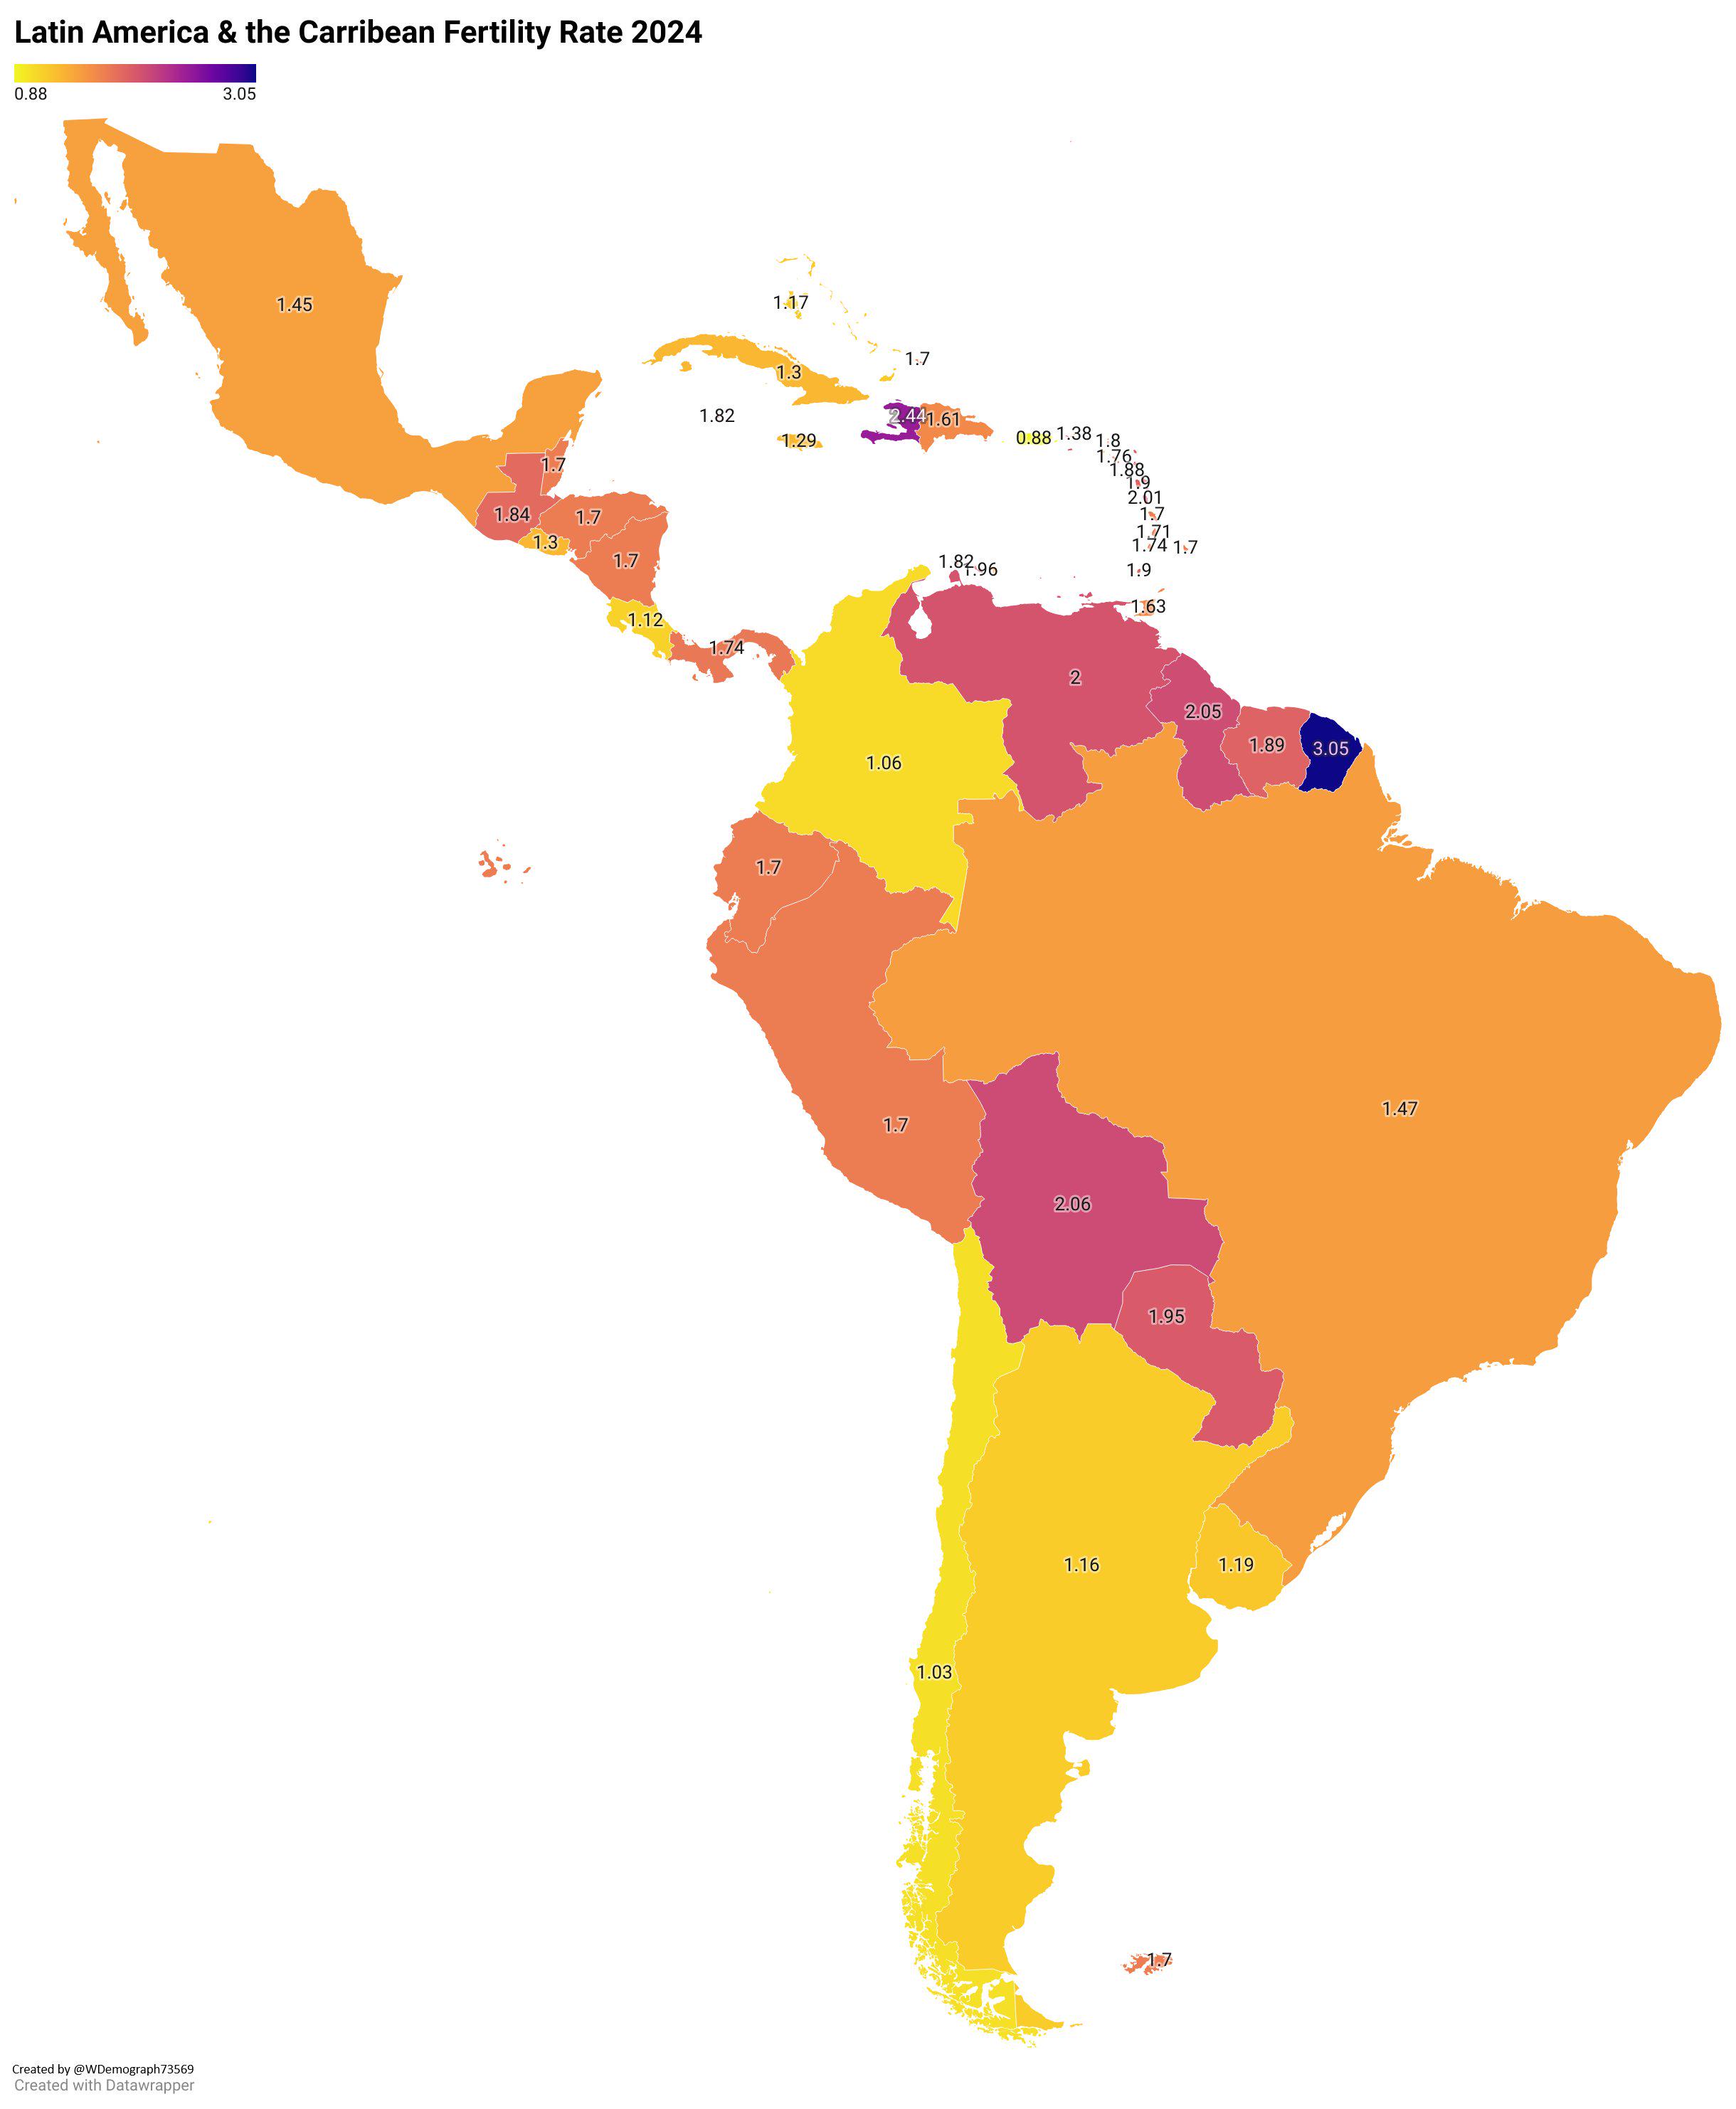
Fertility Rate Map of Latin America & The Caribbean 2024
The "Fertility Rate Map of Latin America & The Caribbean 2024" provides a clear visualization of the current fertility r...
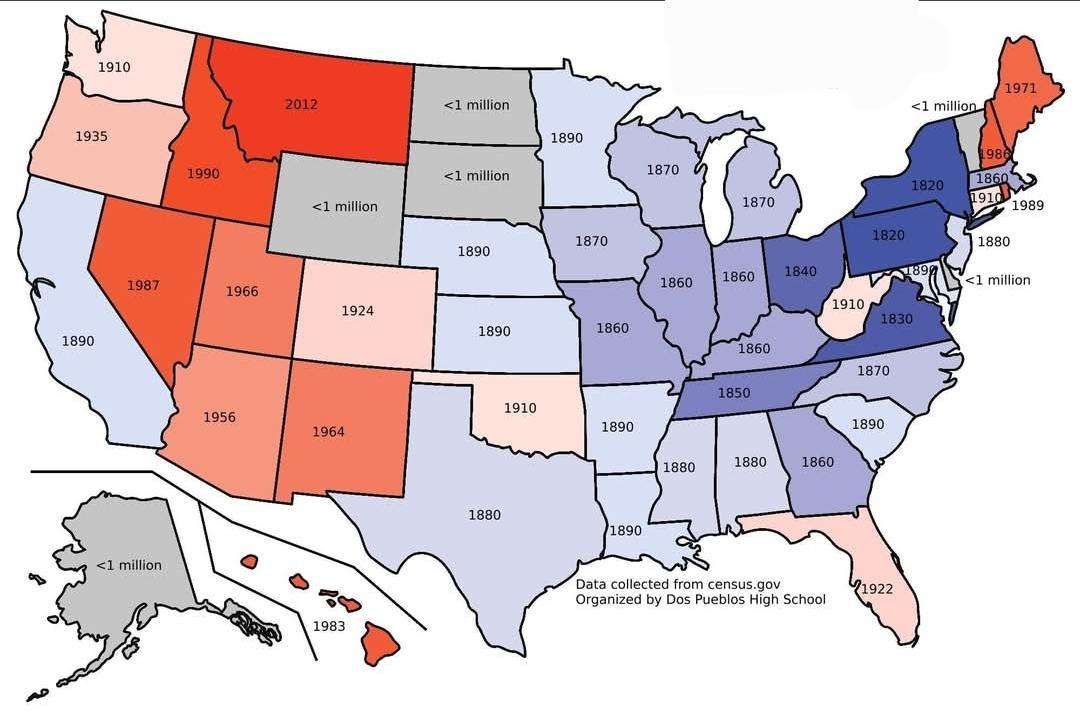
When Each State Population Exceeded 1 Million Map
The map titled "When Each State Population Exceeded 1 Million" visually represents the timeline of when each U.S. state ...
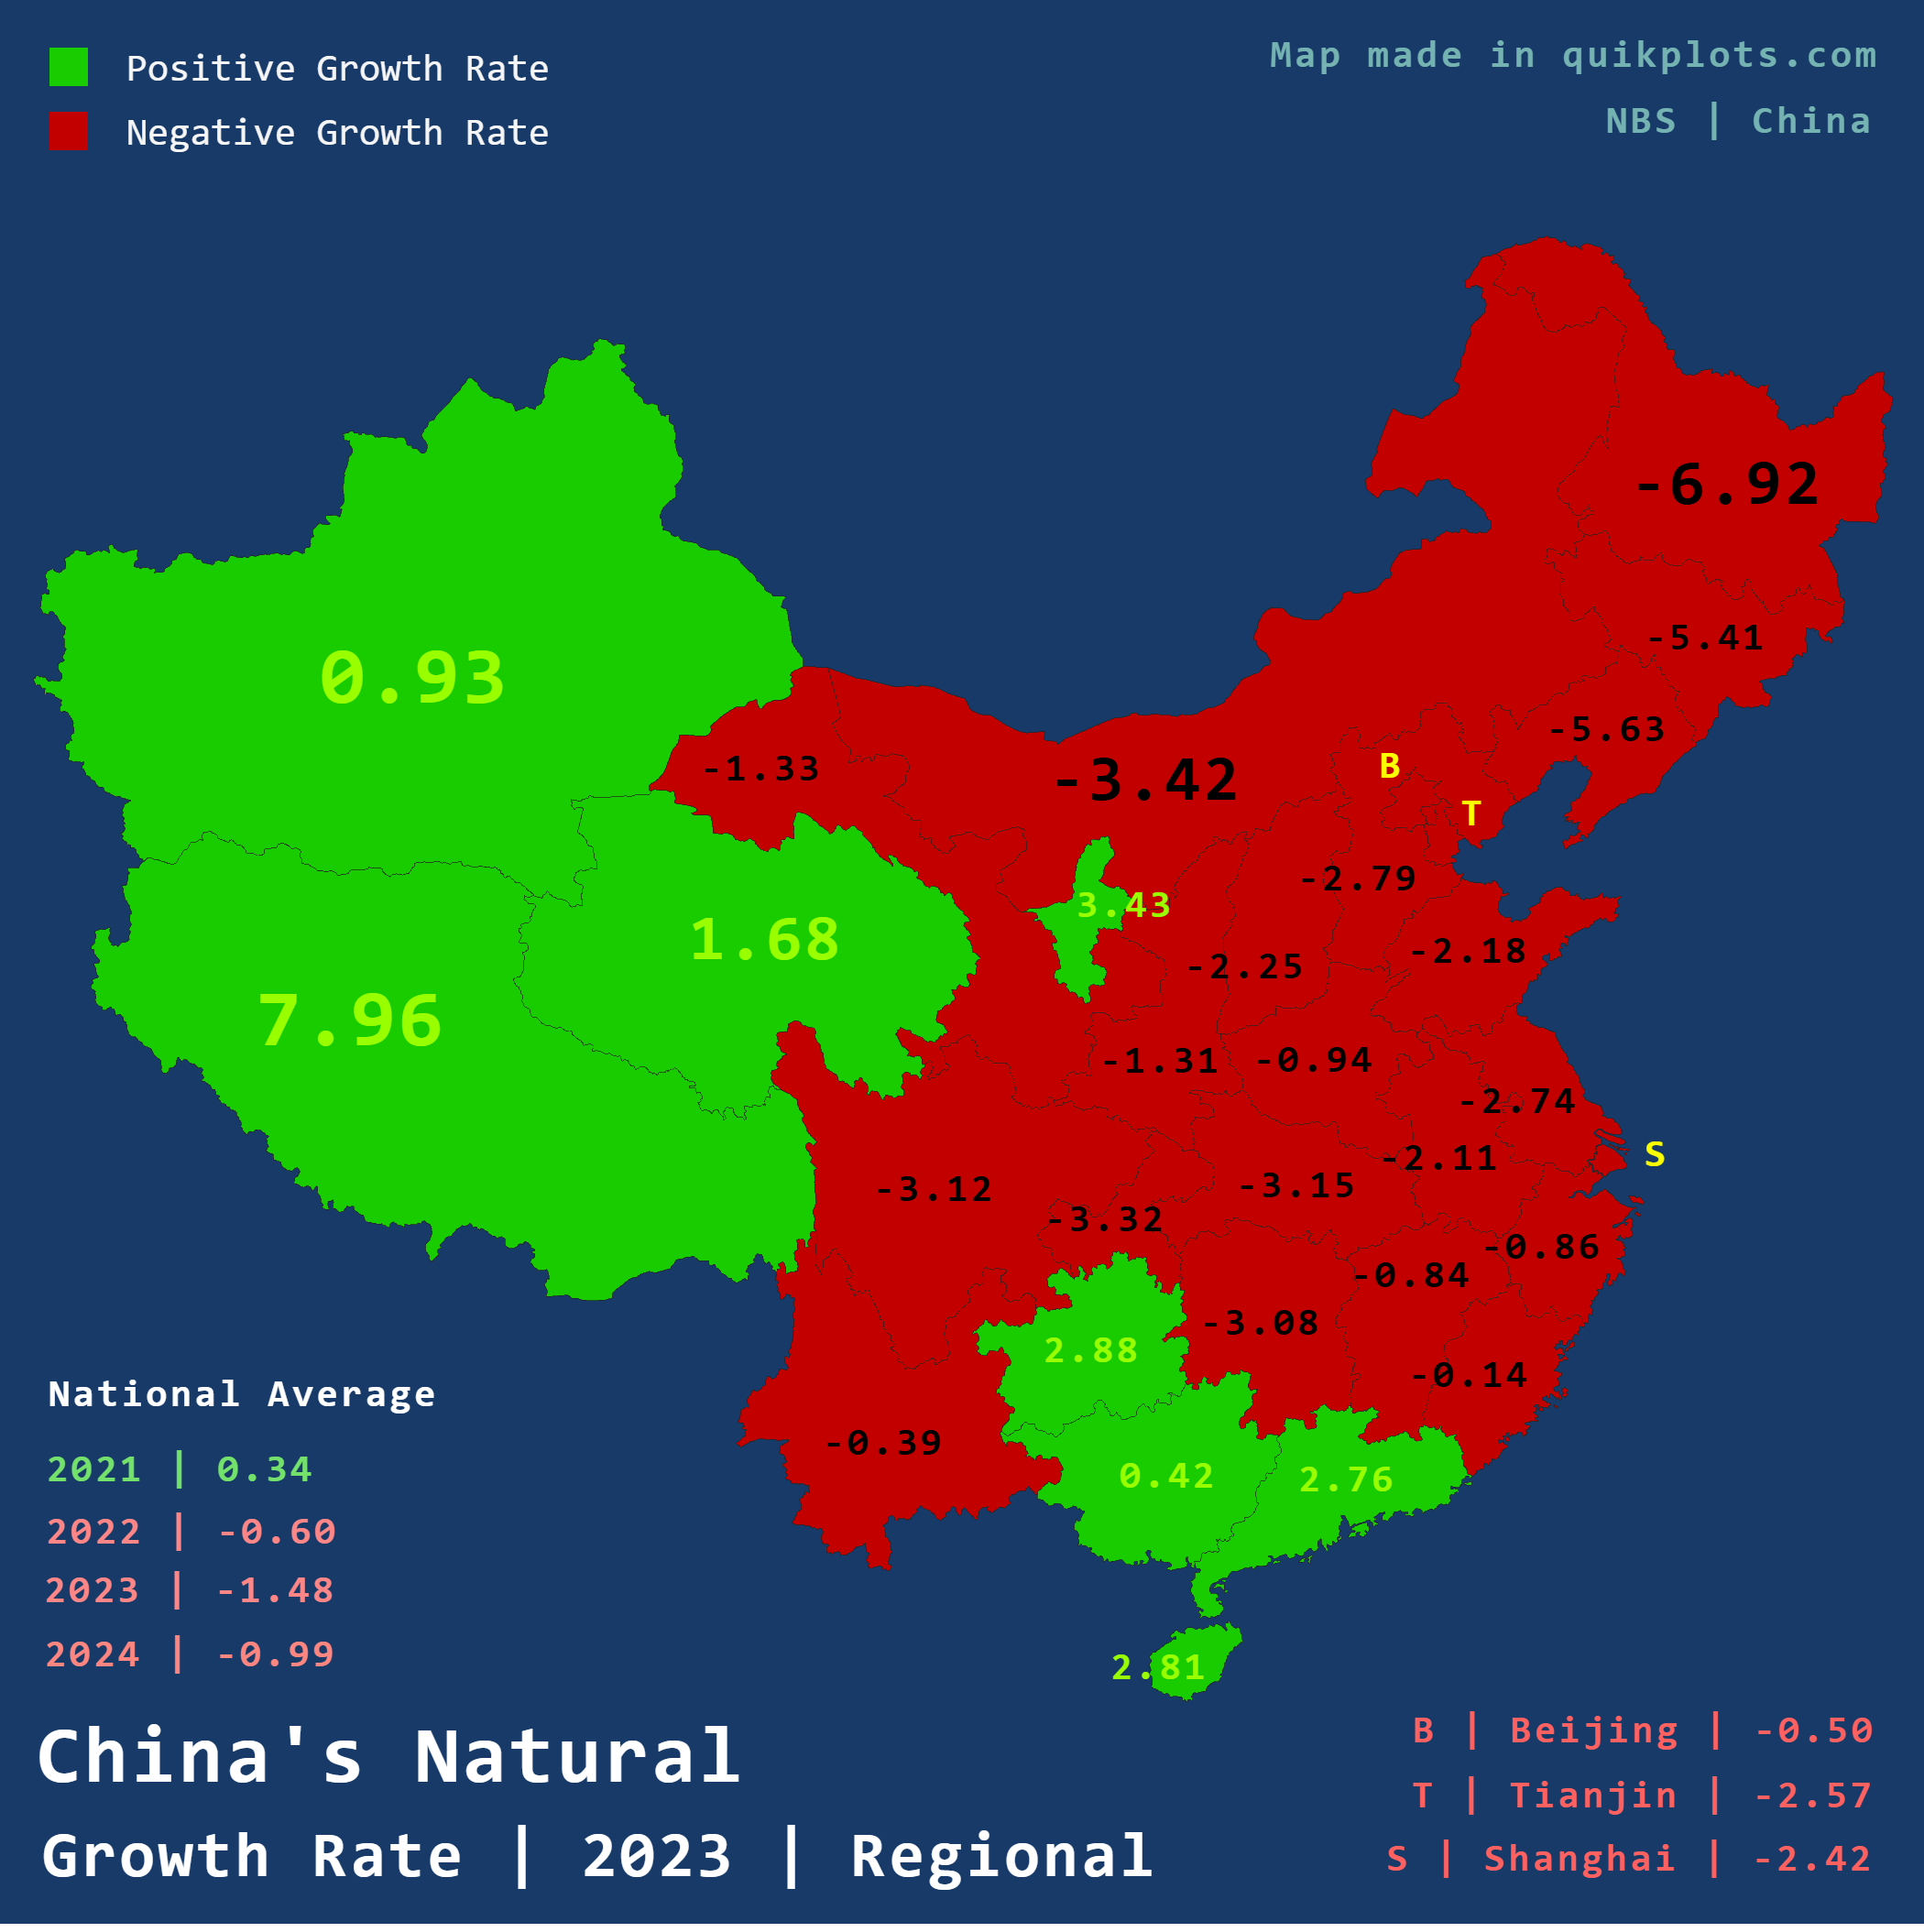
China's Population Growth Rate Map
The visualization titled "China's Population Growth Rate" provides a comprehensive look at the changing dynamics of popu...
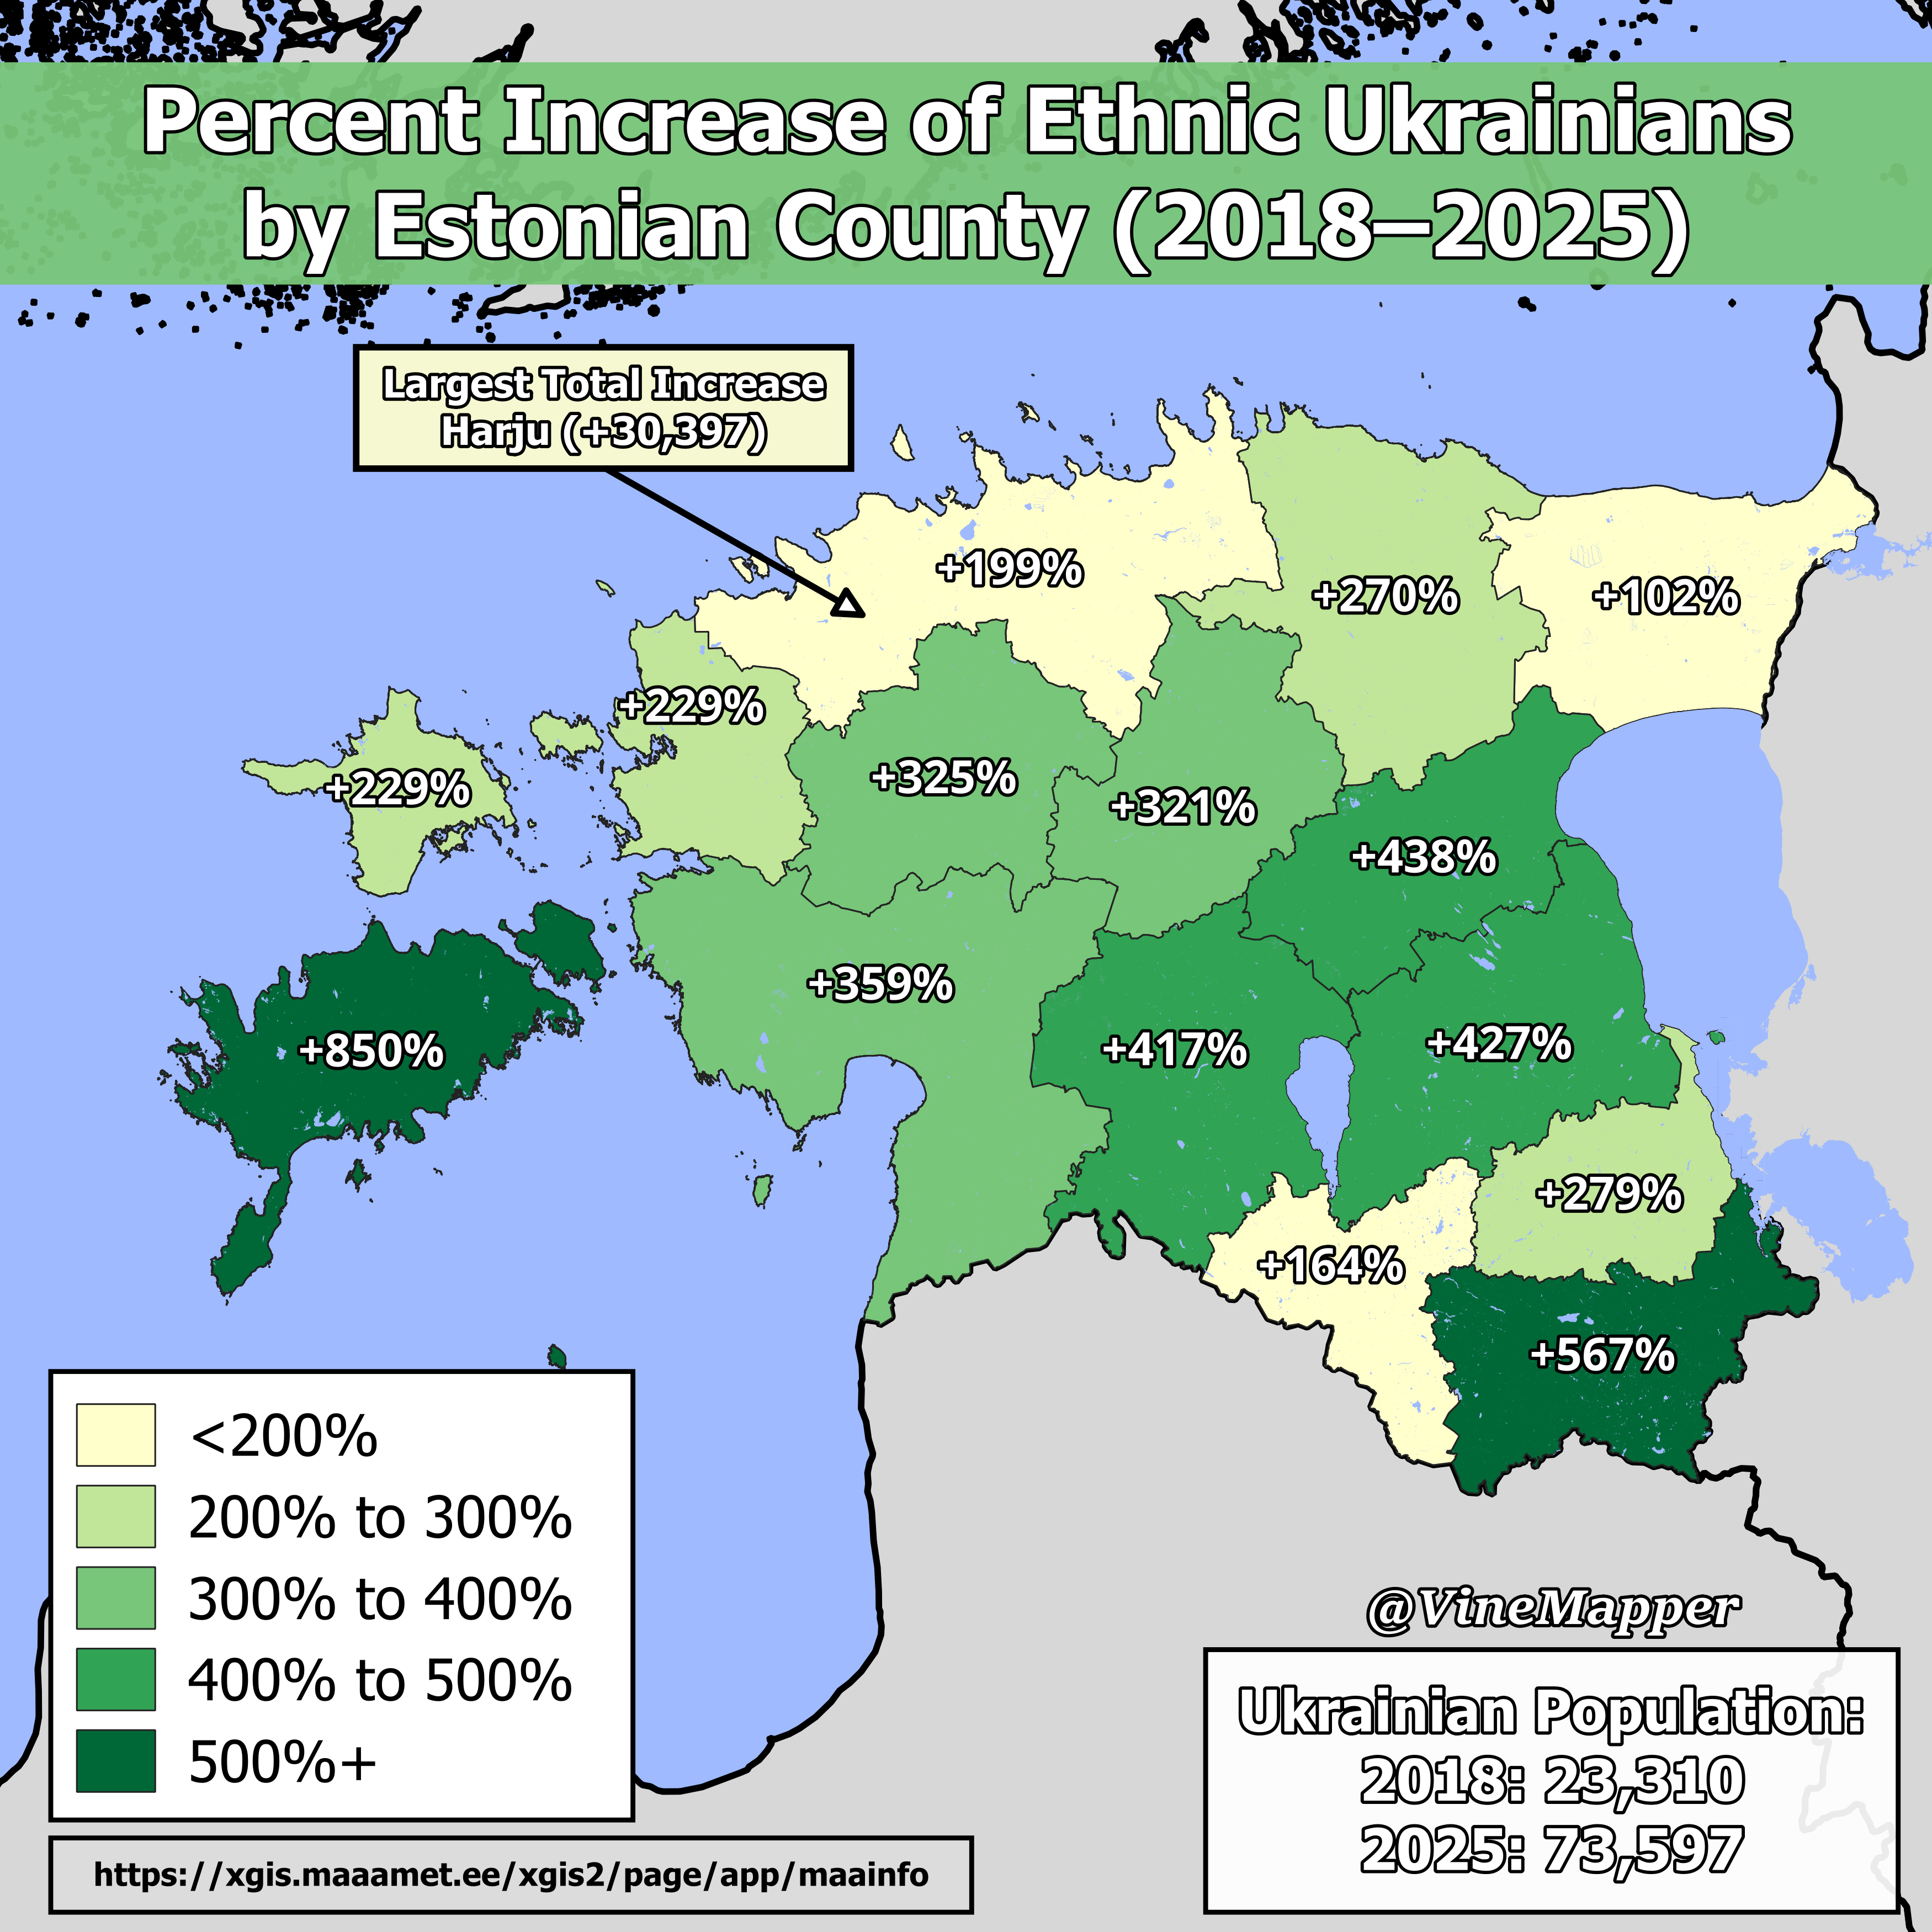
Percent Increase of Ethnic Ukrainians by Estonian County Map
The visualization titled "Percent Increase of Ethnic Ukrainians by Estonian County (2018–2025)" offers a detailed look a...
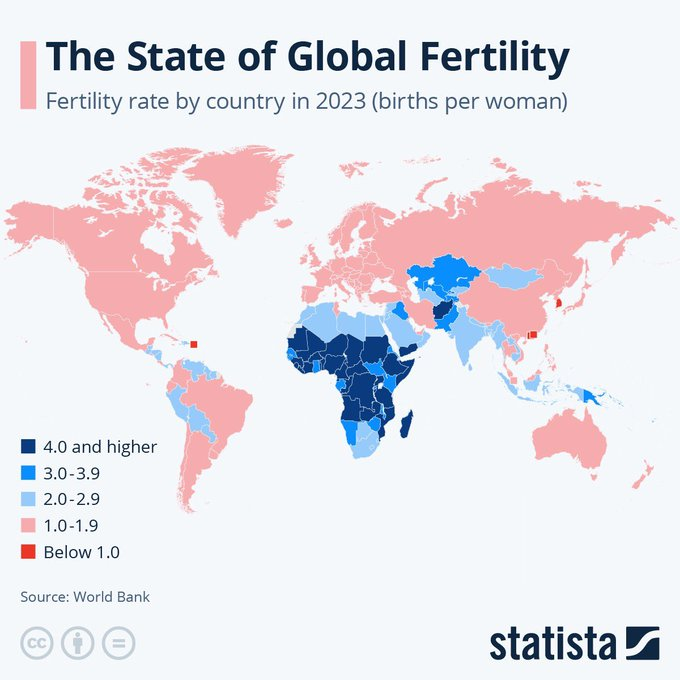
Global Fertility Rates Map
The "Global Fertility Rates Map" provides a comprehensive visualization of fertility rates across different countries an...
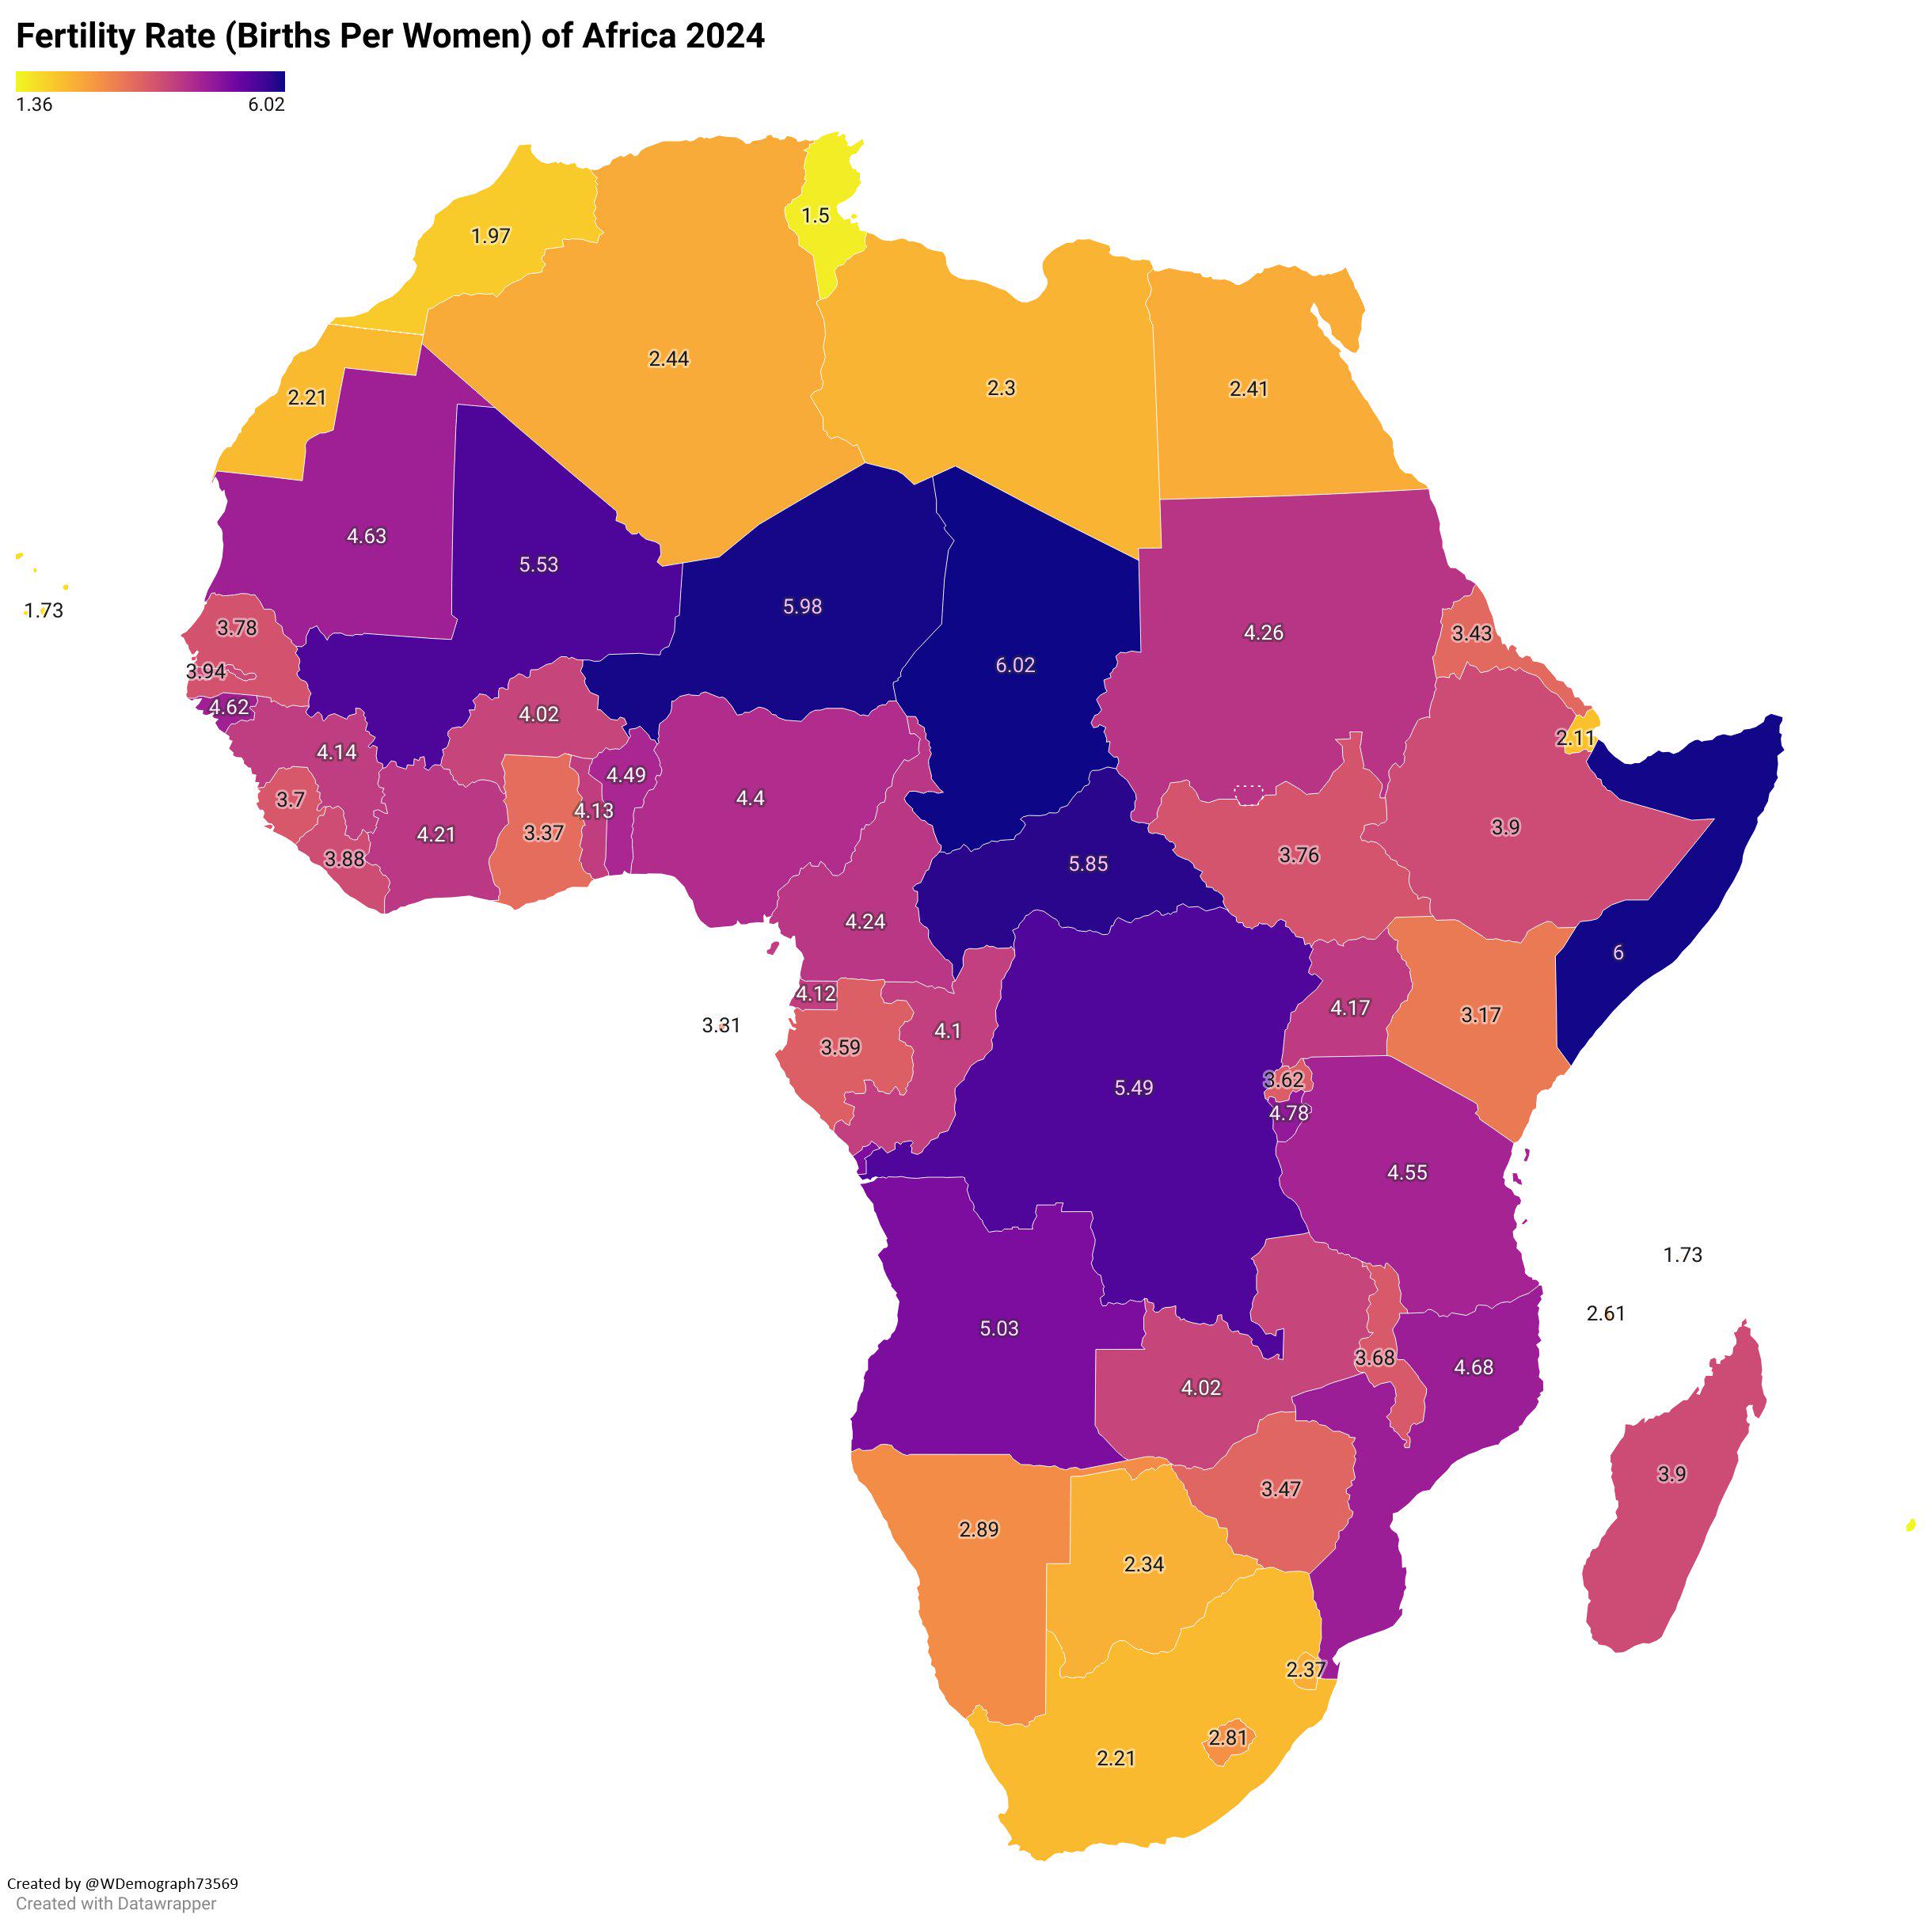
Fertility Rate of Africa 2024 Map
The "Fertility Rate of Africa 2024 Map" provides a comprehensive overview of the average number of children born per wom...
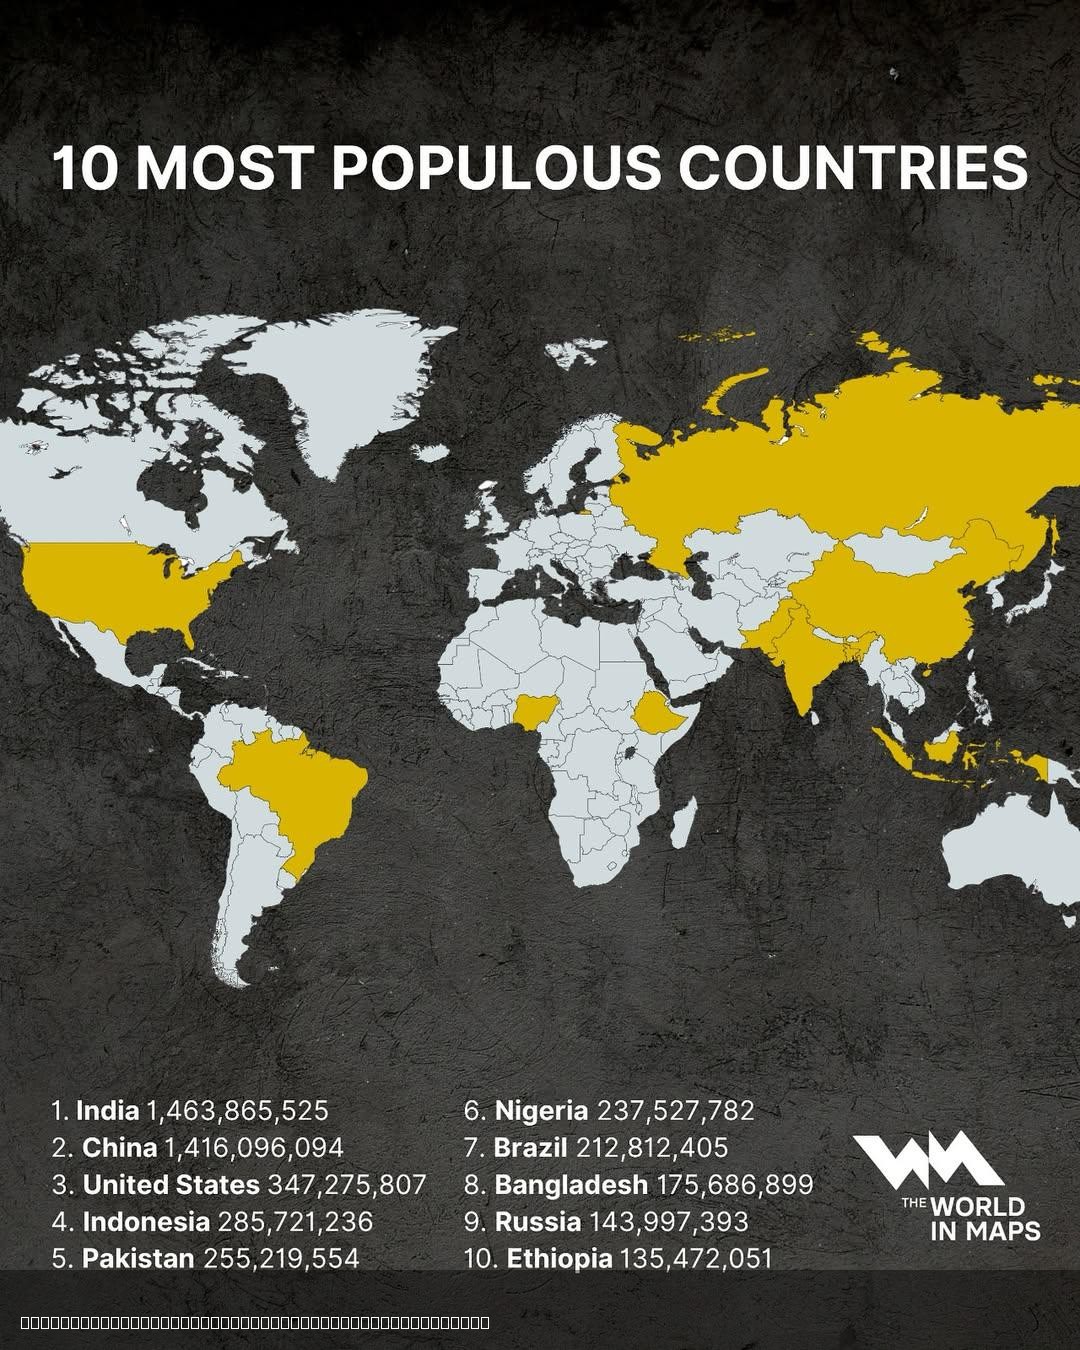
10 Most Populous Countries in the World Map
The "10 Most Populous Countries in the World Map" provides a clear visualization of the countries with the highest popul...
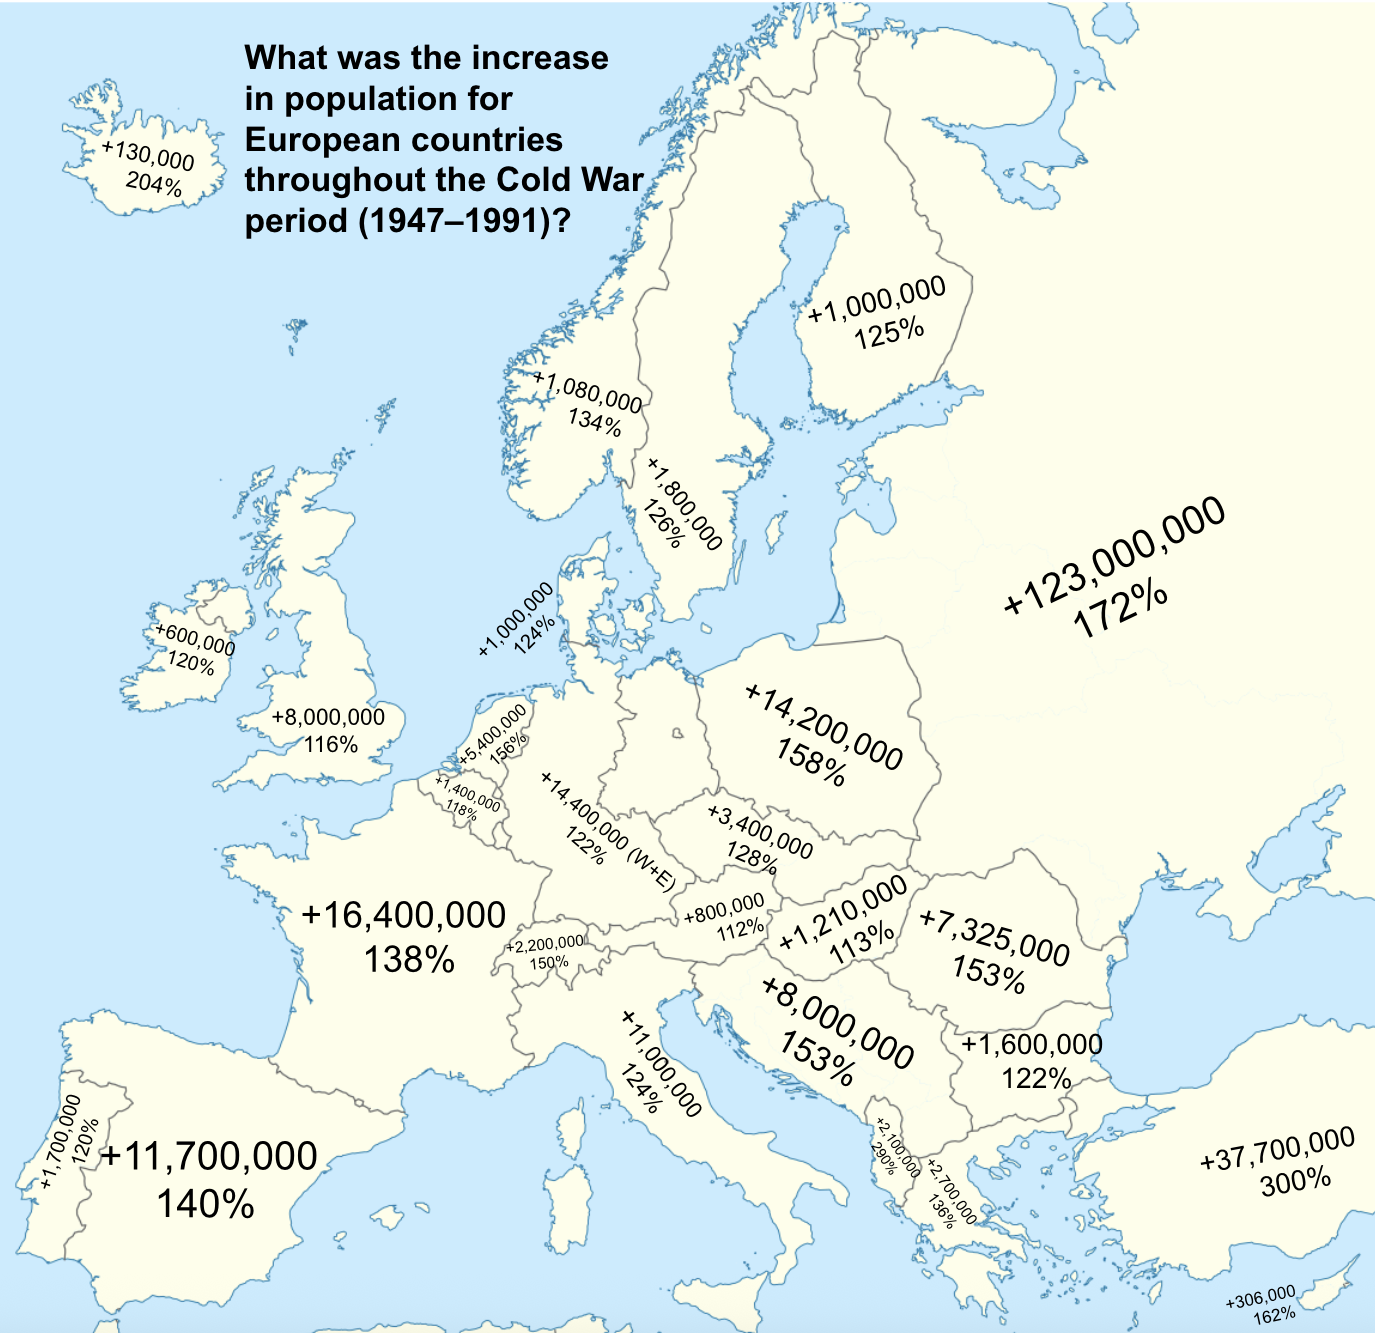
European Population Growth Map During Cold War
The map titled "What was the increase in population for European countries throughout the Cold War period (1947-1991)" v...
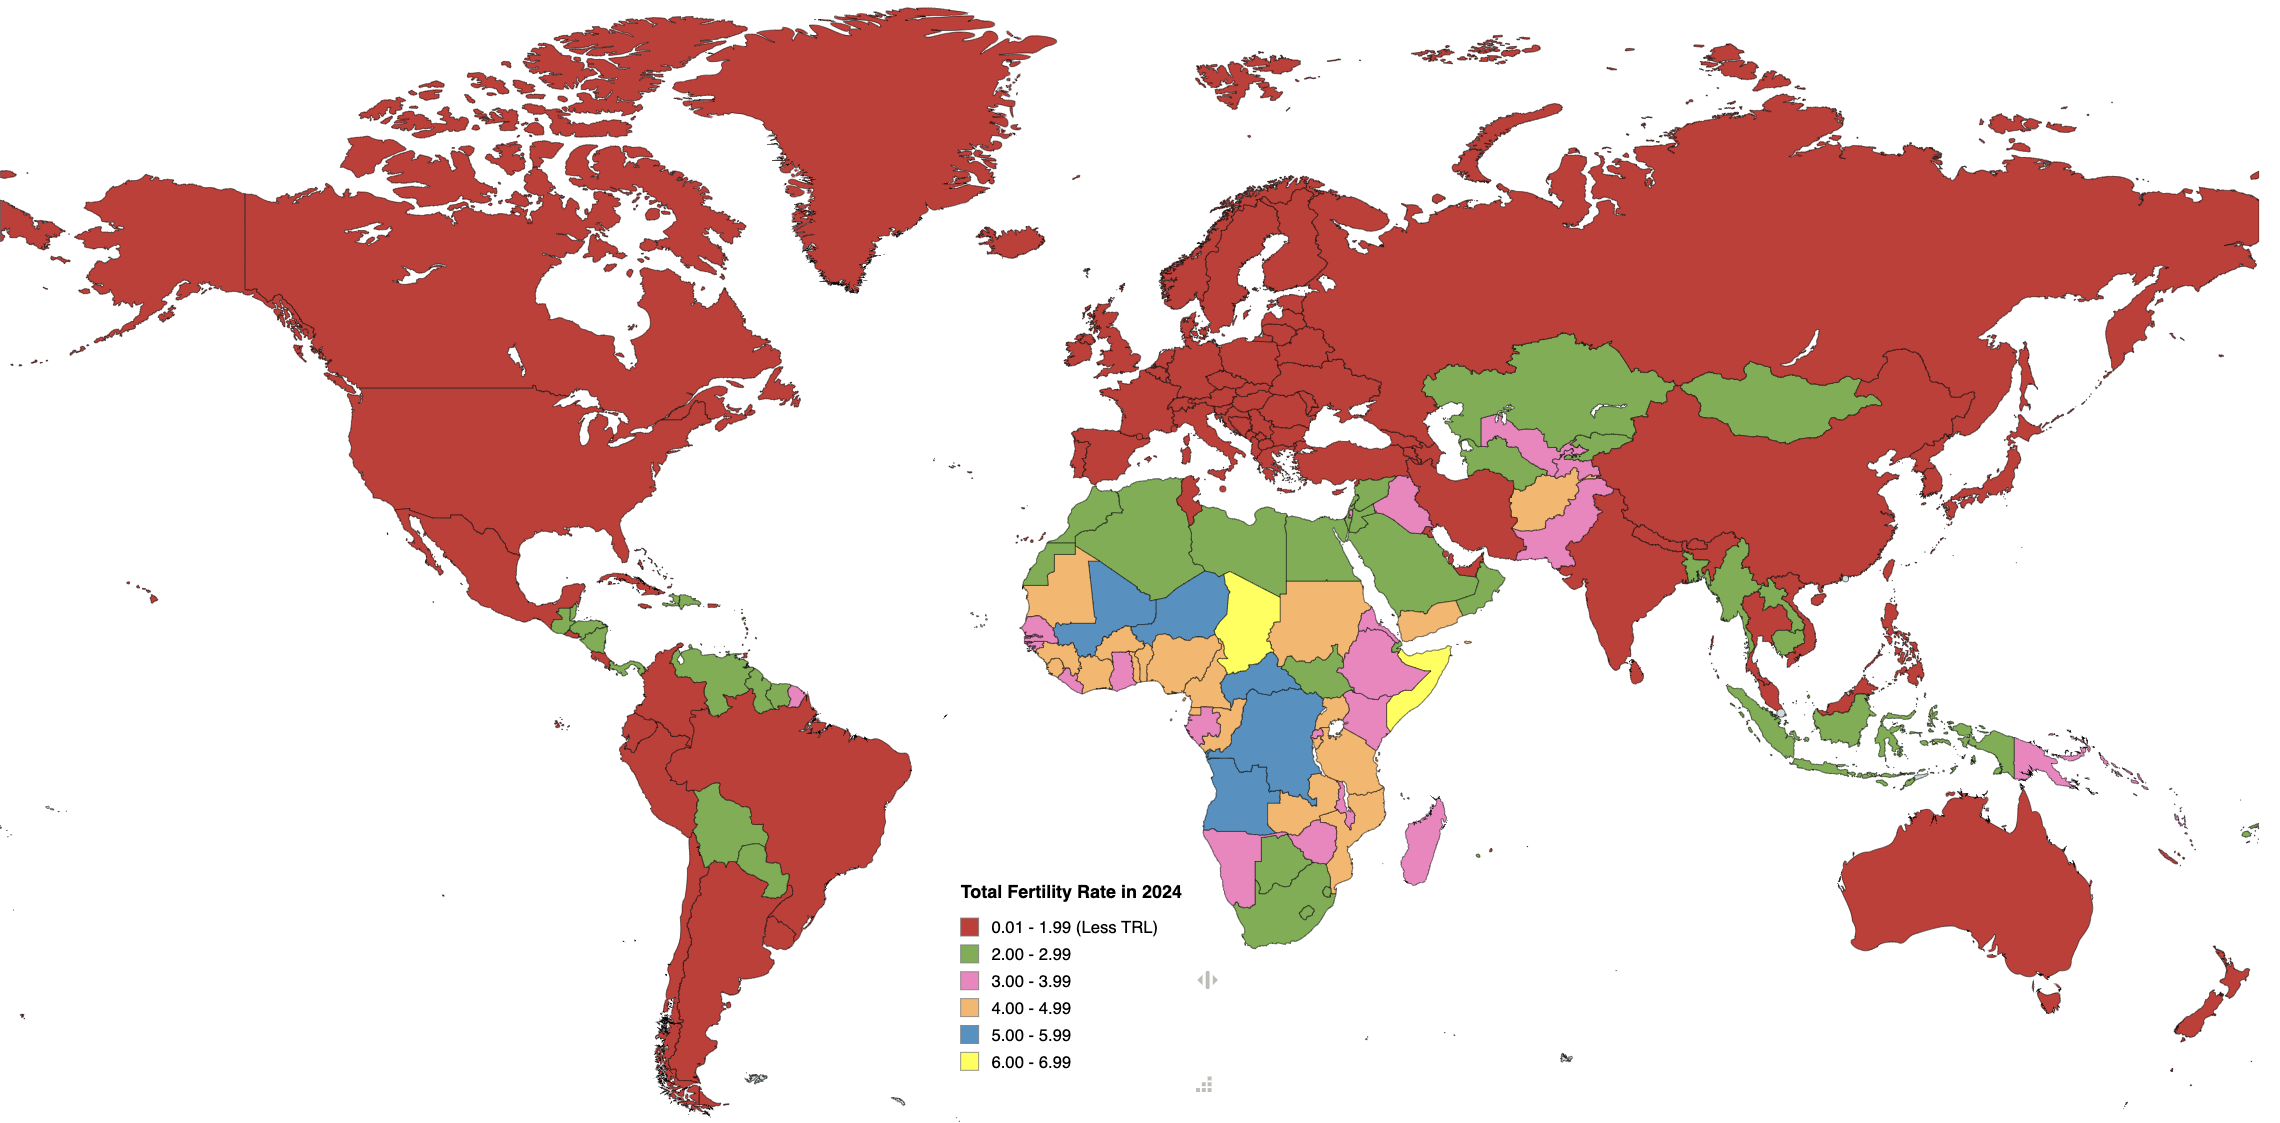
Fertility Rates by Country Map 2024
This map visually represents the fertility rates of countries around the globe, specifically highlighting those that are...
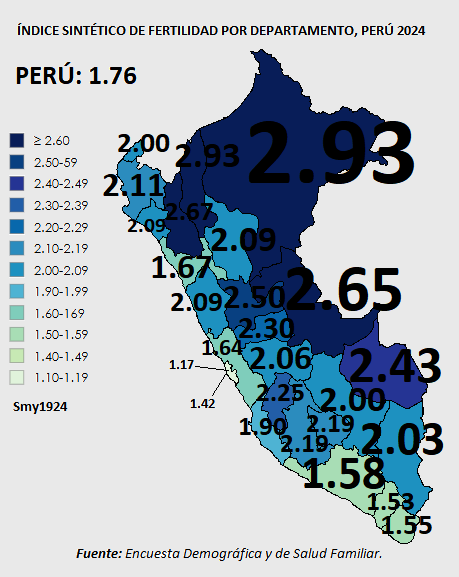
Total Fertility Rate Map of Peru 2024
The map titled "Total Fertility Rate (Children per Woman), Perú 2024" provides a visual representation of the average nu...
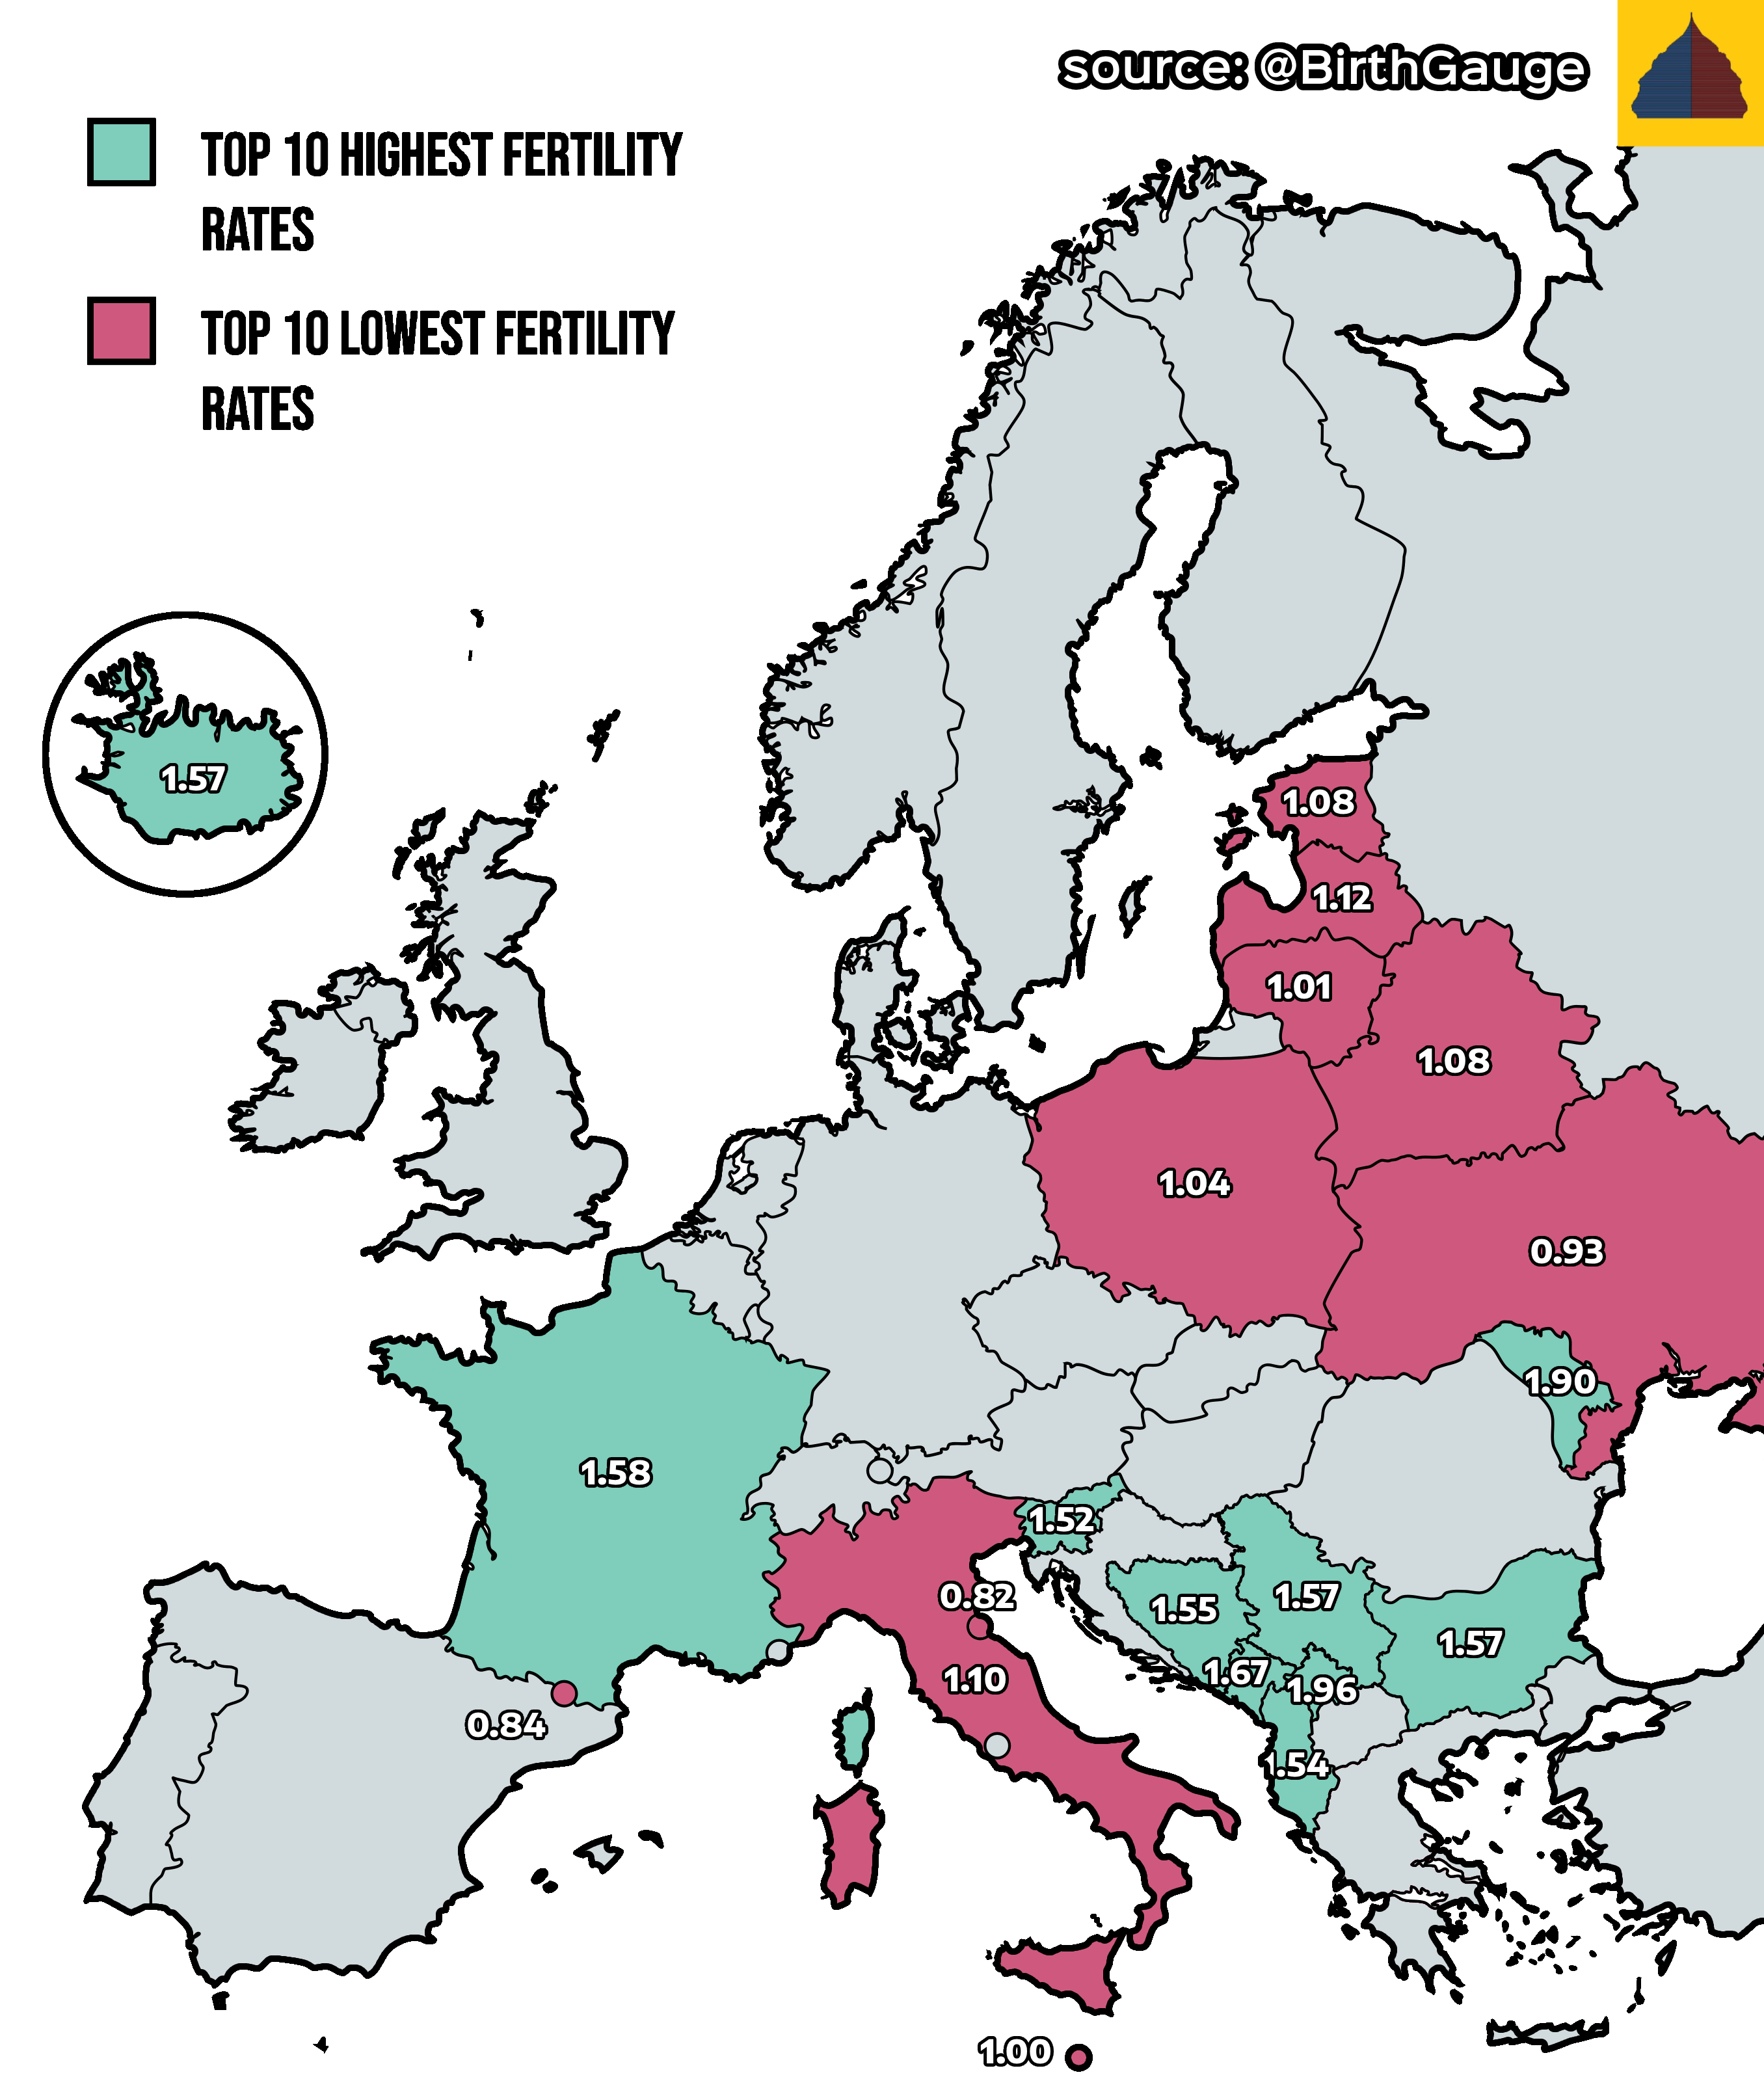
Europe’s Highest and Lowest Fertility Rates Map
The \...
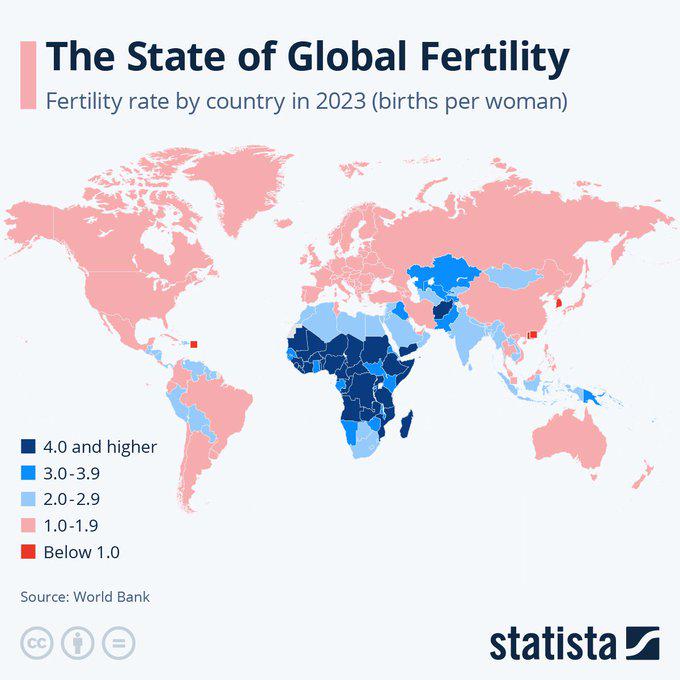
Global Fertility Rate Map
The "Global Fertility Rate Map" provides a visual representation of birth rates across various countries, illustrating t...
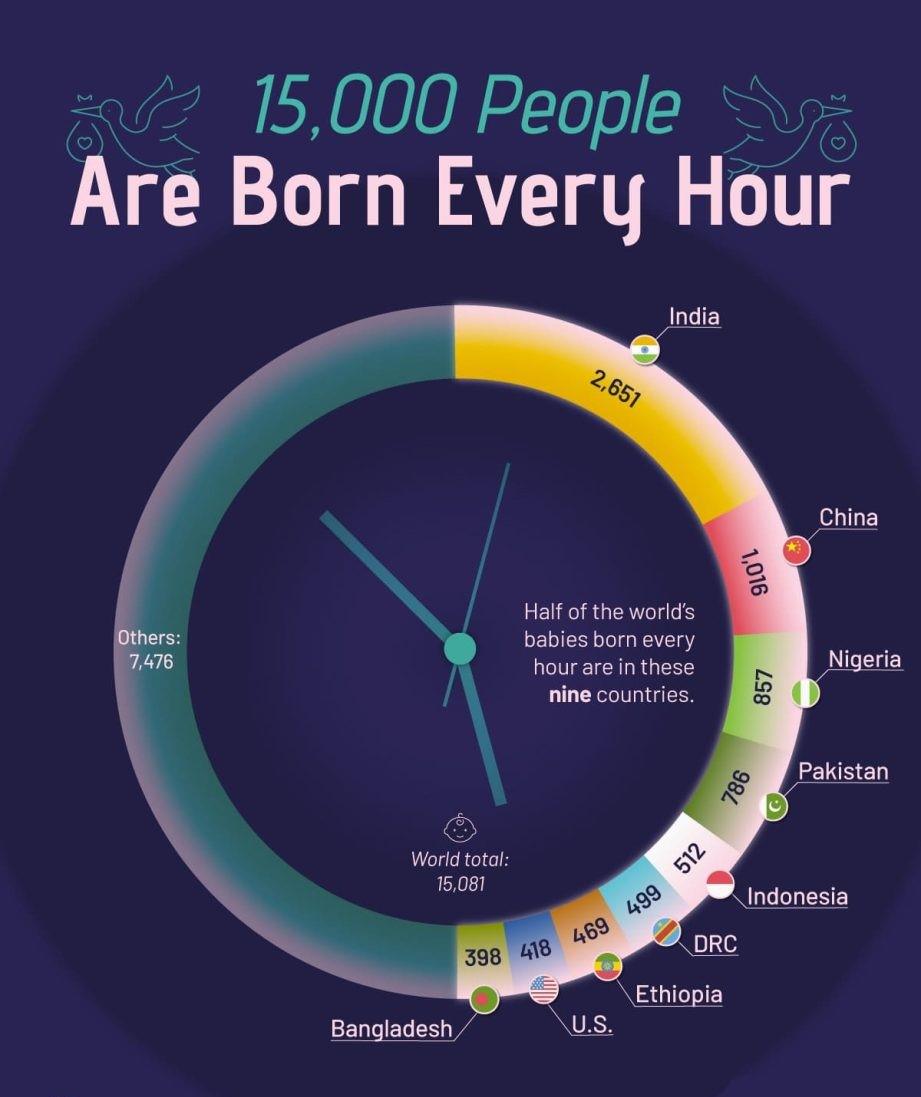
Map of Global Birth Rates by Country
This map illustrates a striking statistic: every hour, half of the world's babies are born in just nine countries. It’s ...