Electoral College Votes Forecast Map 2030

Marcus Rodriguez
Historical Geography Expert
Marcus Rodriguez specializes in historical cartography and geographic data analysis. With a background in both history and geography, he brings unique...
Geographic Analysis
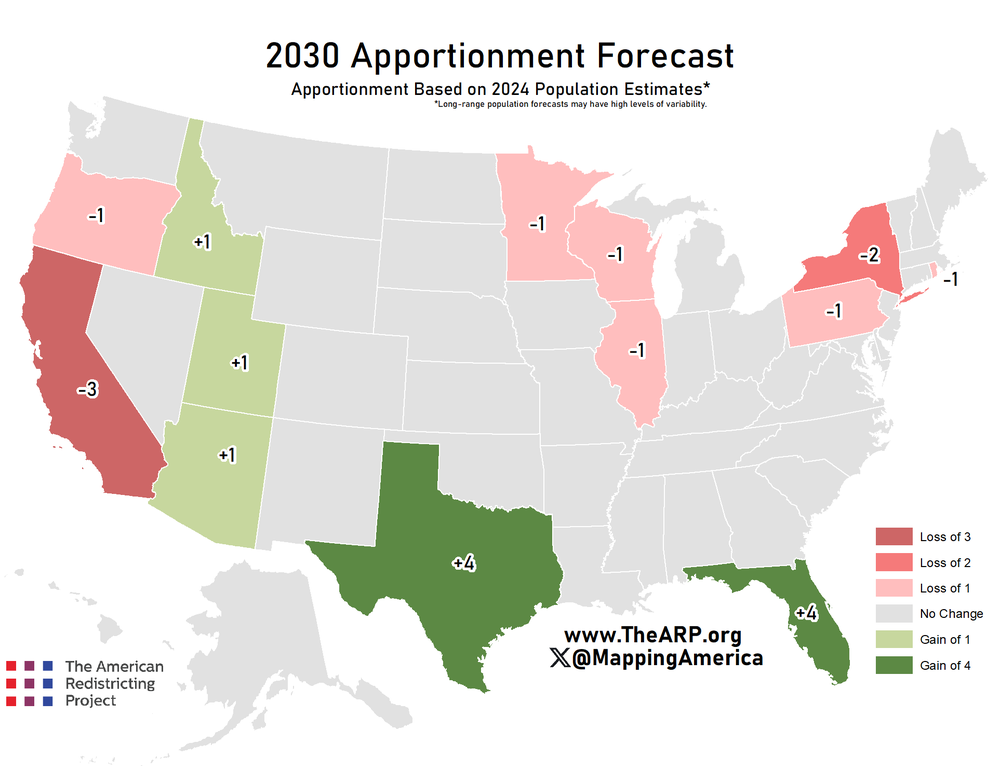
What This Map Shows
The "Forecast Apportionment of Electoral College Votes of 2030" map illustrates the projected distribution of electoral college votes across the United States for the upcoming presidential elections. This visualization is crucial for understanding how shifts in population demographics, state population growth, and census data will impact electoral representation in the near future. As we approach 2030, demographics are changing, and this map provides a snapshot of how these changes may influence the political landscape of the nation.
Deep Dive into Electoral College Votes
The Electoral College is a unique component of the American political system, established by the Constitution. Each state is allocated a number of electoral votes based on its population, with a total of 538 votes available. A candidate needs a majority of these votes, 270, to win the presidency. The apportionment of electoral votes occurs every ten years after the census, which counts the population of each state.
What's fascinating is that population growth isn't uniform across the country. States like Texas and Florida have experienced significant growth due to factors such as migration, economic opportunities, and favorable climates. Conversely, states in the Northeast and Midwest, such as New York and Illinois, have seen population stagnation or decline. This shift not only affects the number of electoral votes but also has broader implications for political power and resource allocation.
Interestingly, the 2020 Census revealed that southern and western states gained a total of seven electoral votes, while states in the Midwest and Northeast lost a combined total of six. For example, Texas gained two additional electoral votes, bringing its total to 40, while California, despite being the most populous state, lost a seat for the first time in history, dropping to 54 electoral votes. This reflects broader demographic trends where people are relocating from high-cost, densely populated areas to regions offering more affordable housing and job opportunities.
States like Arizona and Georgia have also become battlegrounds in recent elections, showing how demographic shifts can change the political dynamics traditionally held by one party. For instance, increasing Hispanic populations in these states have contributed to changing electoral behaviors, making them pivotal in determining election outcomes.
Regional Analysis
When examining the map's forecasts, it becomes evident that the South and West regions are poised to gain electoral votes, while the Northeast and parts of the Midwest are likely to see reductions. For instance, Texas, Florida, and North Carolina are not just gaining votes; they are becoming increasingly influential in shaping national policies.
In the South, Texas's growth is not just about numbers; it's about cultural shifts and the rising importance of urban centers like Austin and Dallas. These cities are attracting younger populations, tech industries, and diverse communities. Florida, with its booming tourism and retirement sectors, continues to draw new residents, enhancing its electoral influence.
On the other hand, states like Ohio and Pennsylvania have experienced population declines, leading to a reduction in their electoral power. For example, Ohio, which once had 18 electoral votes, dropped to 17, reflecting its stagnating population growth. This shift could lead to a diminished role in national politics, as candidates might spend less time campaigning in states that have fewer electoral votes.
Significance and Impact
The implications of these electoral changes are profound. As states gain or lose electoral votes, the balance of power in the federal government can shift significantly. This can affect policies ranging from healthcare to immigration, as regions with more electoral votes tend to have greater political influence.
Moreover, these shifts indicate broader trends in American society, including urbanization, economic migration, and demographic changes. As younger generations move to urban areas, traditional power bases in rural states may find themselves increasingly sidelined. This could lead to a more polarized political environment, where the interests of urban populations are at odds with those of rural communities.
Looking ahead to 2030 and beyond, understanding these trends is crucial for policymakers, political strategists, and citizens alike. The map serves as a reminder that every ten years, with the census, the landscape of American politics can change dramatically. As we prepare for the coming elections, keeping an eye on these shifts will be essential for everyone engaged in the democratic process.
Visualization Details
- Published
- October 11, 2025
- Views
- 58
Comments
Loading comments...