Map of New York City in 1842

David Chen
Data Visualization Specialist
David Chen is an expert in transforming complex geographic datasets into compelling visual narratives. He combines his background in computer science ...
Geographic Analysis
What This Map Shows
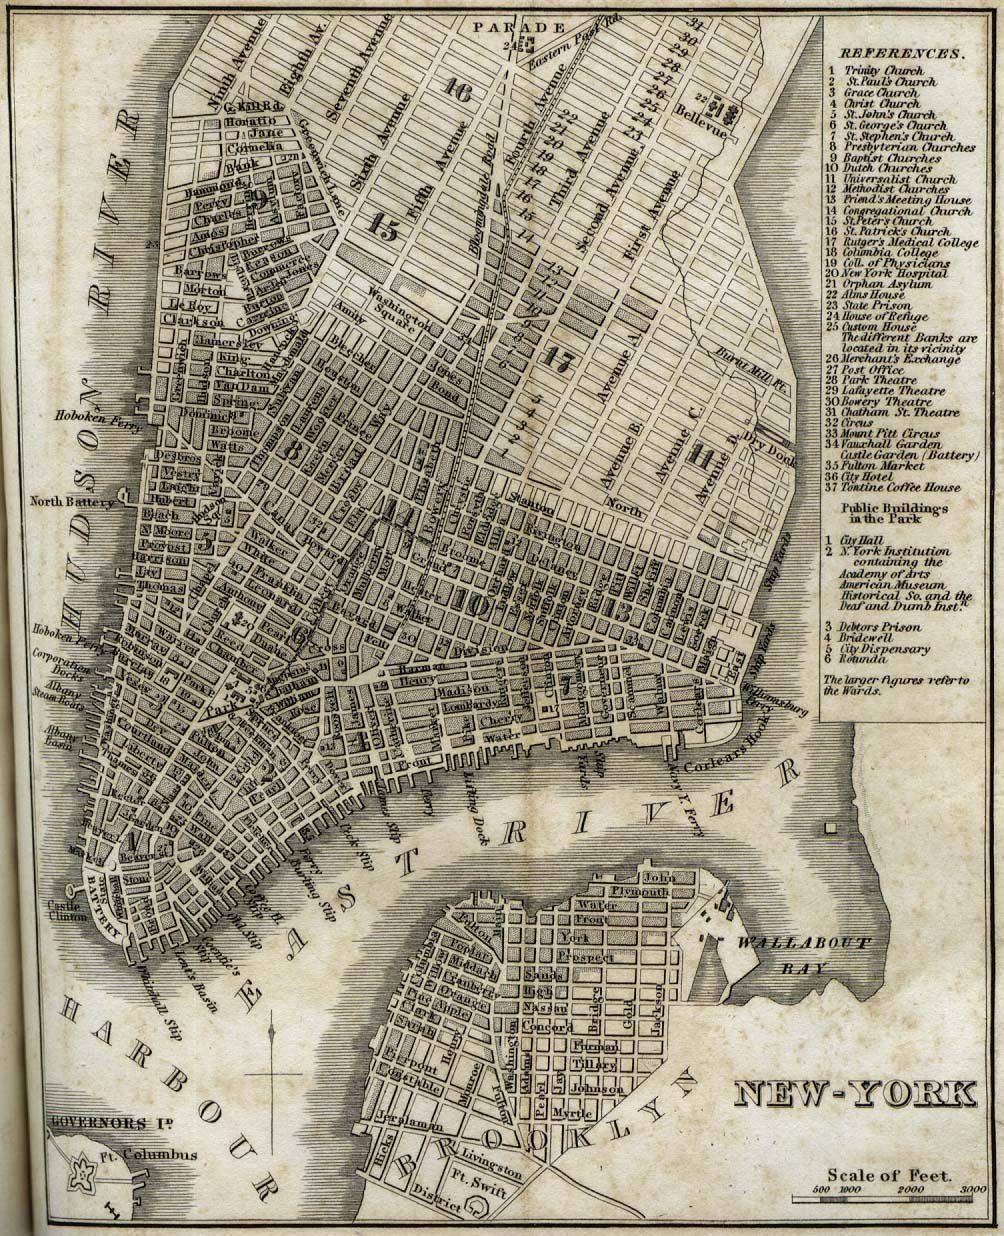
The "New-York" map from 1842 by H.S. Tanner provides a detailed depiction of New York City during a transformative period in its history. This visualization highlights the city's layout, major streets, landmarks, and the beginnings of urban development as it was known at the time. The map captures a city on the brink of significant changes, as it was starting to expand beyond its original boundaries and embrace a more structured urban plan.
Deep Dive into Urban Development in 1842
Have you ever wondered how cities evolve over time? New York City in the early 19th century was experiencing rapid growth due to various factors, including immigration, trade, and industrialization. By 1842, New York was not only a bustling port but also a vibrant center of commerce and culture. The population was nearing 300,000, making it the largest city in the United States and a magnet for those seeking opportunities.
Interestingly, the map reveals key features of urban life at the time. The grid system, which would later define the city's layout, was already taking shape in areas like Manhattan, where streets such as Broadway and Wall Street were prominent. This grid was a product of the Commissioners' Plan of 1811, which aimed to organize the growing city and reduce the chaos of earlier developments.
The map also showcases the presence of parks, like the then-newly established Battery Park, which served as a social space for residents and visitors alike. The city's waterfront was bustling with activity, with docks and piers facilitating trade and transportation. The East and Hudson Rivers were crucial for commerce, serving as major transportation routes for goods entering and leaving the city.
As industries emerged, neighborhoods began to form around these economic hubs. The Bowery, for instance, was known for its theaters and entertainment venues, while areas like Five Points became notorious for their social challenges. The juxtaposition of wealth and poverty was stark, reflecting the complexities of urban life during this period.
Regional Analysis
Examining the map closely, we can break down New York City into several regions that highlight different aspects of urban development.
In Lower Manhattan, the docks and shipping areas indicate the city's reliance on maritime trade. The presence of warehouses and markets signifies an economy deeply tied to import and export activities. In contrast, as we move northward, the map shows streets lined with residential buildings that indicate an influx of new residents. Neighborhoods like Greenwich Village and the Bowery were becoming more populated, showcasing the diverse social fabric of the city.
Interestingly, the map also reflects the socio-economic divides present in the city. Areas closer to the waterfront were more industrial and commercial, while neighborhoods further inland were predominantly residential. This division would continue to shape the city’s socio-economic landscape for generations to come.
Significance and Impact
Understanding New York City in 1842 is crucial for grasping the broader trends that have shaped modern urban centers. During this period, the foundation for what would become a global city was being laid. The rapid growth of the population and the expansion of industries set the stage for significant infrastructural developments in the coming decades, including the construction of the subway system and the rise of skyscrapers.
Moreover, this map serves as a historical snapshot of urbanization processes that are still relevant today. The challenges faced by cities—such as housing shortages, infrastructure strain, and socio-economic disparities—can trace their roots back to this period of rapid expansion.
Looking towards the future, urban planners and geographers often refer back to historical maps like Tanner's to understand the evolution of urban spaces. By analyzing patterns of growth, we can better prepare for the challenges of modern city life, ensuring that the lessons learned from the past inform sustainable development strategies.
In conclusion, the "New-York" map from 1842 is more than just a visual representation of a city; it encapsulates a pivotal moment in its history. The interplay of commerce, culture, and urban planning during this era laid the groundwork for the dynamic metropolis we know today, reminding us of the enduring impact of geography on the evolution of urban life.
Visualization Details
- Published
- October 18, 2025
- Views
- 42
Comments
Loading comments...