Fertility Rates in US and Canada 2024 Map

Marcus Rodriguez
Historical Geography Expert
Marcus Rodriguez specializes in historical cartography and geographic data analysis. With a background in both history and geography, he brings unique...
Geographic Analysis
What This Map Shows
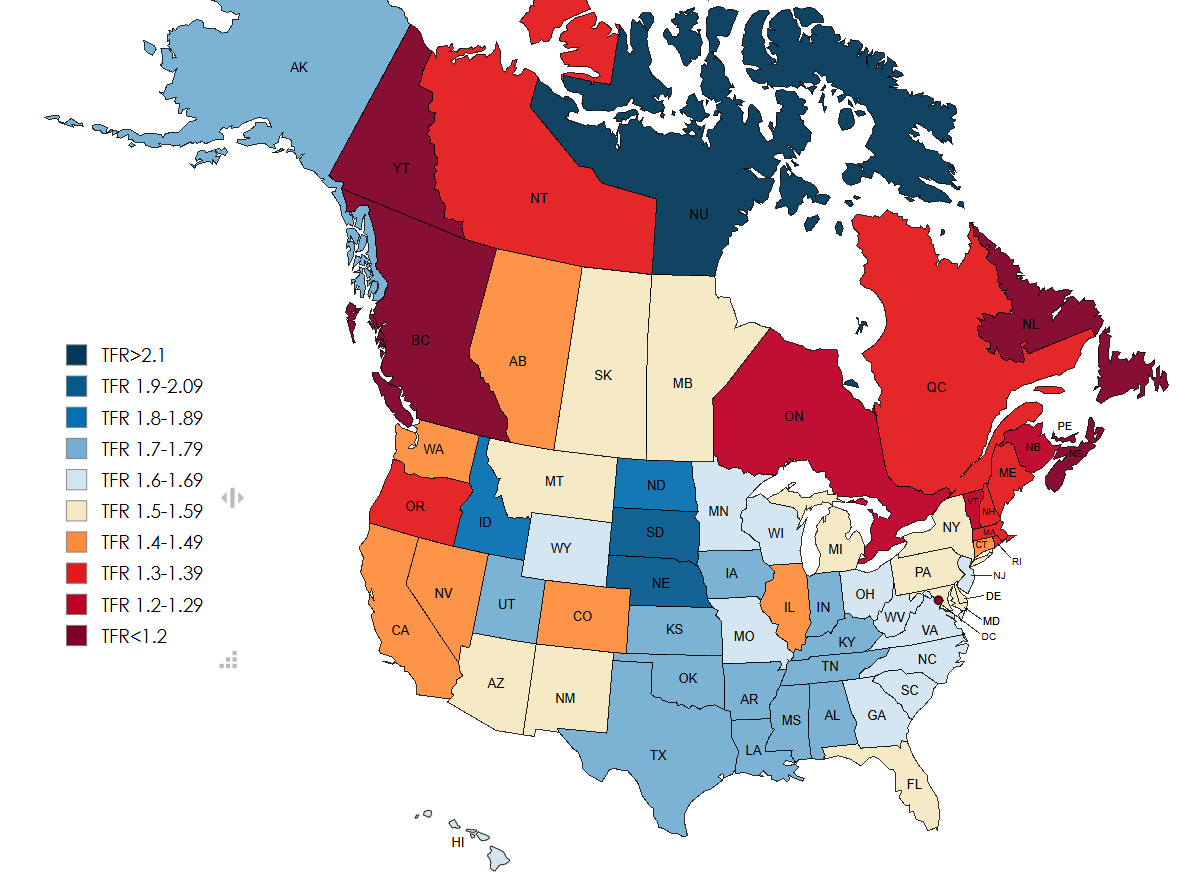
The "Fertility Rates in US and Canada 2024 Map" provides a comprehensive visualization of the fertility rates across different regions in both countries. By examining this map, viewers can quickly discern how birth rates vary by state in the United States and by province in Canada. These statistics are not just numbers; they reflect social, economic, and cultural dynamics that shape the future of populations.
Deep Dive into Fertility Rates
Fertility rates, often measured as the number of live births per 1,000 women of childbearing age, serve as an indicator of population growth and societal health. In the context of the US and Canada, these rates are influenced by a myriad of factors, including economic conditions, cultural norms, access to healthcare, and education levels.
As of 2024, the overall fertility rate in the United States hovers around 1.7 children per woman, which is below the replacement level of 2.1. This trend has been apparent over the past few decades as more individuals prioritize education and career before starting families. Interestingly, some states, particularly in the South and the Mountain West, exhibit higher fertility rates compared to coastal states. For instance, states like Utah and Idaho have consistently reported rates above 2.0, often attributed to cultural values favoring larger families and higher rates of religious participation.
In contrast, Canada has an overall fertility rate of about 1.5 children per woman, reflecting a similar trend of delayed parenthood and economic factors. However, provinces like Alberta consistently show higher rates, often due to economic opportunities in the energy sector, which attract younger families. The fertility landscape in Canada is also influenced by immigration, as many new Canadians come from cultures with higher fertility norms.
What's fascinating is the interplay between urban and rural areas in both countries. Urban centers often report lower fertility rates due to the high costs of living and the lifestyle choices of younger generations, while rural areas tend to have higher rates as families often have more land and resources to support larger families. This urban-rural divide is essential for understanding regional population dynamics and planning for future societal needs.
Regional Analysis
When we break down the fertility rates by region, stark contrasts emerge. In the United States, the Southern states generally lead with higher fertility rates. States like Texas and Arkansas have rates over 2.0, significantly contributing to population growth. In these areas, factors such as cultural attitudes towards family size and lower living costs play a vital role.
Conversely, the Northeast and West Coast, including states like New York and California, show rates below 1.6. These regions often have higher housing costs and a strong emphasis on career development, which can delay family formation.
In Canada, the provinces of British Columbia and Ontario show some of the lowest fertility rates, again reflecting urbanization trends and economic factors. In contrast, the Prairie provinces, such as Saskatchewan and Manitoba, report higher fertility rates, often linked to agricultural lifestyles and more traditional family structures.
Significance and Impact
Understanding fertility rates is crucial for policymakers, urban planners, and social scientists. These rates not only dictate the immediate population growth but also have long-term implications for labor markets, education systems, and healthcare services. For instance, a declining fertility rate can lead to an aging population, which may strain social services and healthcare systems in the coming decades.
Moreover, shifts in fertility rates influence migration patterns, economic growth, and cultural diversity. As both the US and Canada continue to navigate changing demographics, addressing the challenges and opportunities presented by these trends will be vital. Current projections suggest that fertility rates may remain low in urban areas due to ongoing economic pressures, while rural areas may see a slight increase as more people seek affordable living and family-friendly environments.
In conclusion, the "Fertility Rates in US and Canada 2024 Map" not only visualizes numeric data but also invites us to ponder the broader societal shifts influencing these numbers. Have you noticed how different regions uniquely respond to the challenges of family planning? The future of demographics in North America will largely depend on how these factors evolve in the coming years.
Visualization Details
- Published
- October 10, 2025
- Views
- 38
Comments
Loading comments...