fertility rates Maps
19 geographic visualizations tagged with "fertility rates"
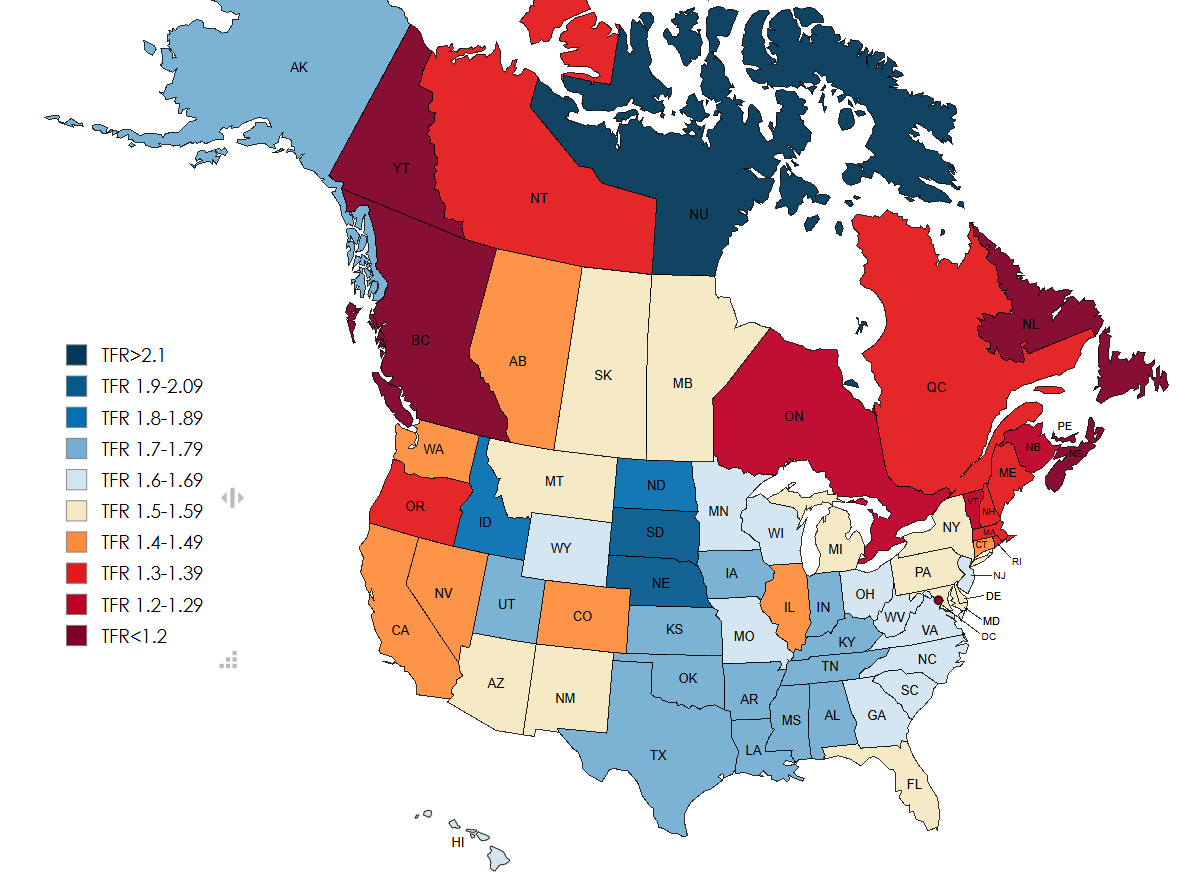
Fertility Rates in US and Canada 2024 Map
The "Fertility Rates in US and Canada 2024 Map" provides a comprehensive visualization of the fertility rates across dif...
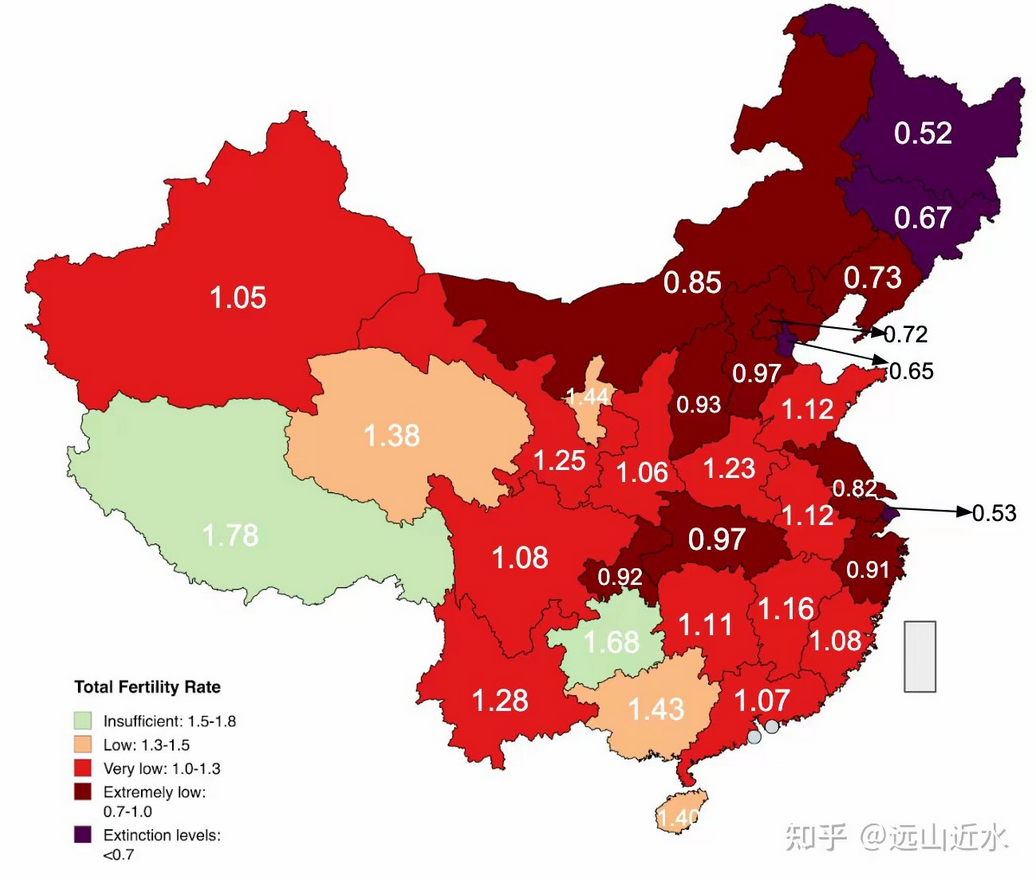
Children per Woman in Chinese Provinces Map
This map visualizes the average number of children born per woman across various provinces in China as of 2023. It provi...
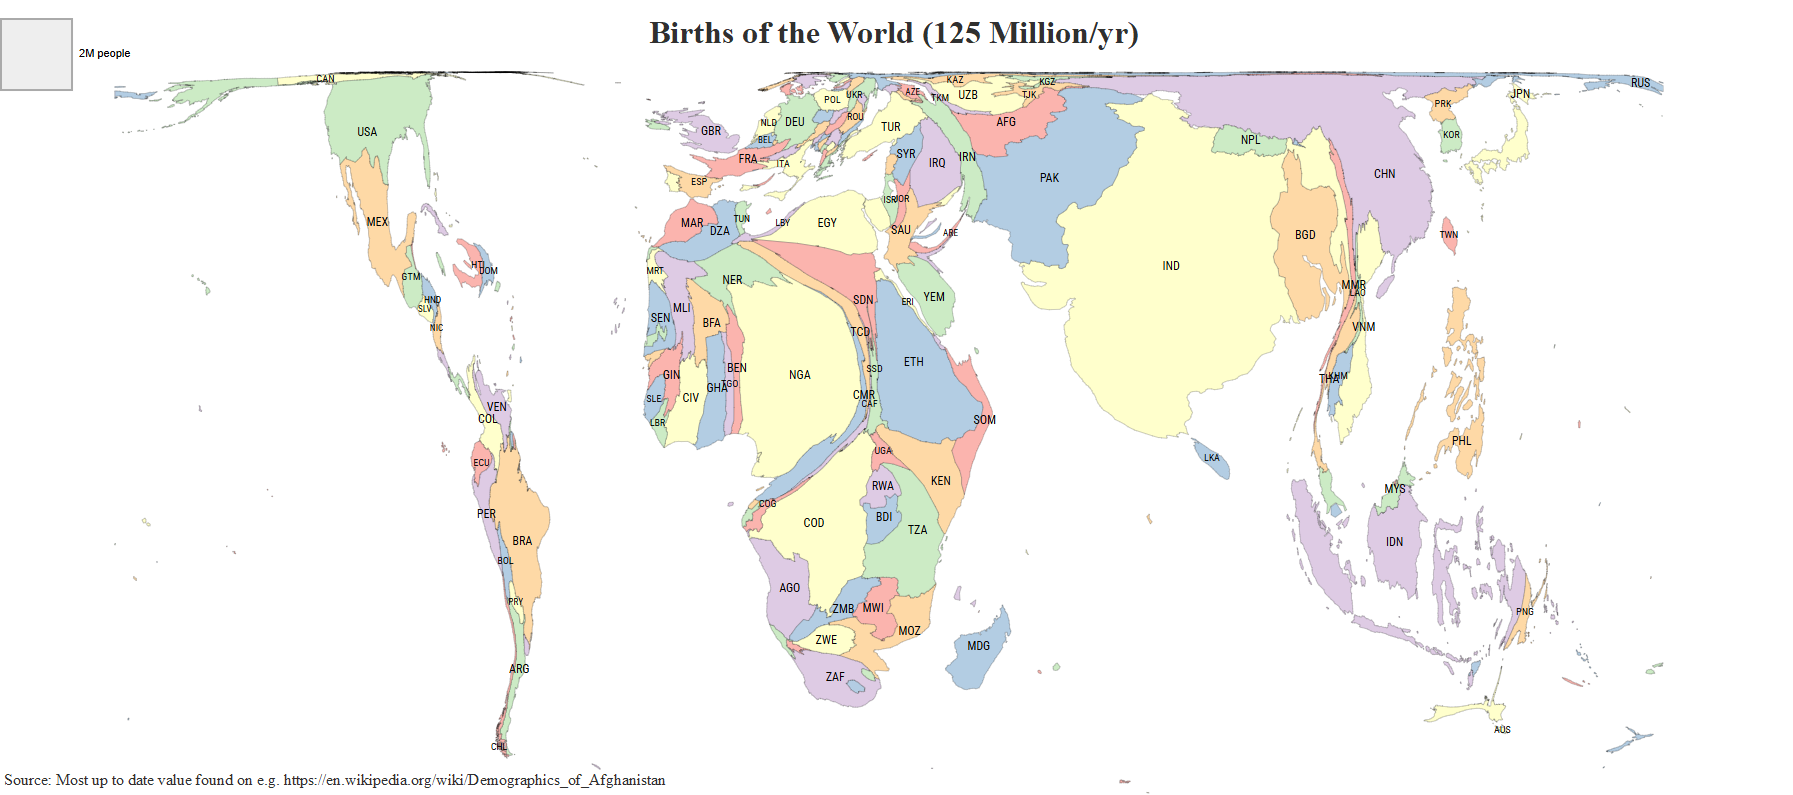
Map of Global Birth Rates by Country
The interactive map titled "This is where the world's babies are born" provides a compelling visualization of birth rate...
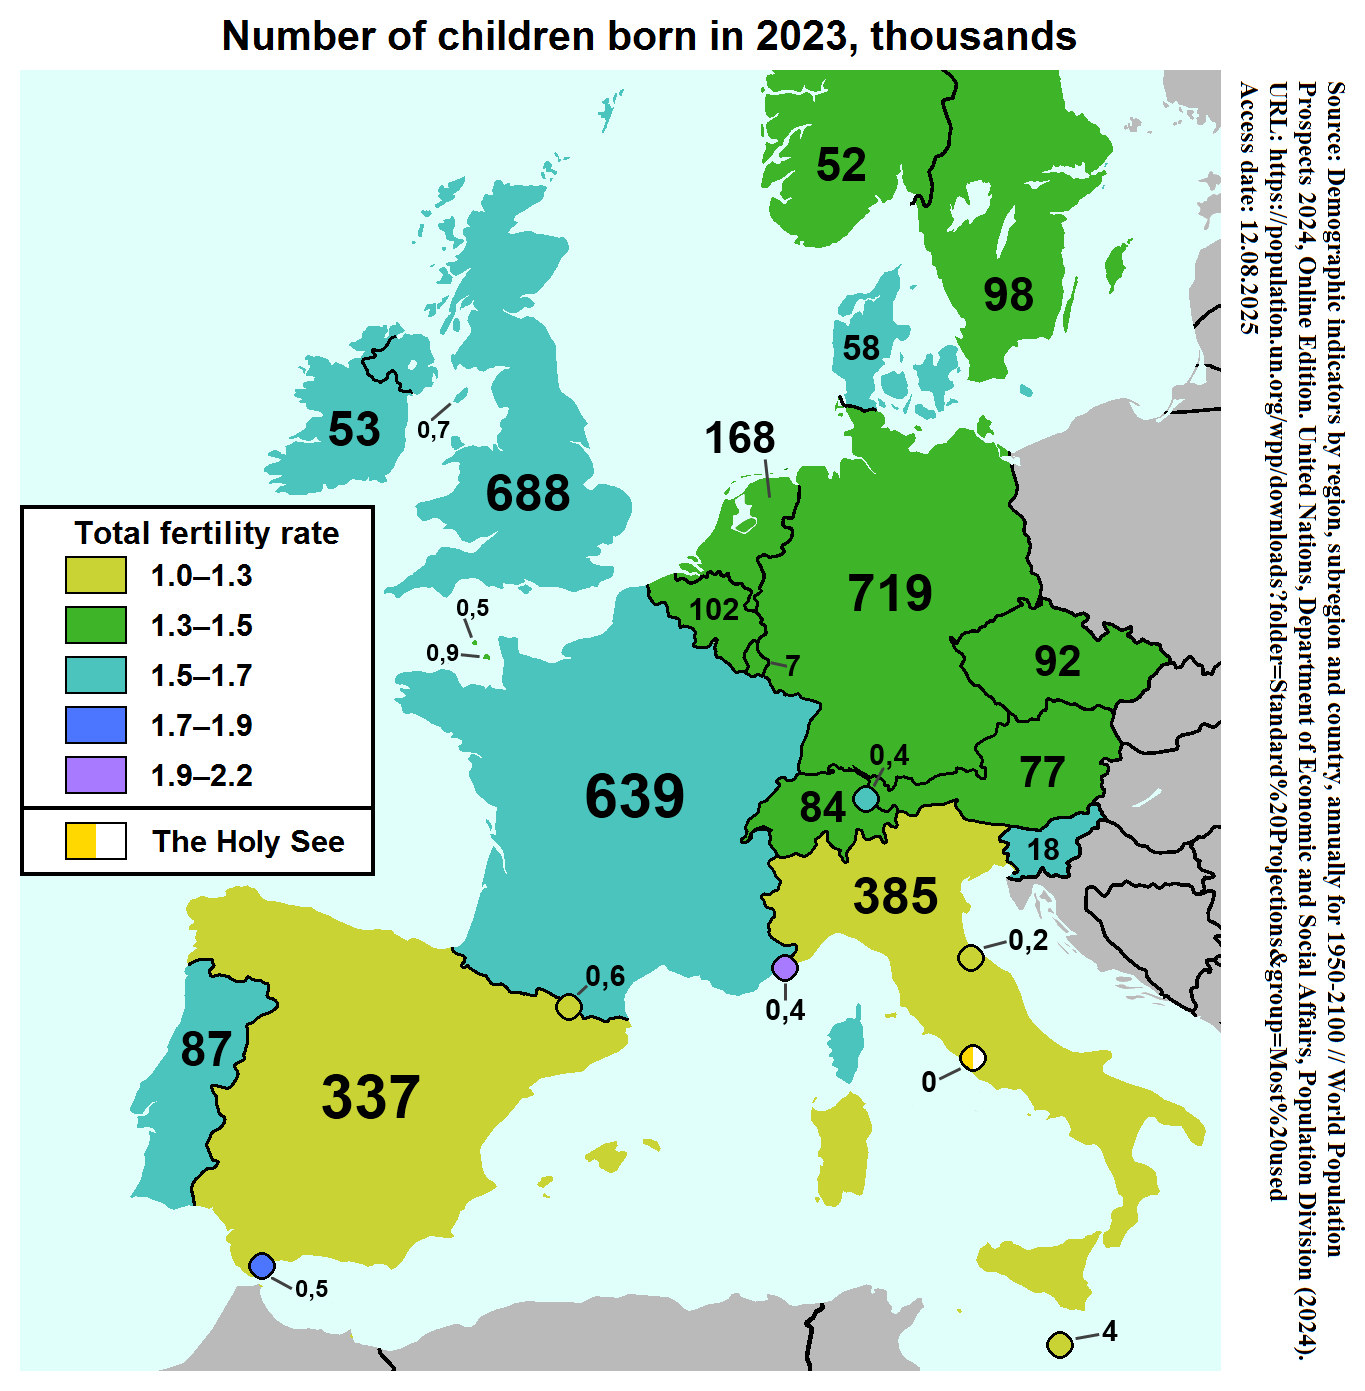
Total Fertility Rate and Children Born Map Western Europe 2023
The map titled "Total Fertility Rate and Number of Children Born in Western Europe, 2023" visually represents the fertil...
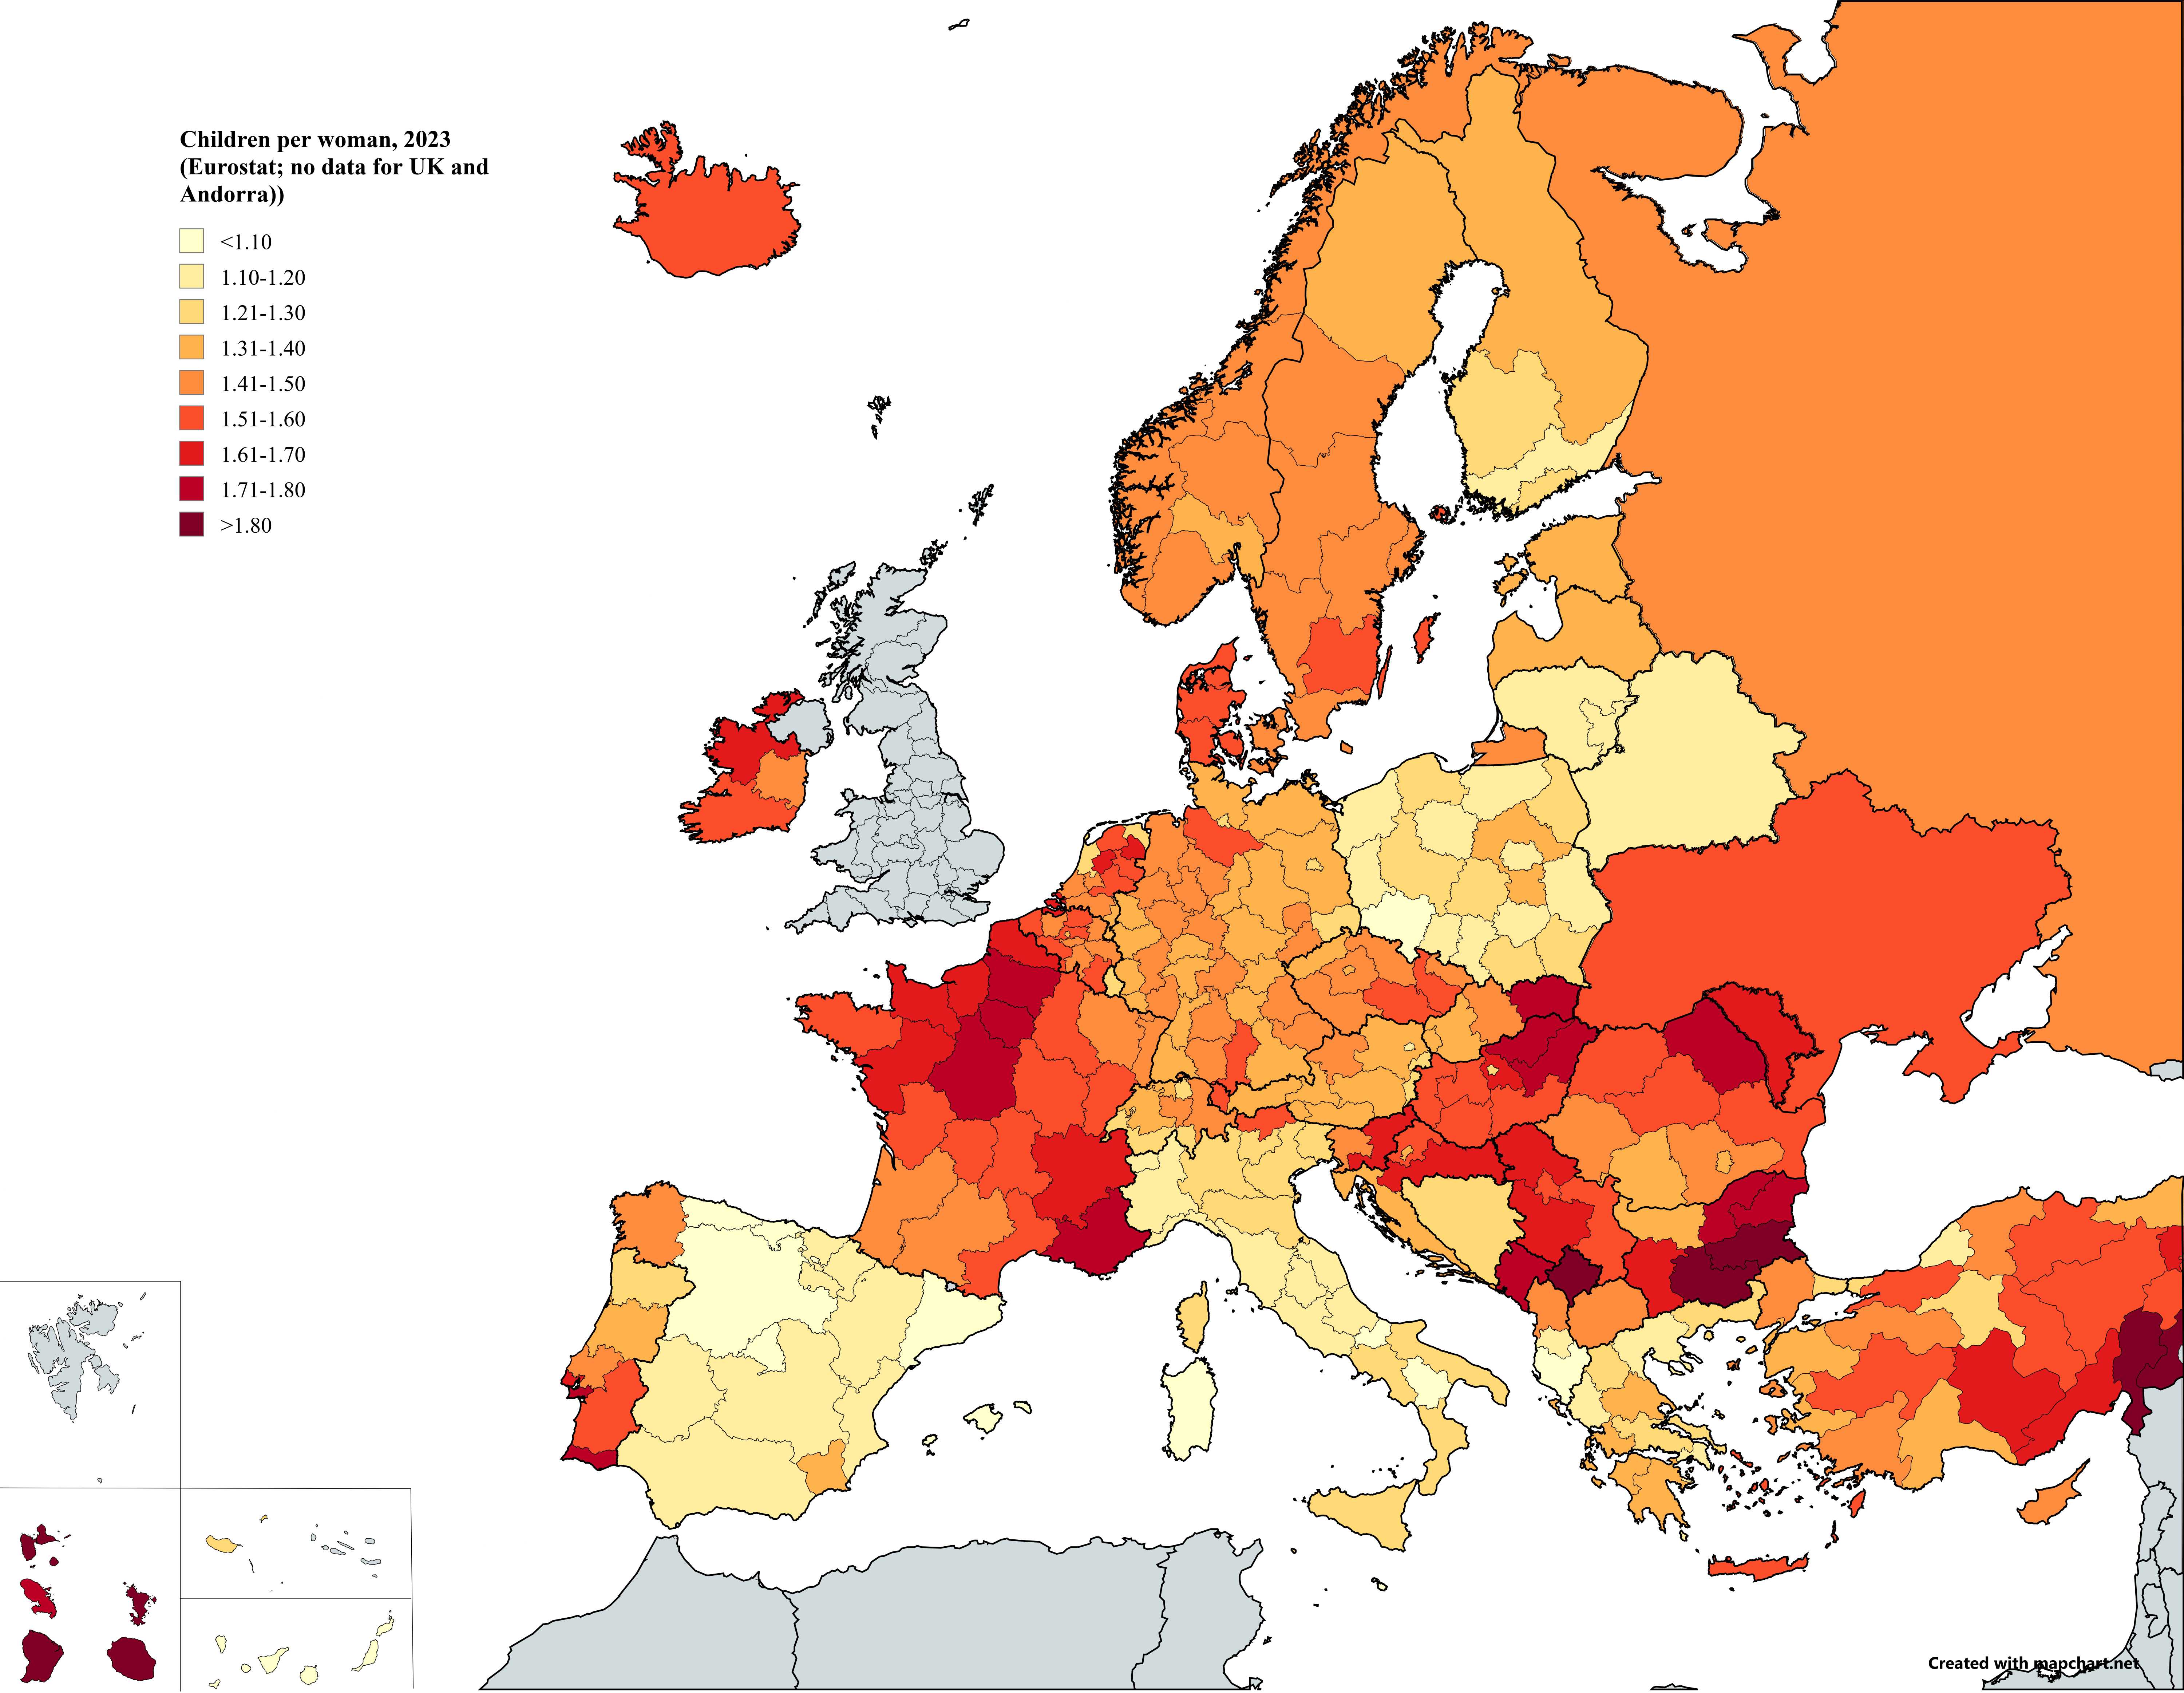
Children per Woman in Europe Map
The "Children per Woman in Europe Map" provides a visual representation of the fertility rates across various European c...
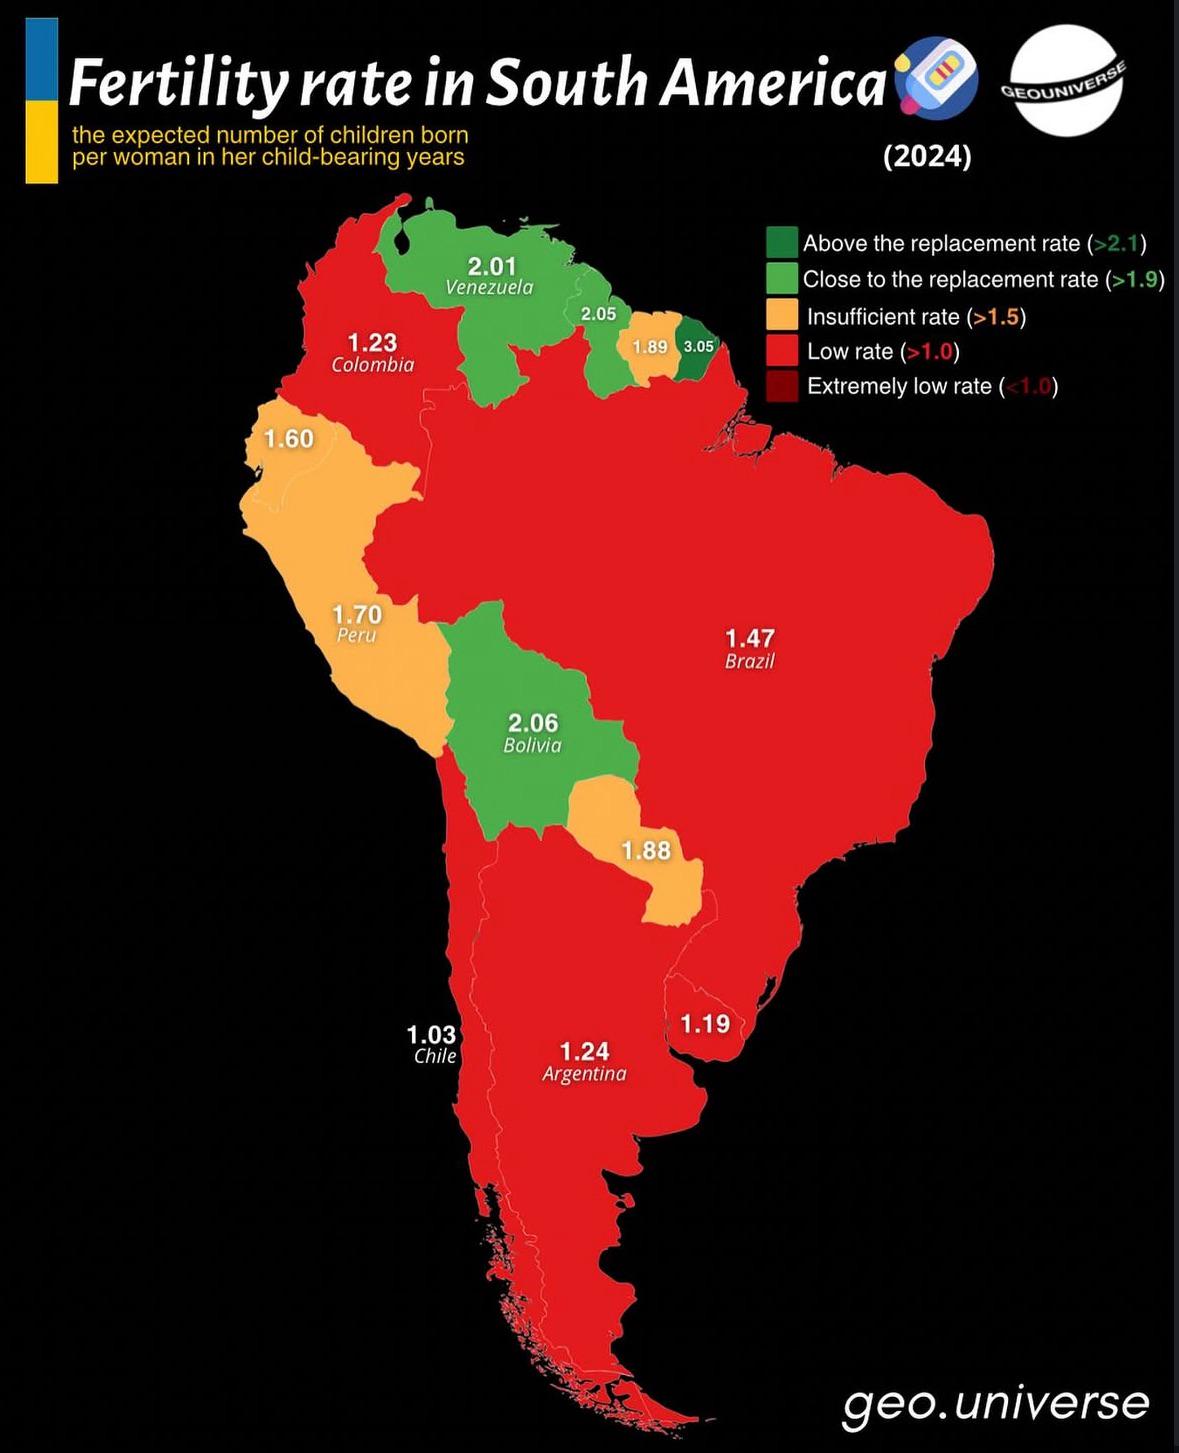
Fertility Rate Map of South America
The "Fertility Rate Map of South America" provides a visual representation of the birth rates across different countries...
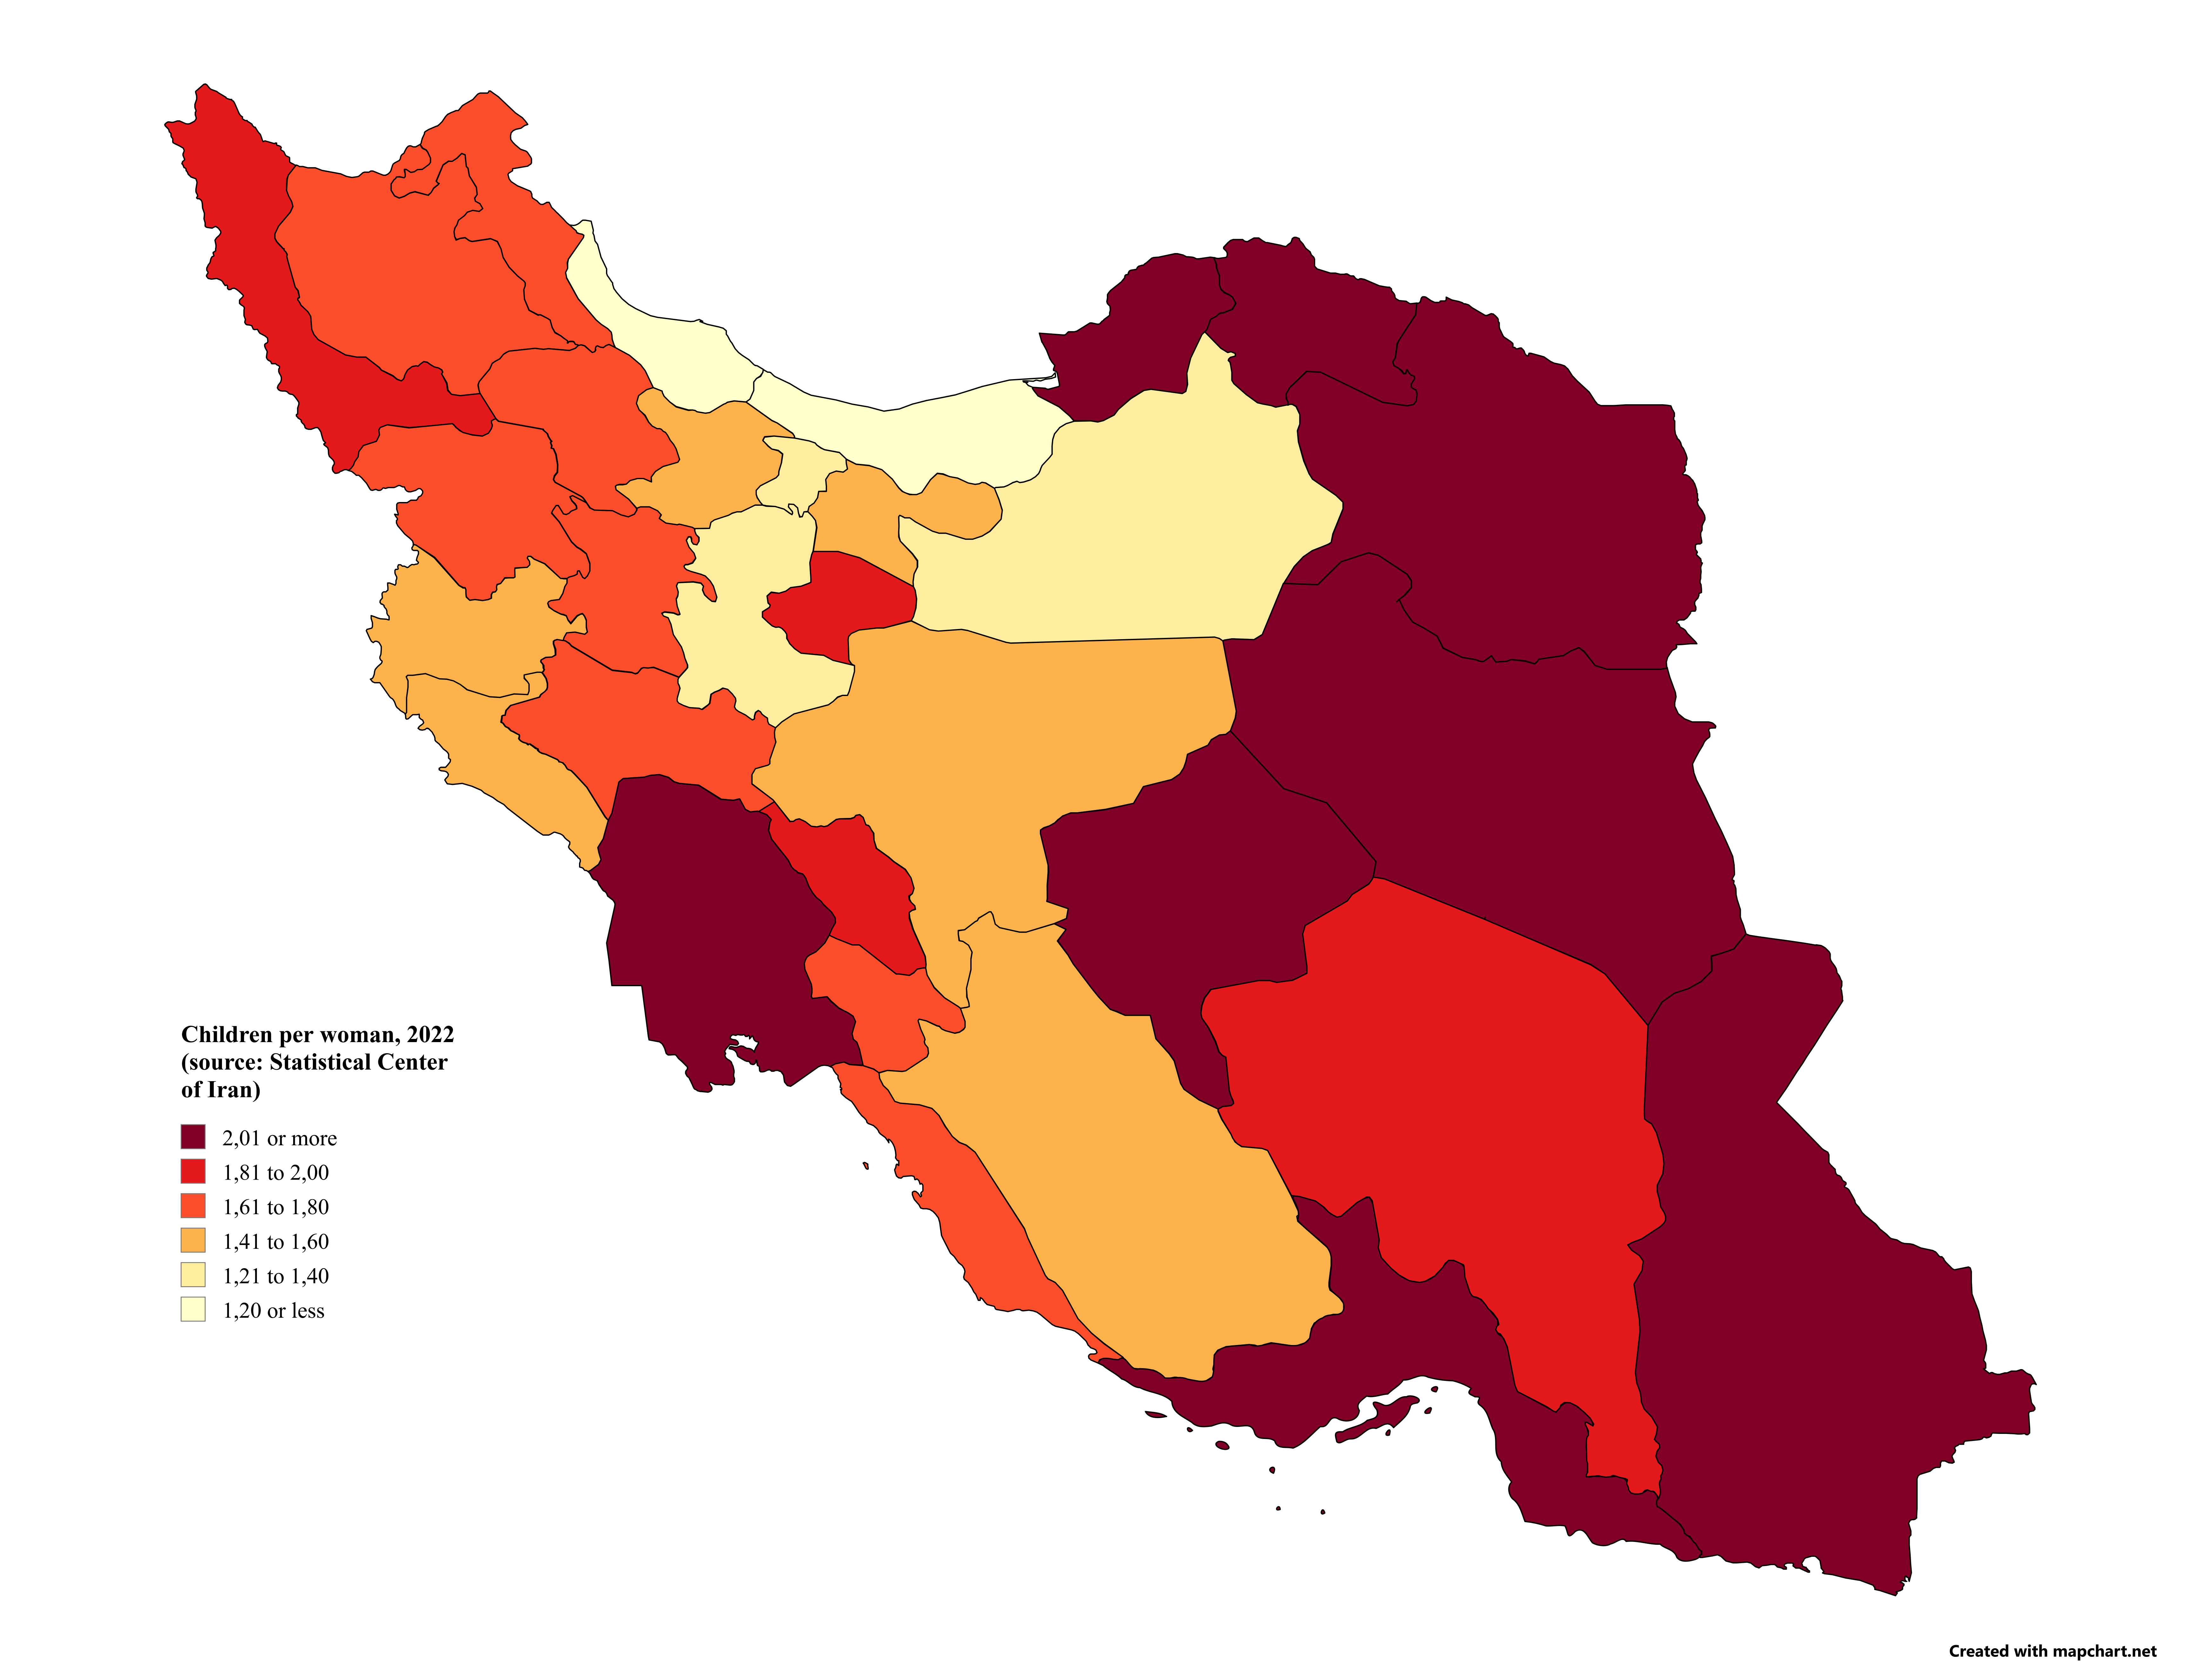
Children per Woman in Iran by Province Map
This visualization provides a detailed look at the number of children per woman in Iran, broken down by province. This d...
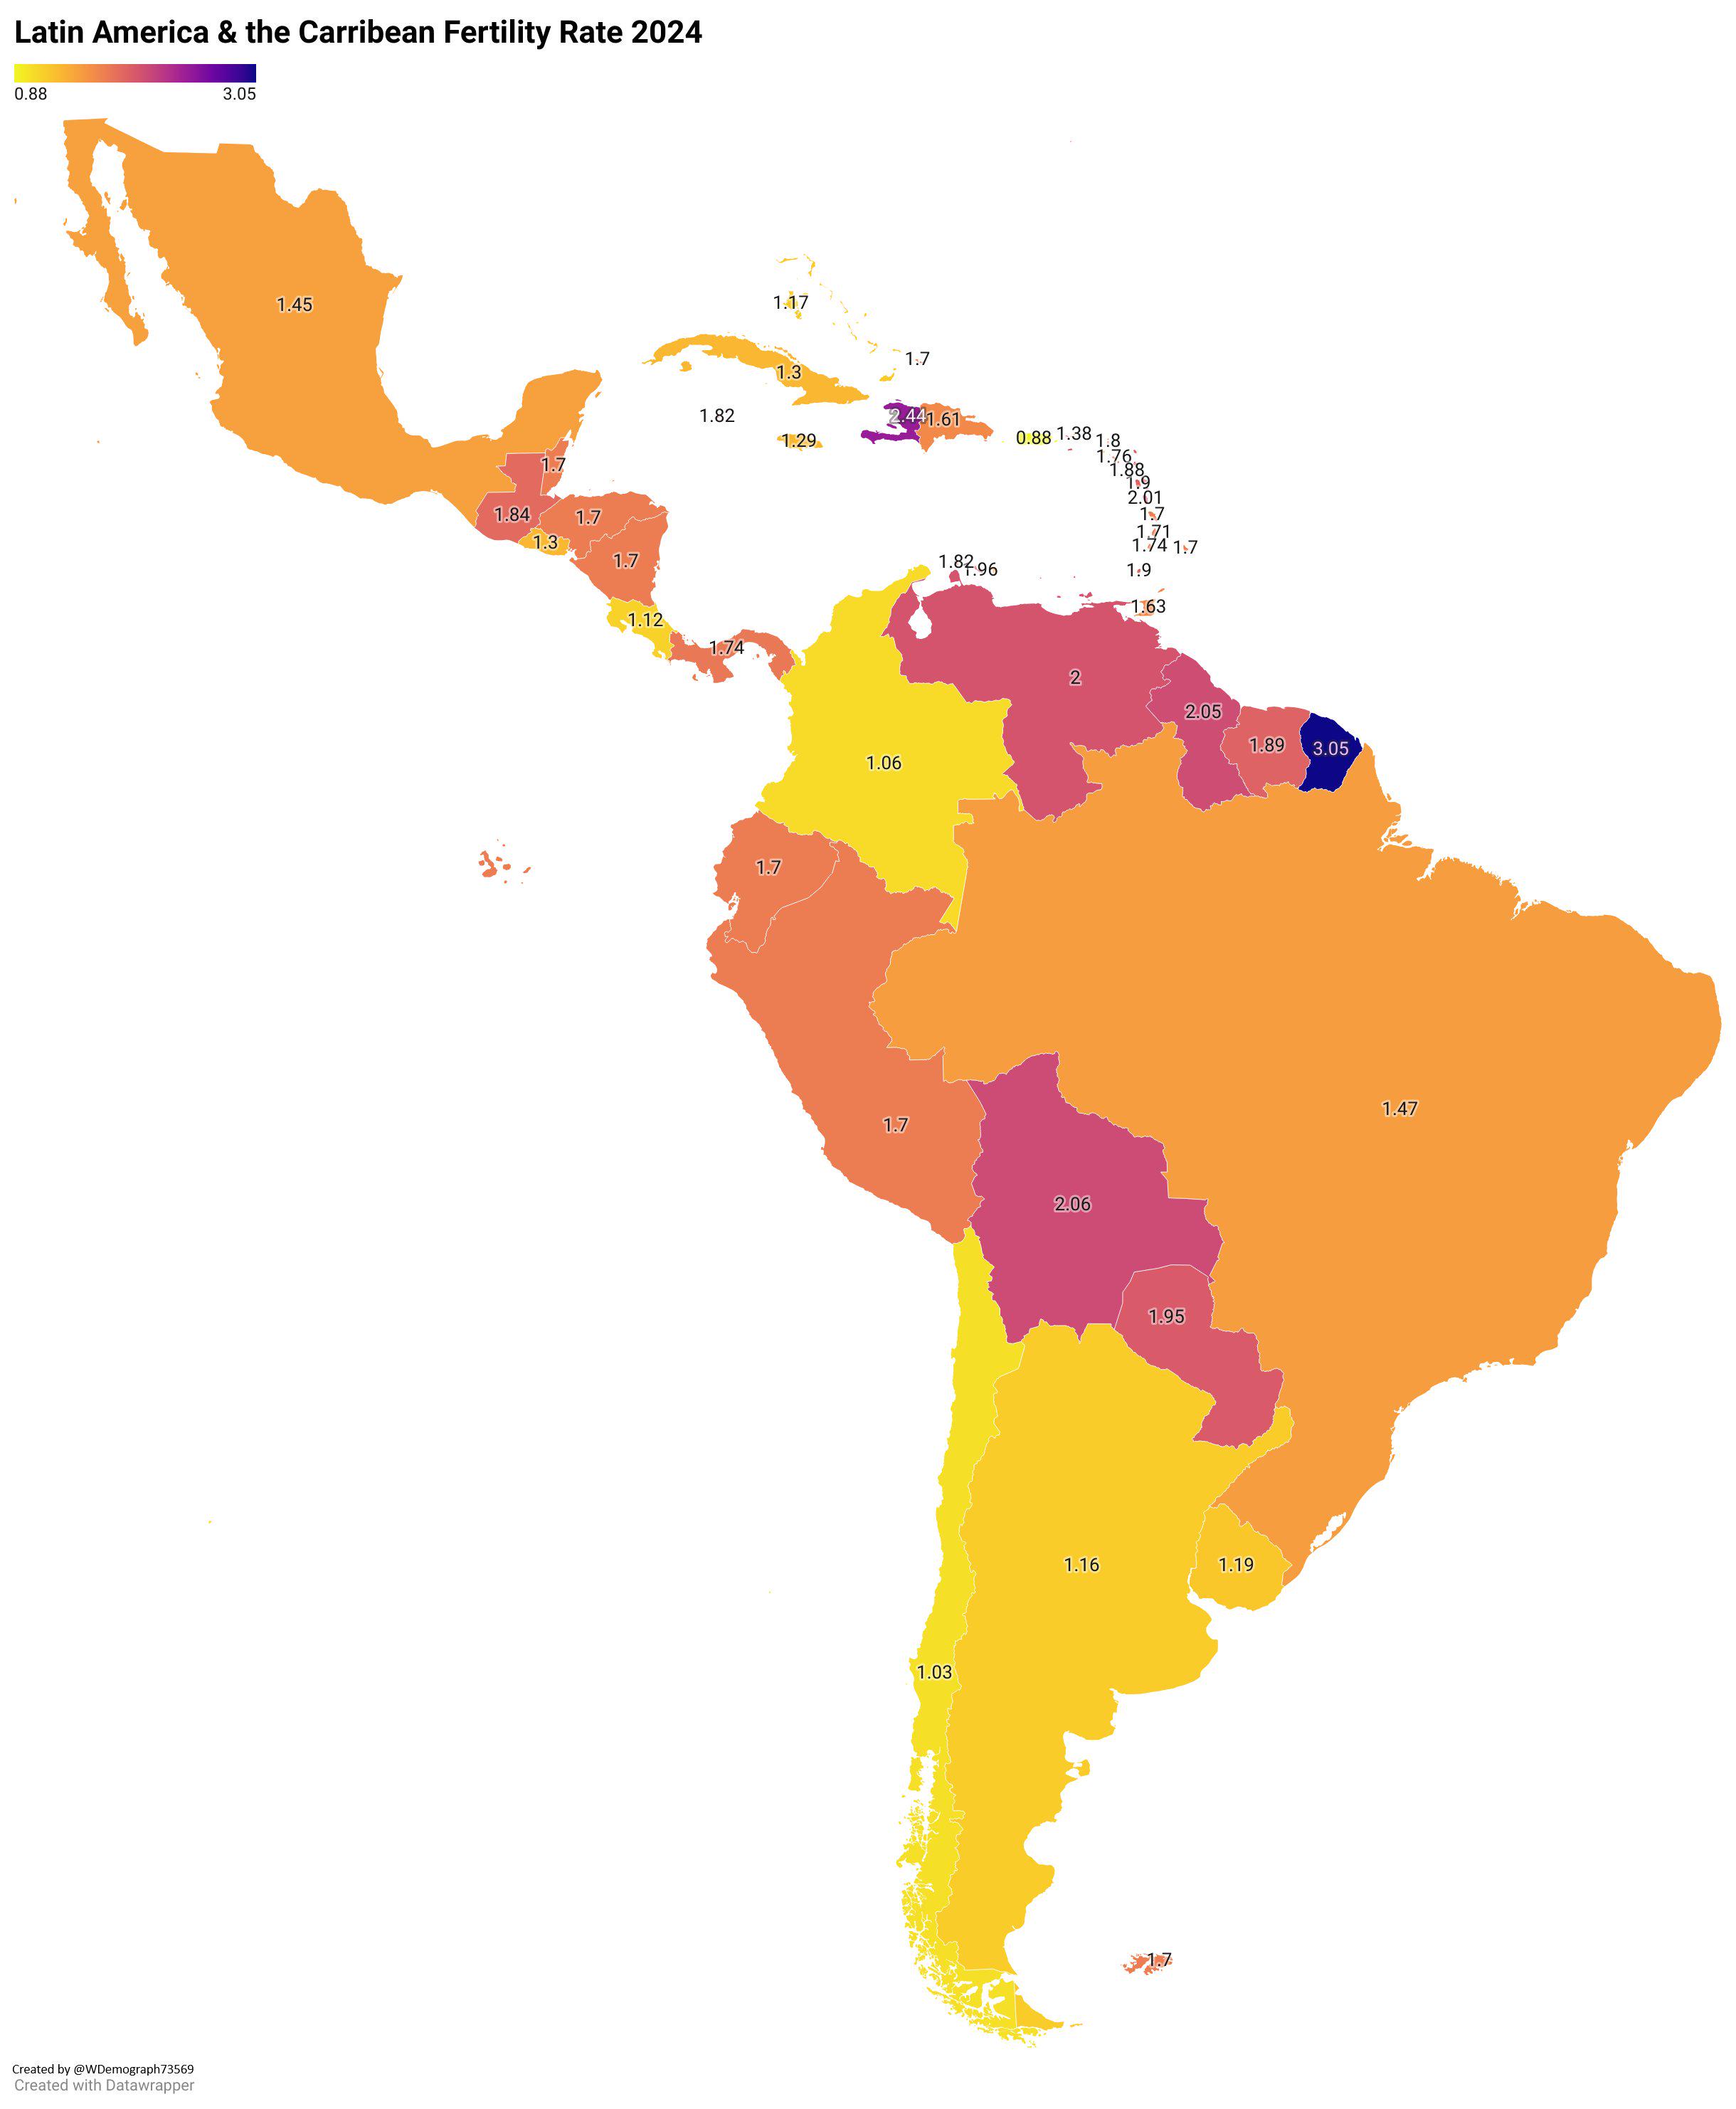
Fertility Rate Map of Latin America & The Caribbean 2024
The "Fertility Rate Map of Latin America & The Caribbean 2024" provides a clear visualization of the current fertility r...
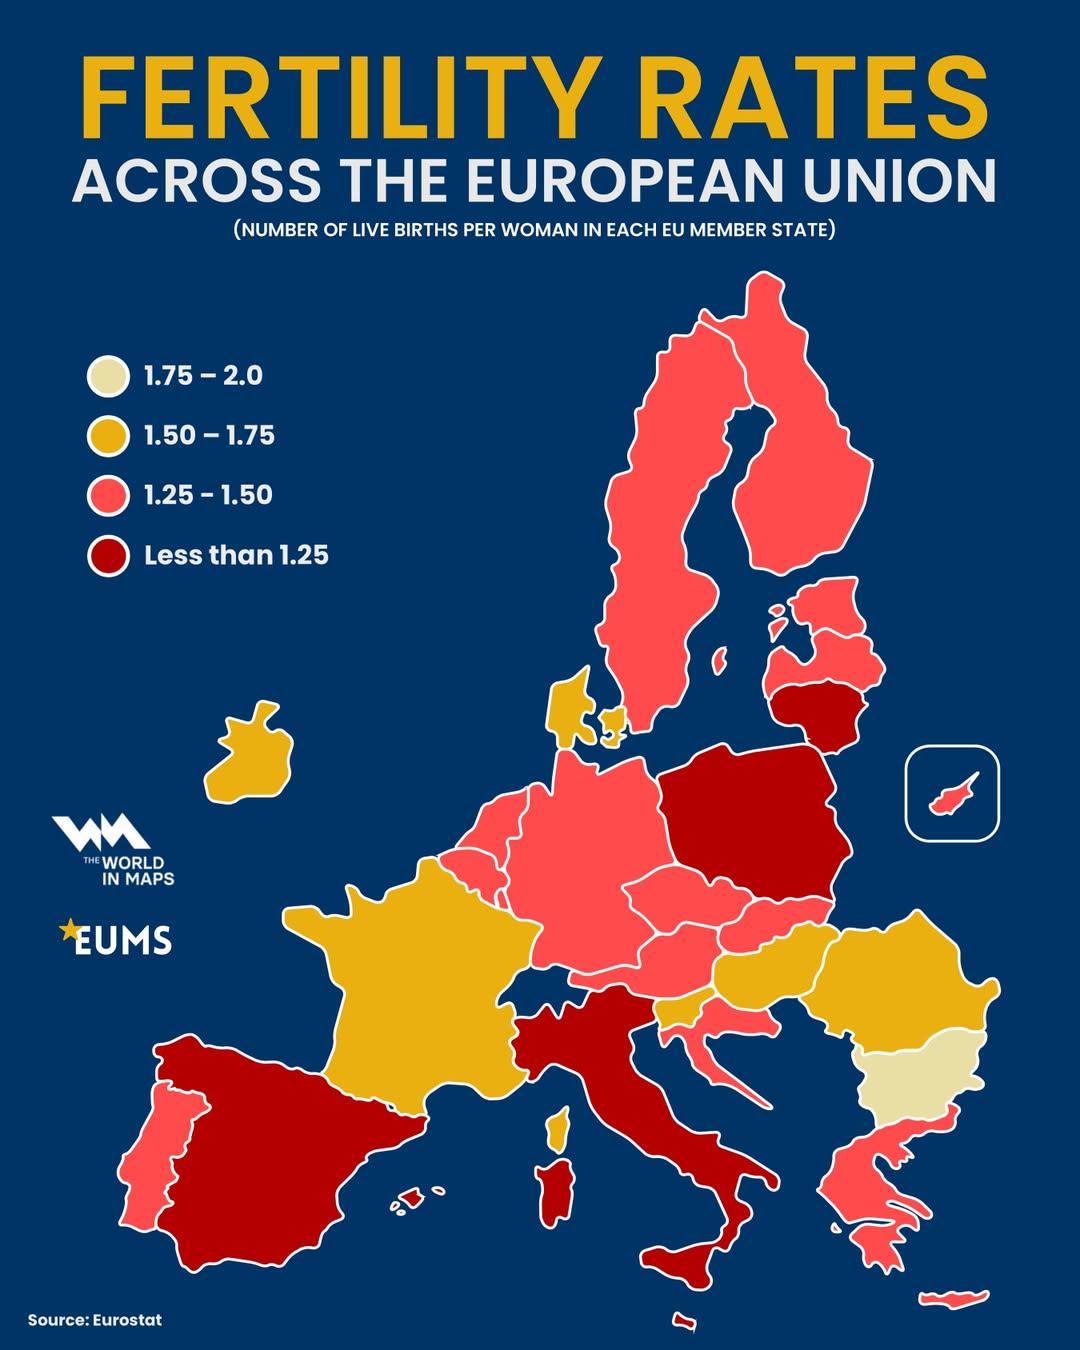
Fertility Rates Across the EU Map
The "Fertility Rates Across the EU Map" provides a comprehensive visualization of the varying fertility rates within the...
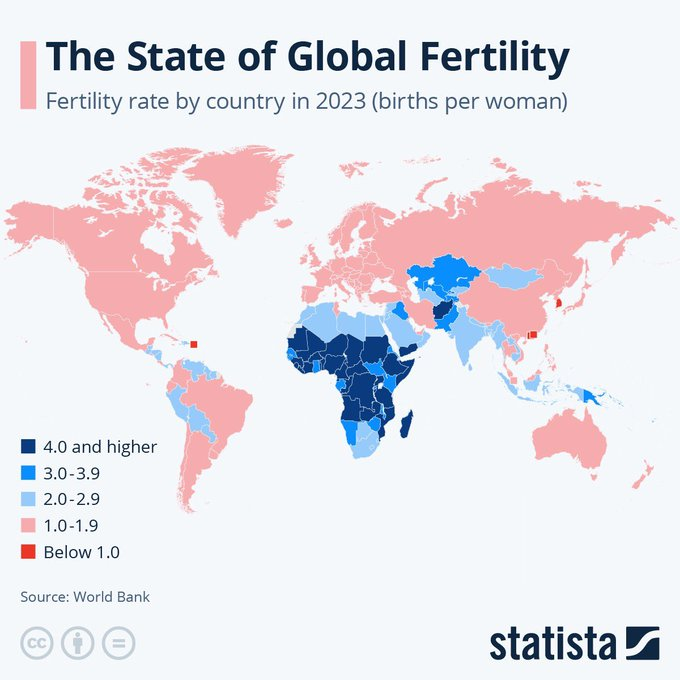
Global Fertility Rates Map
The "Global Fertility Rates Map" provides a comprehensive visualization of fertility rates across different countries an...
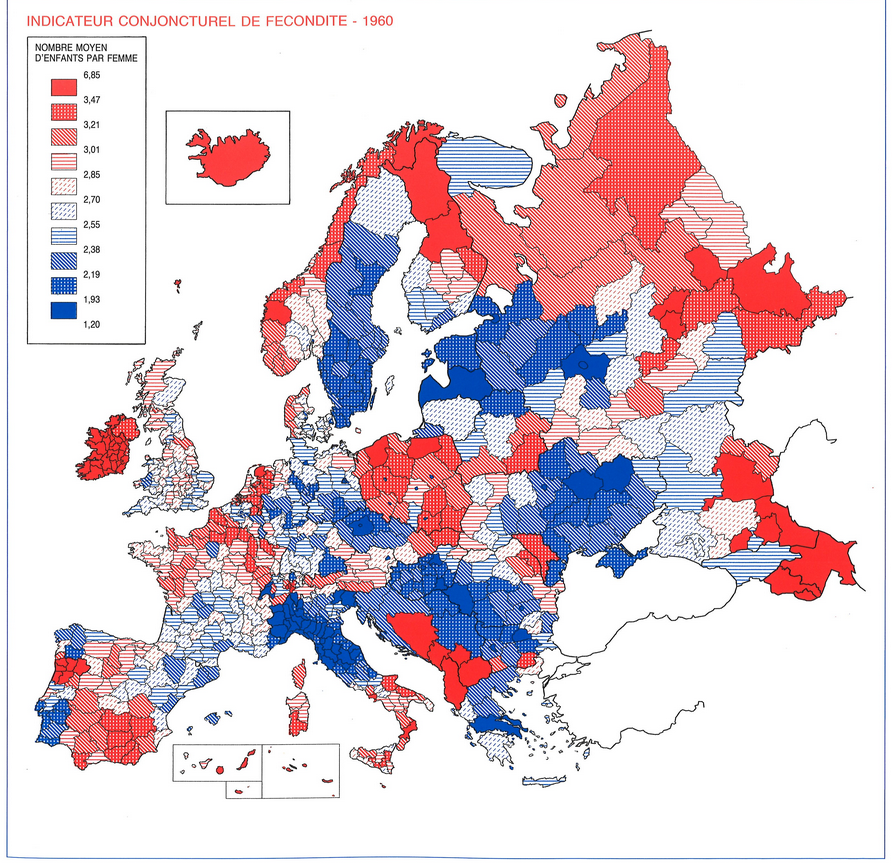
Children per Woman in Europe 1960 Map
The map titled "Children per Woman in Europe in the Year 1960" provides a striking visualization of fertility rates acro...
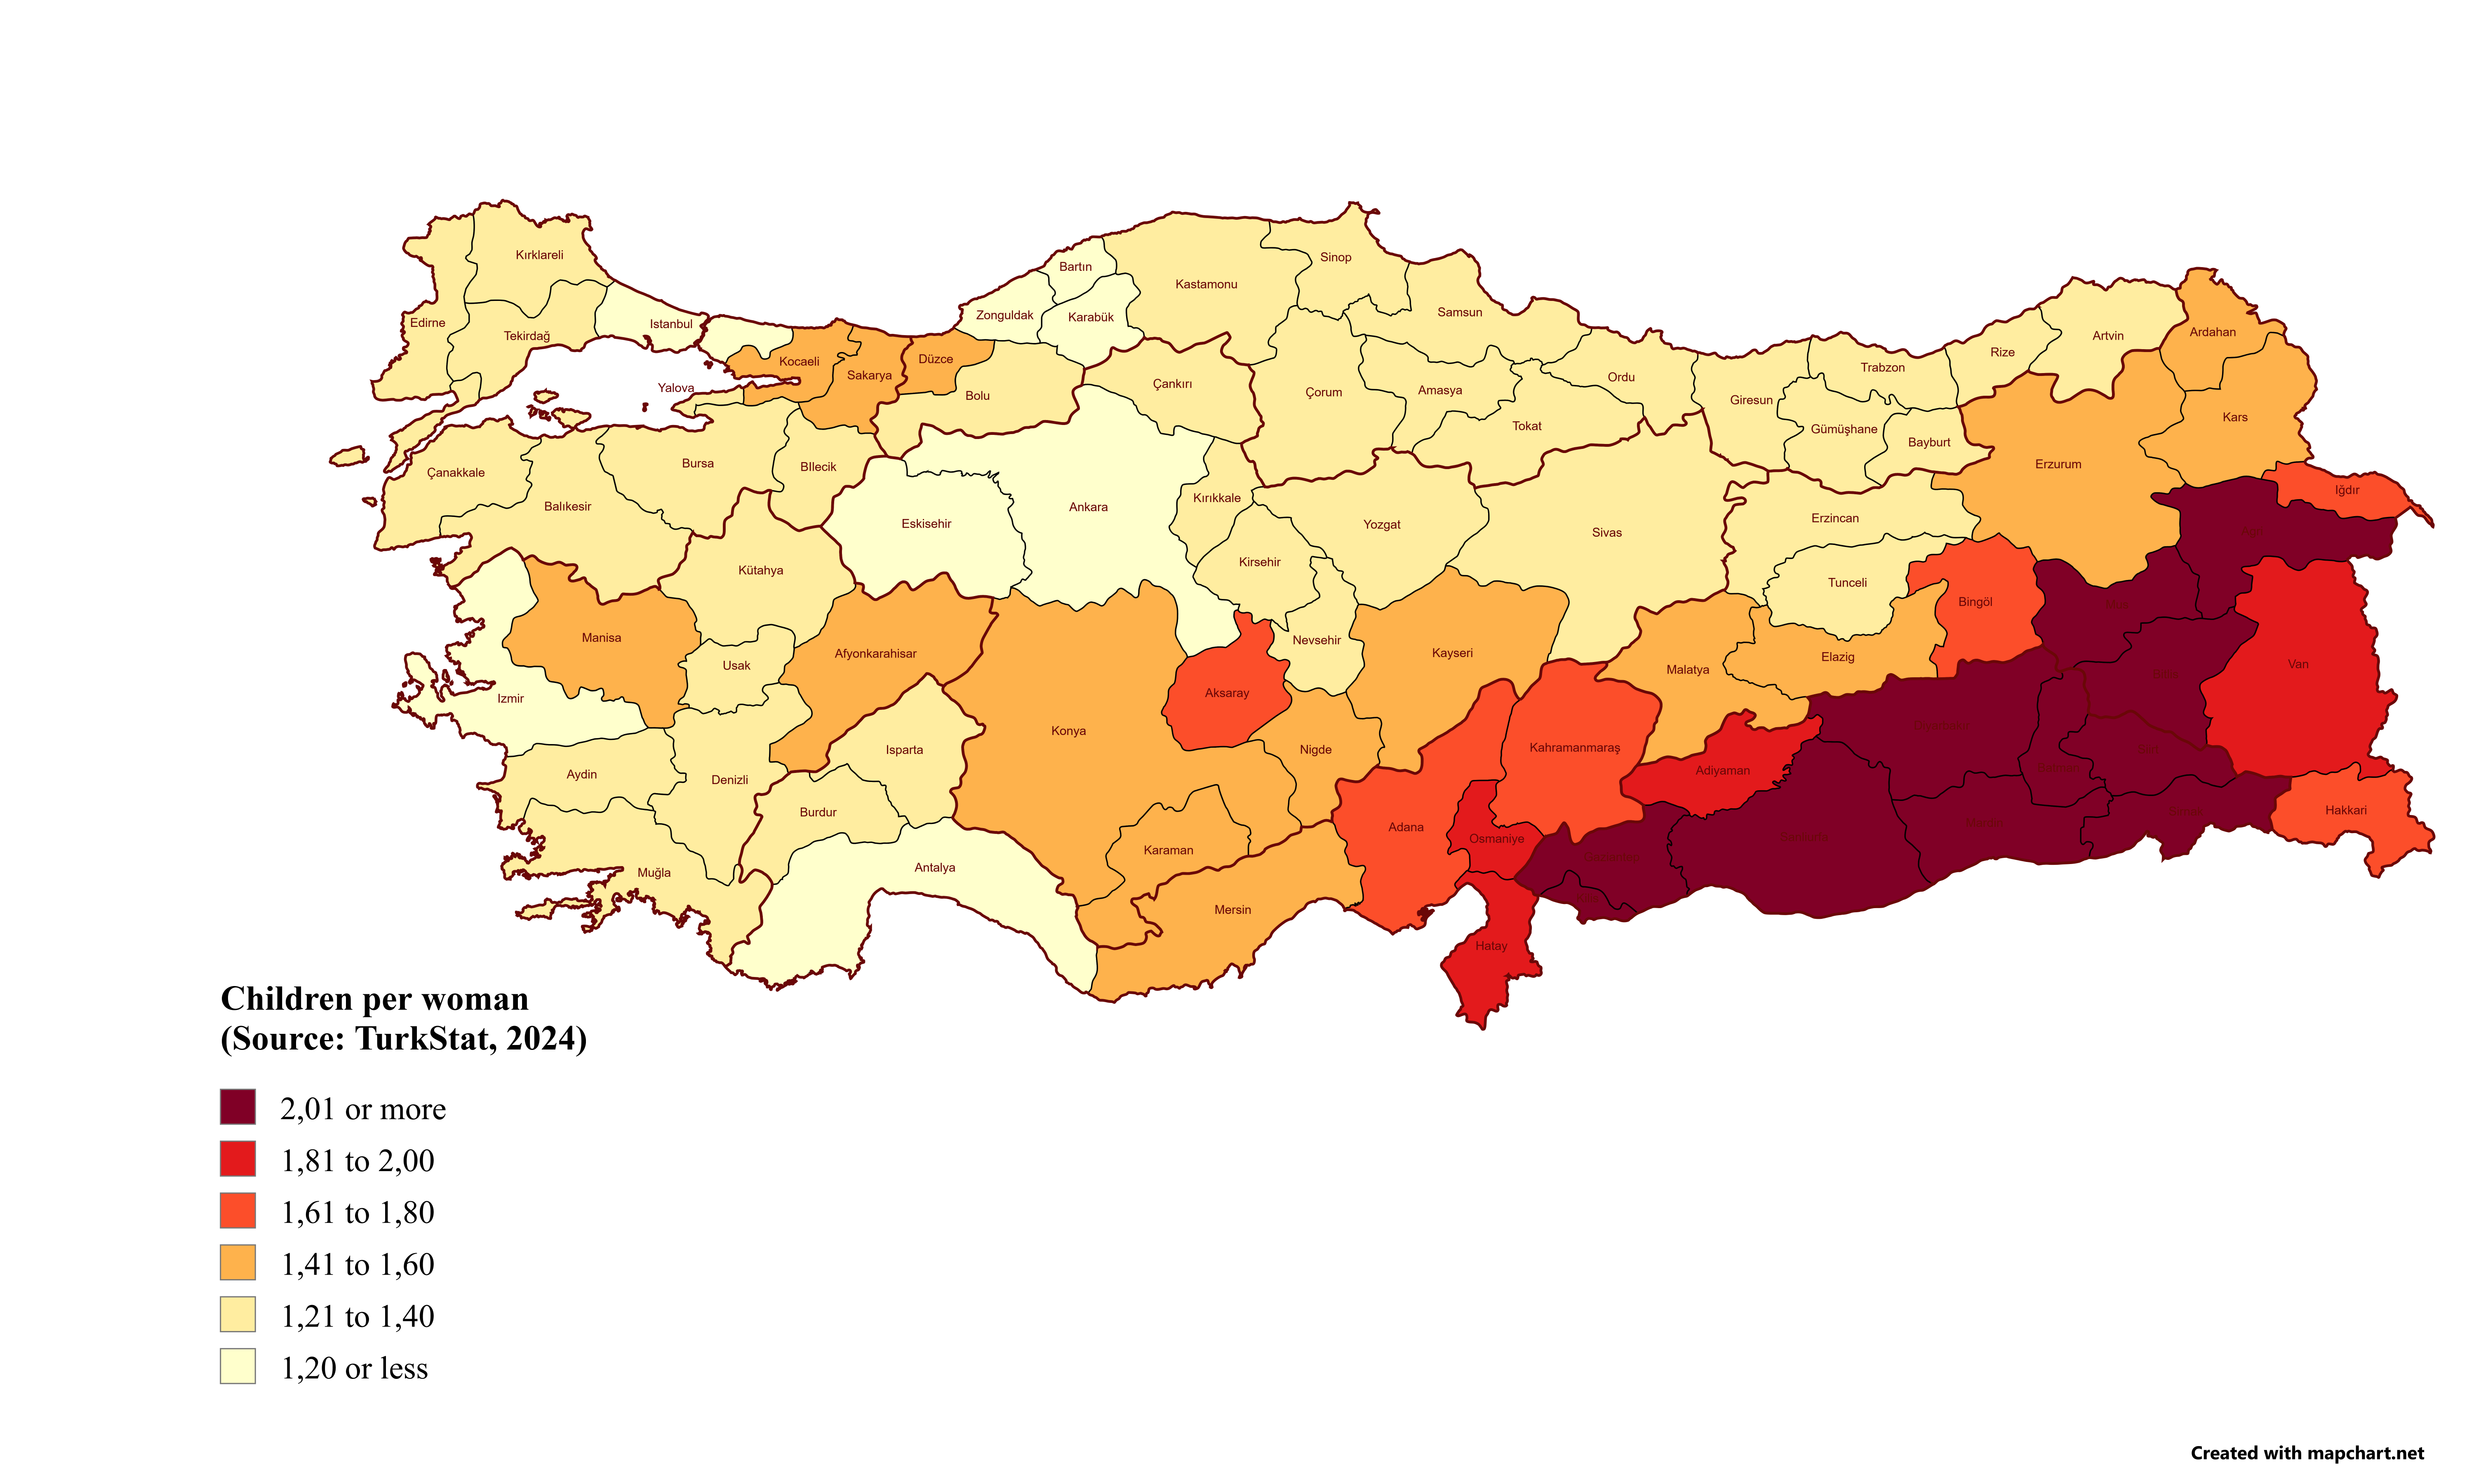
Children per Woman in Turkey by Province Map
The "Children per Woman in Turkey by Province Map" provides a visual representation of fertility rates across Turkey's p...
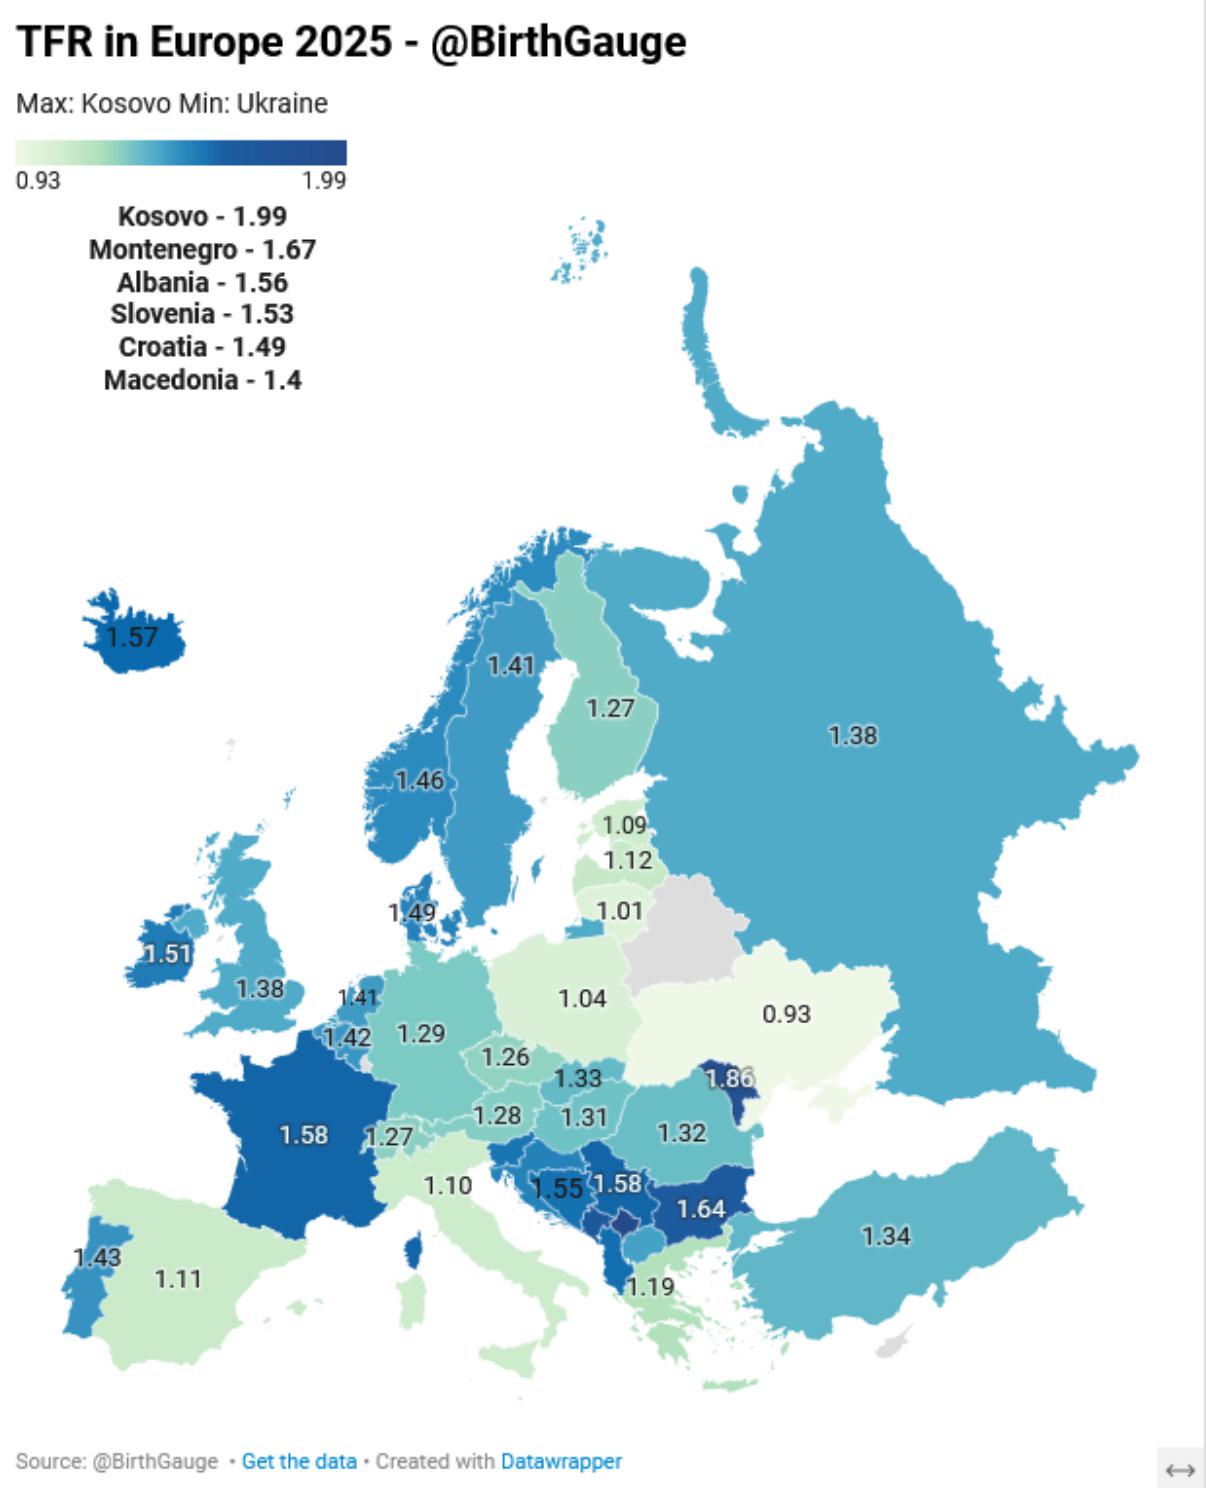
Total Fertility Rate in Europe Map
...
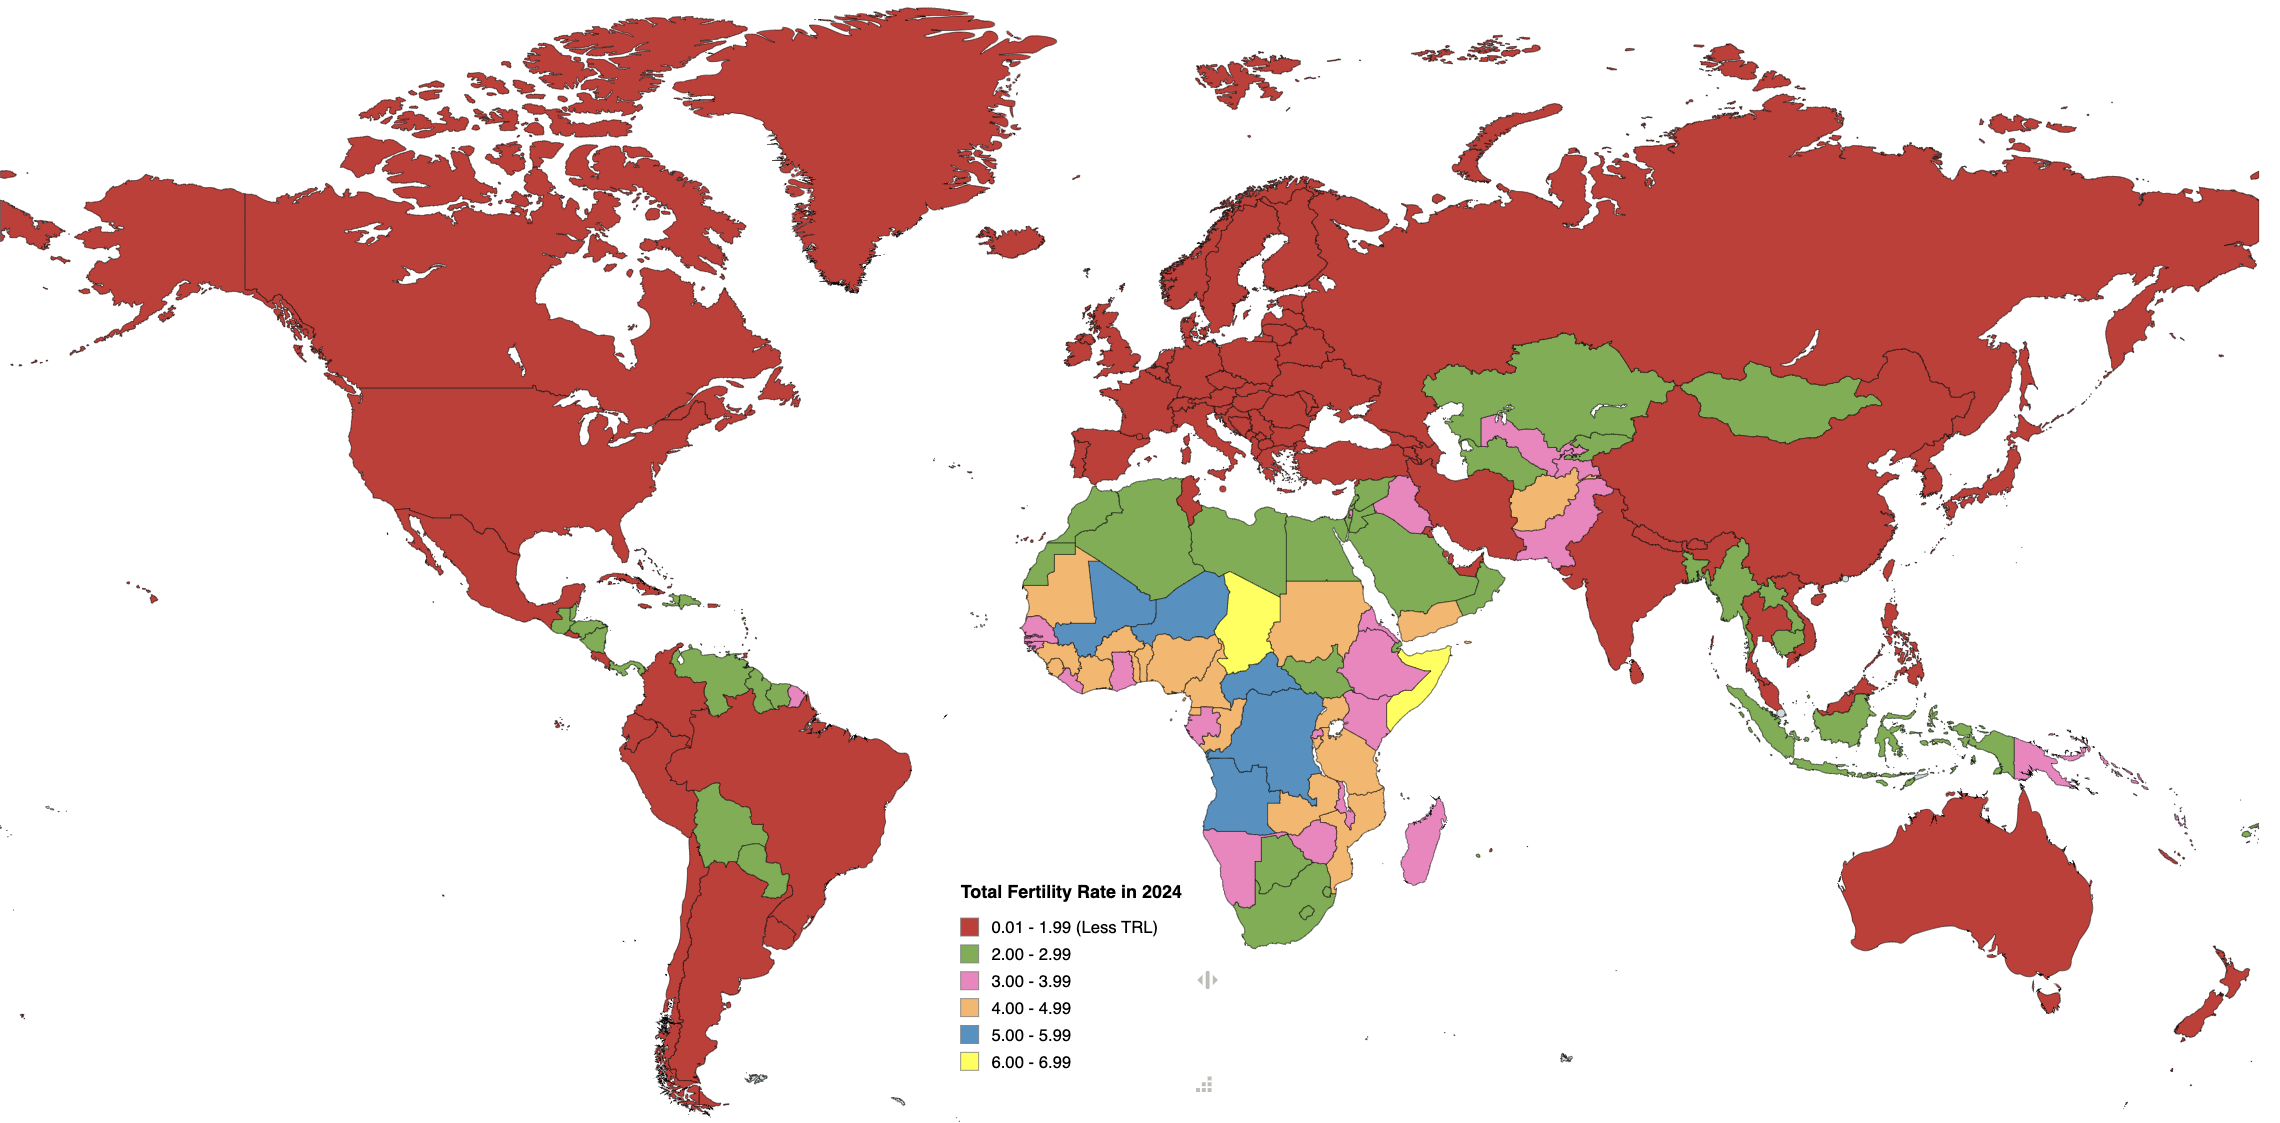
Fertility Rates by Country Map 2024
This map visually represents the fertility rates of countries around the globe, specifically highlighting those that are...
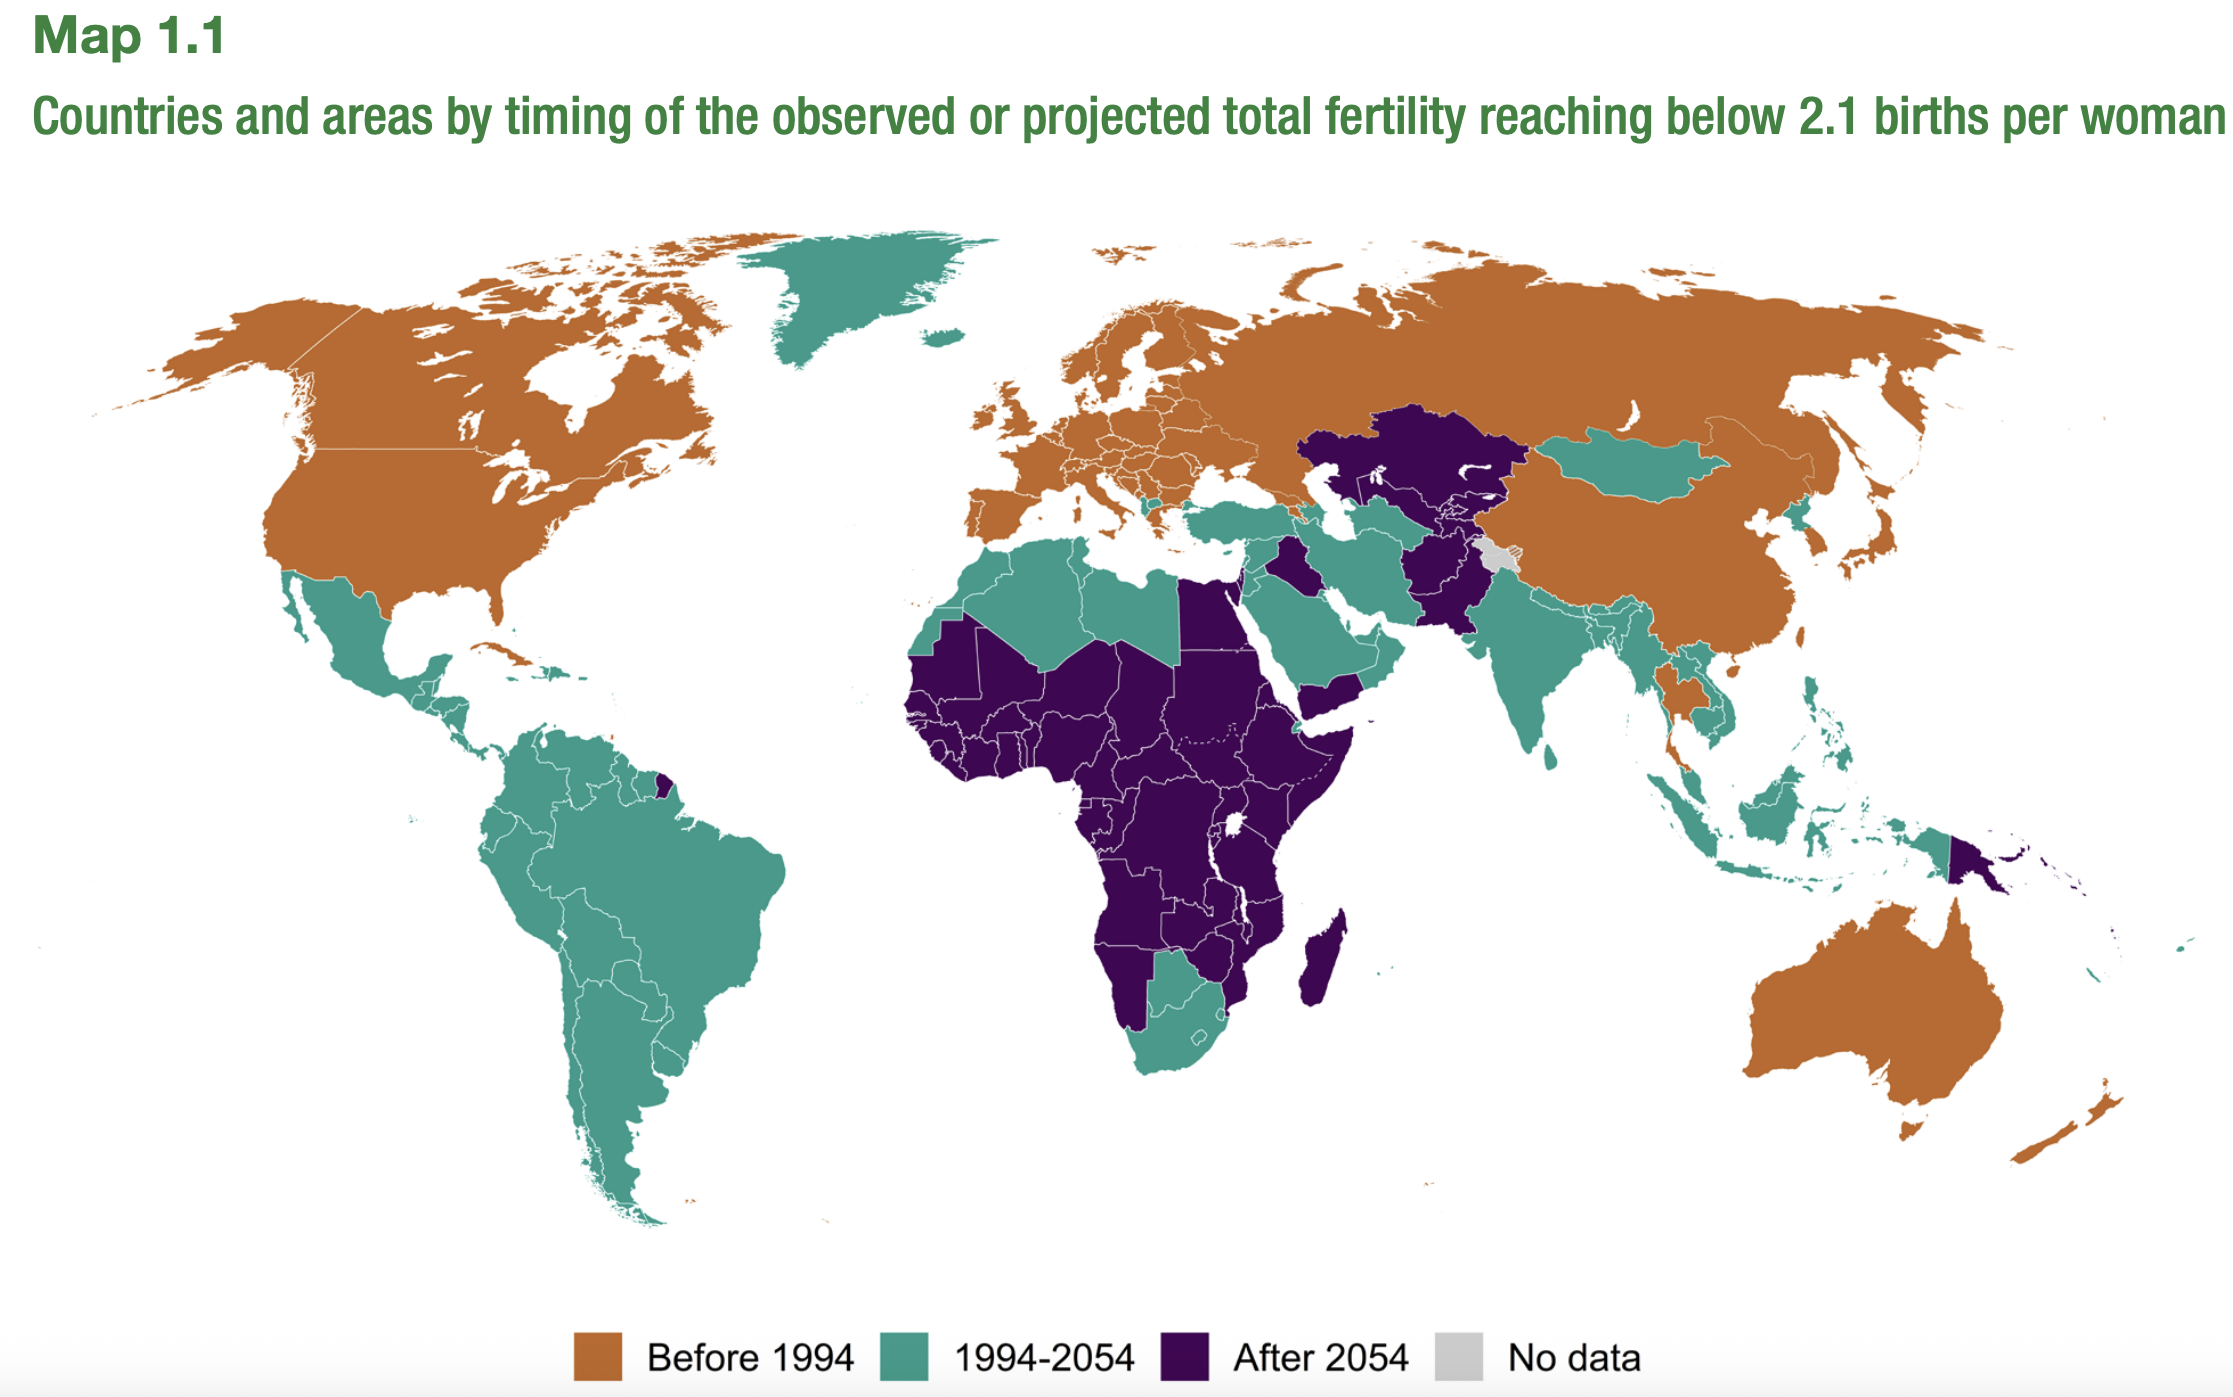
Fertility Rate Decline by Country Map
The visualization titled "Countries and areas by timing of the observed or projected total fertility reaching below the ...
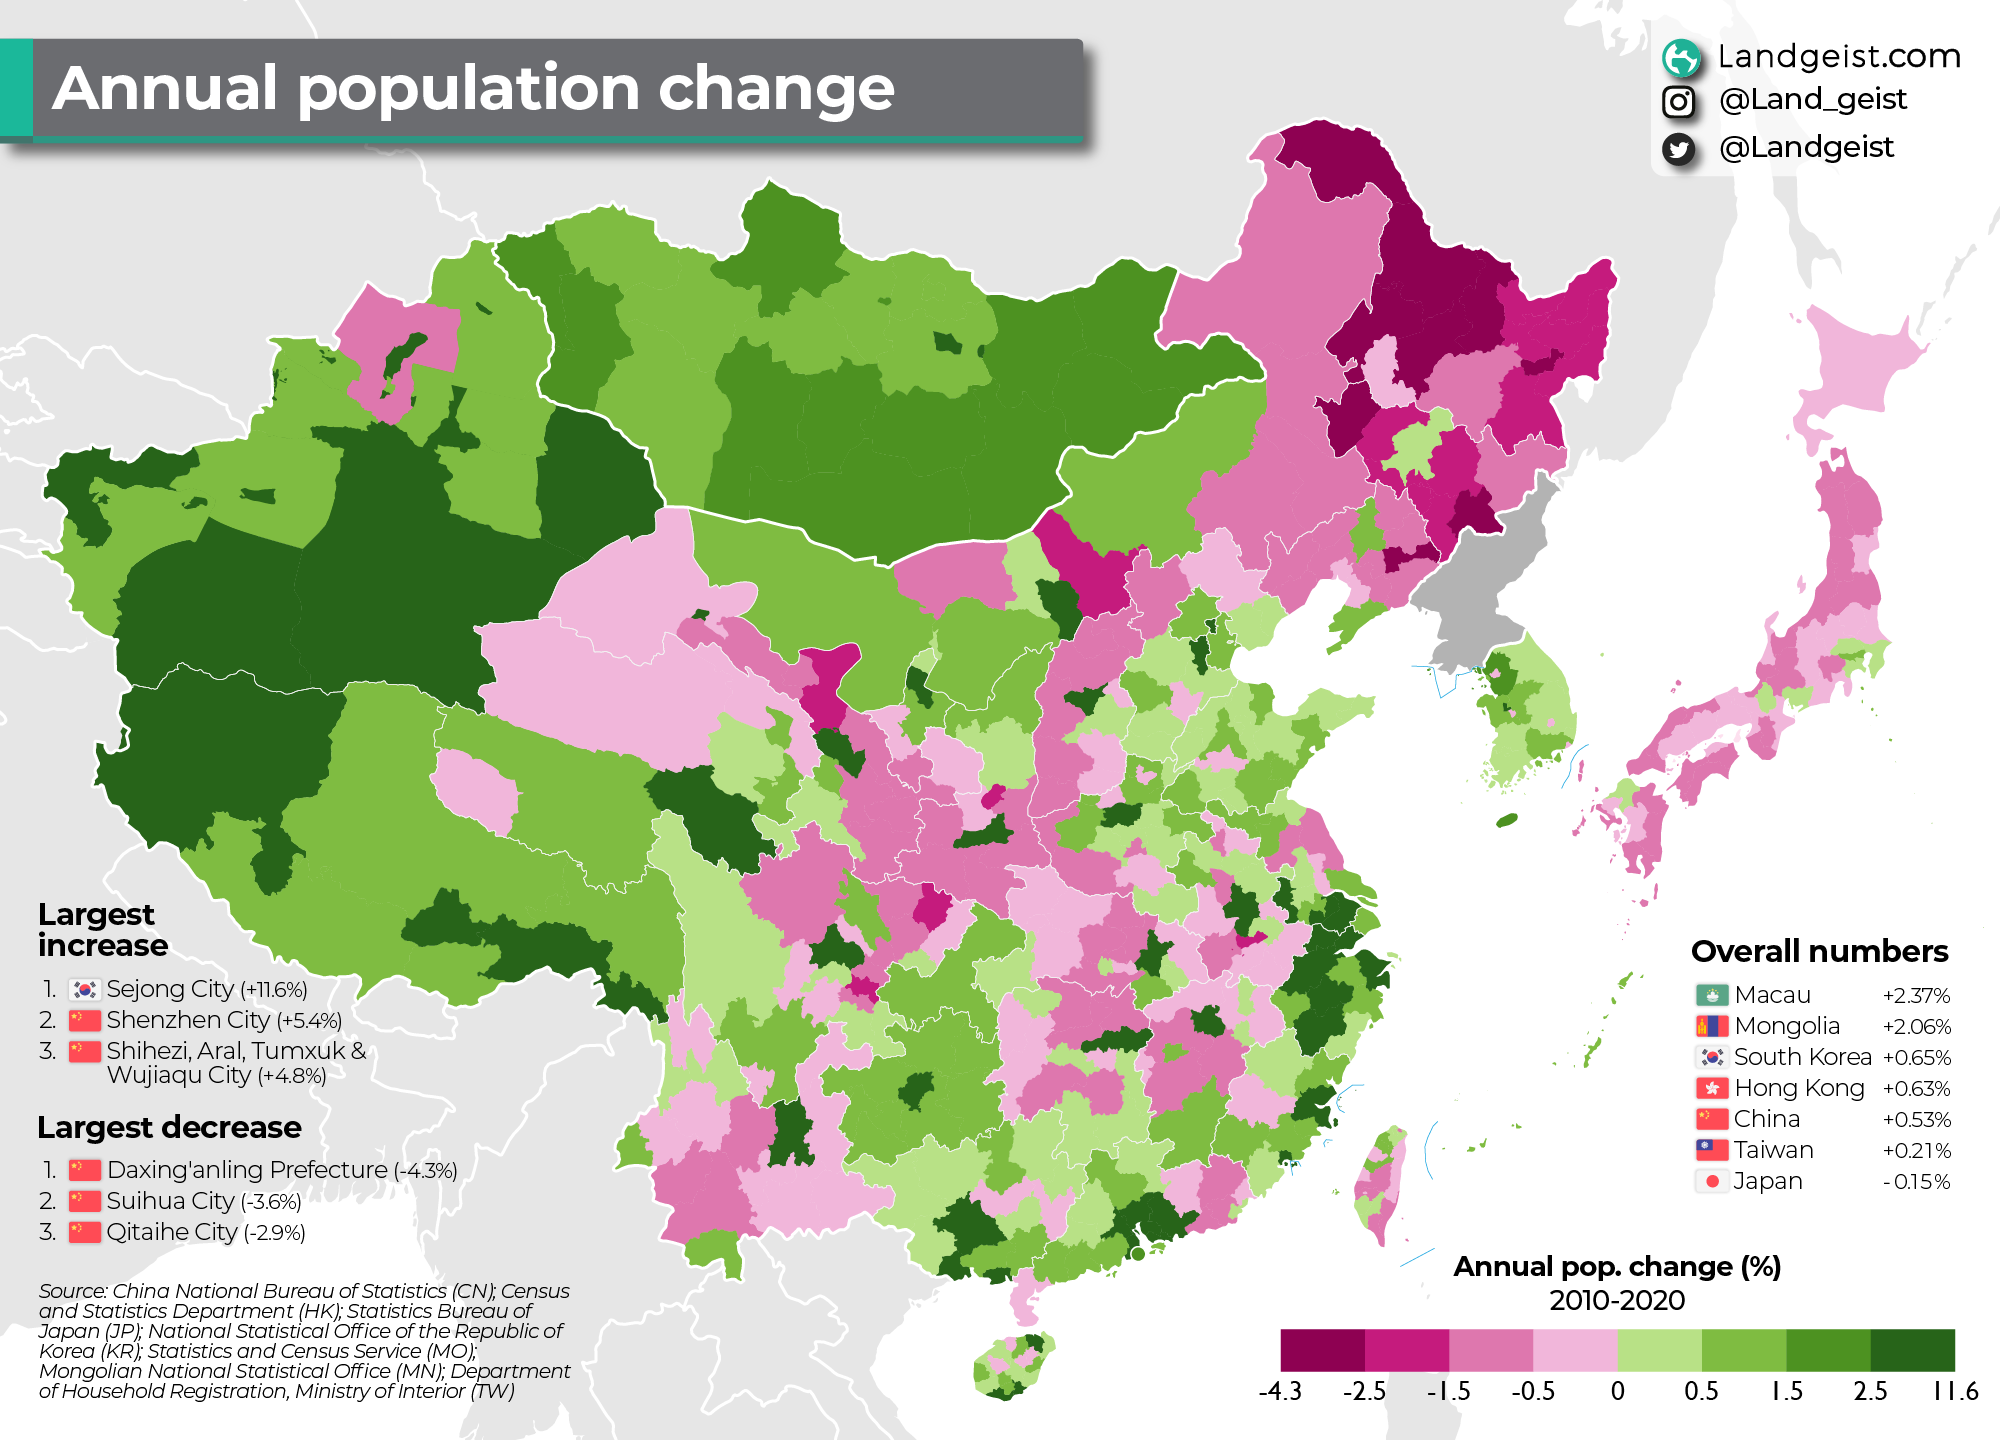
Annual Population Change Map of East Asia 2010-2020
This map illustrates the annual population change in East Asia from 2010 to 2020, providing a vivid snapshot of demograp...
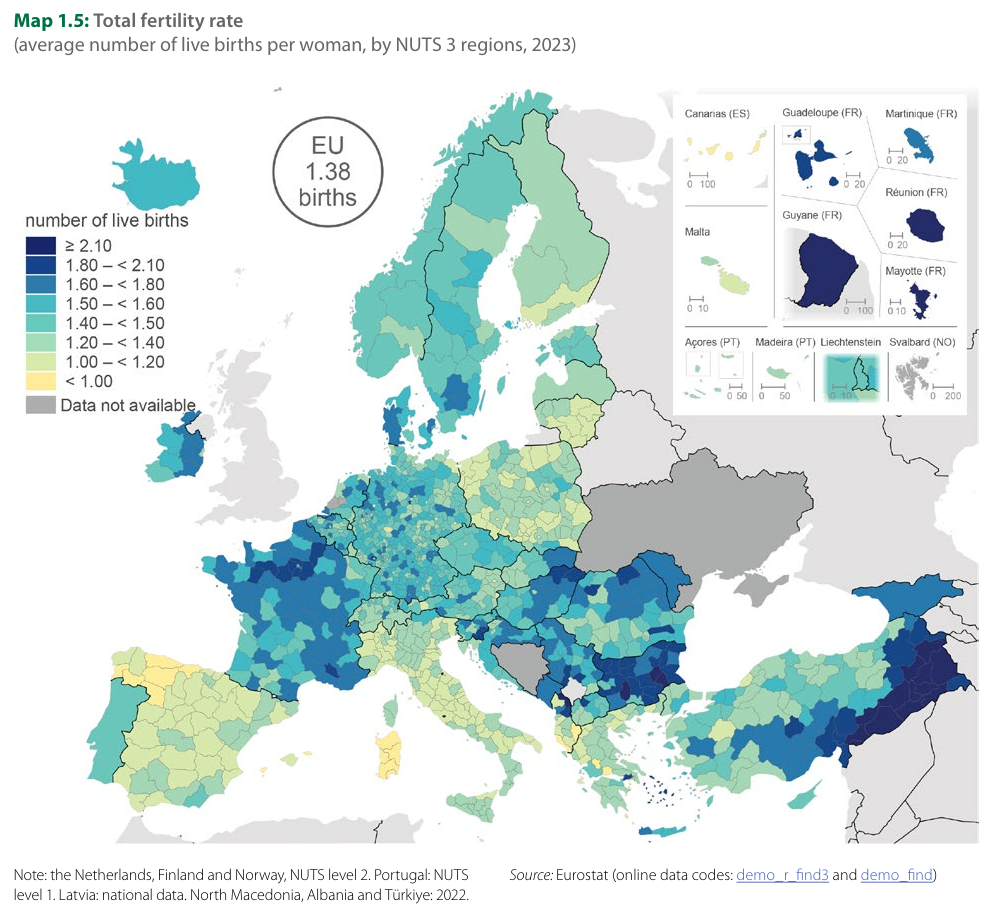
Fertility Rate Per Woman Map of Europe
The visualization titled "Europe's Fertility Rate Per Woman via EuroStats through NUTS-3 Level Regional Data" provides a...
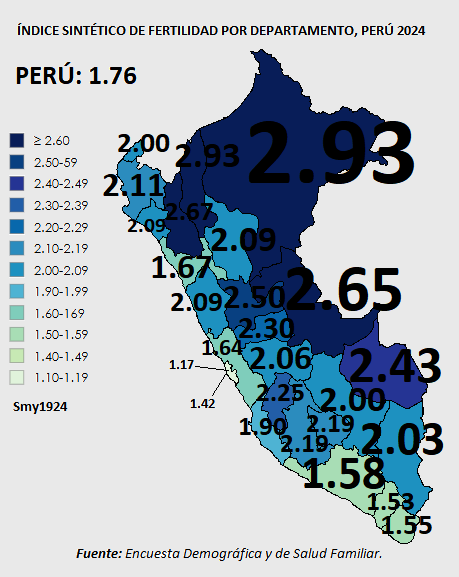
Total Fertility Rate Map of Peru 2024
The map titled "Total Fertility Rate (Children per Woman), Perú 2024" provides a visual representation of the average nu...
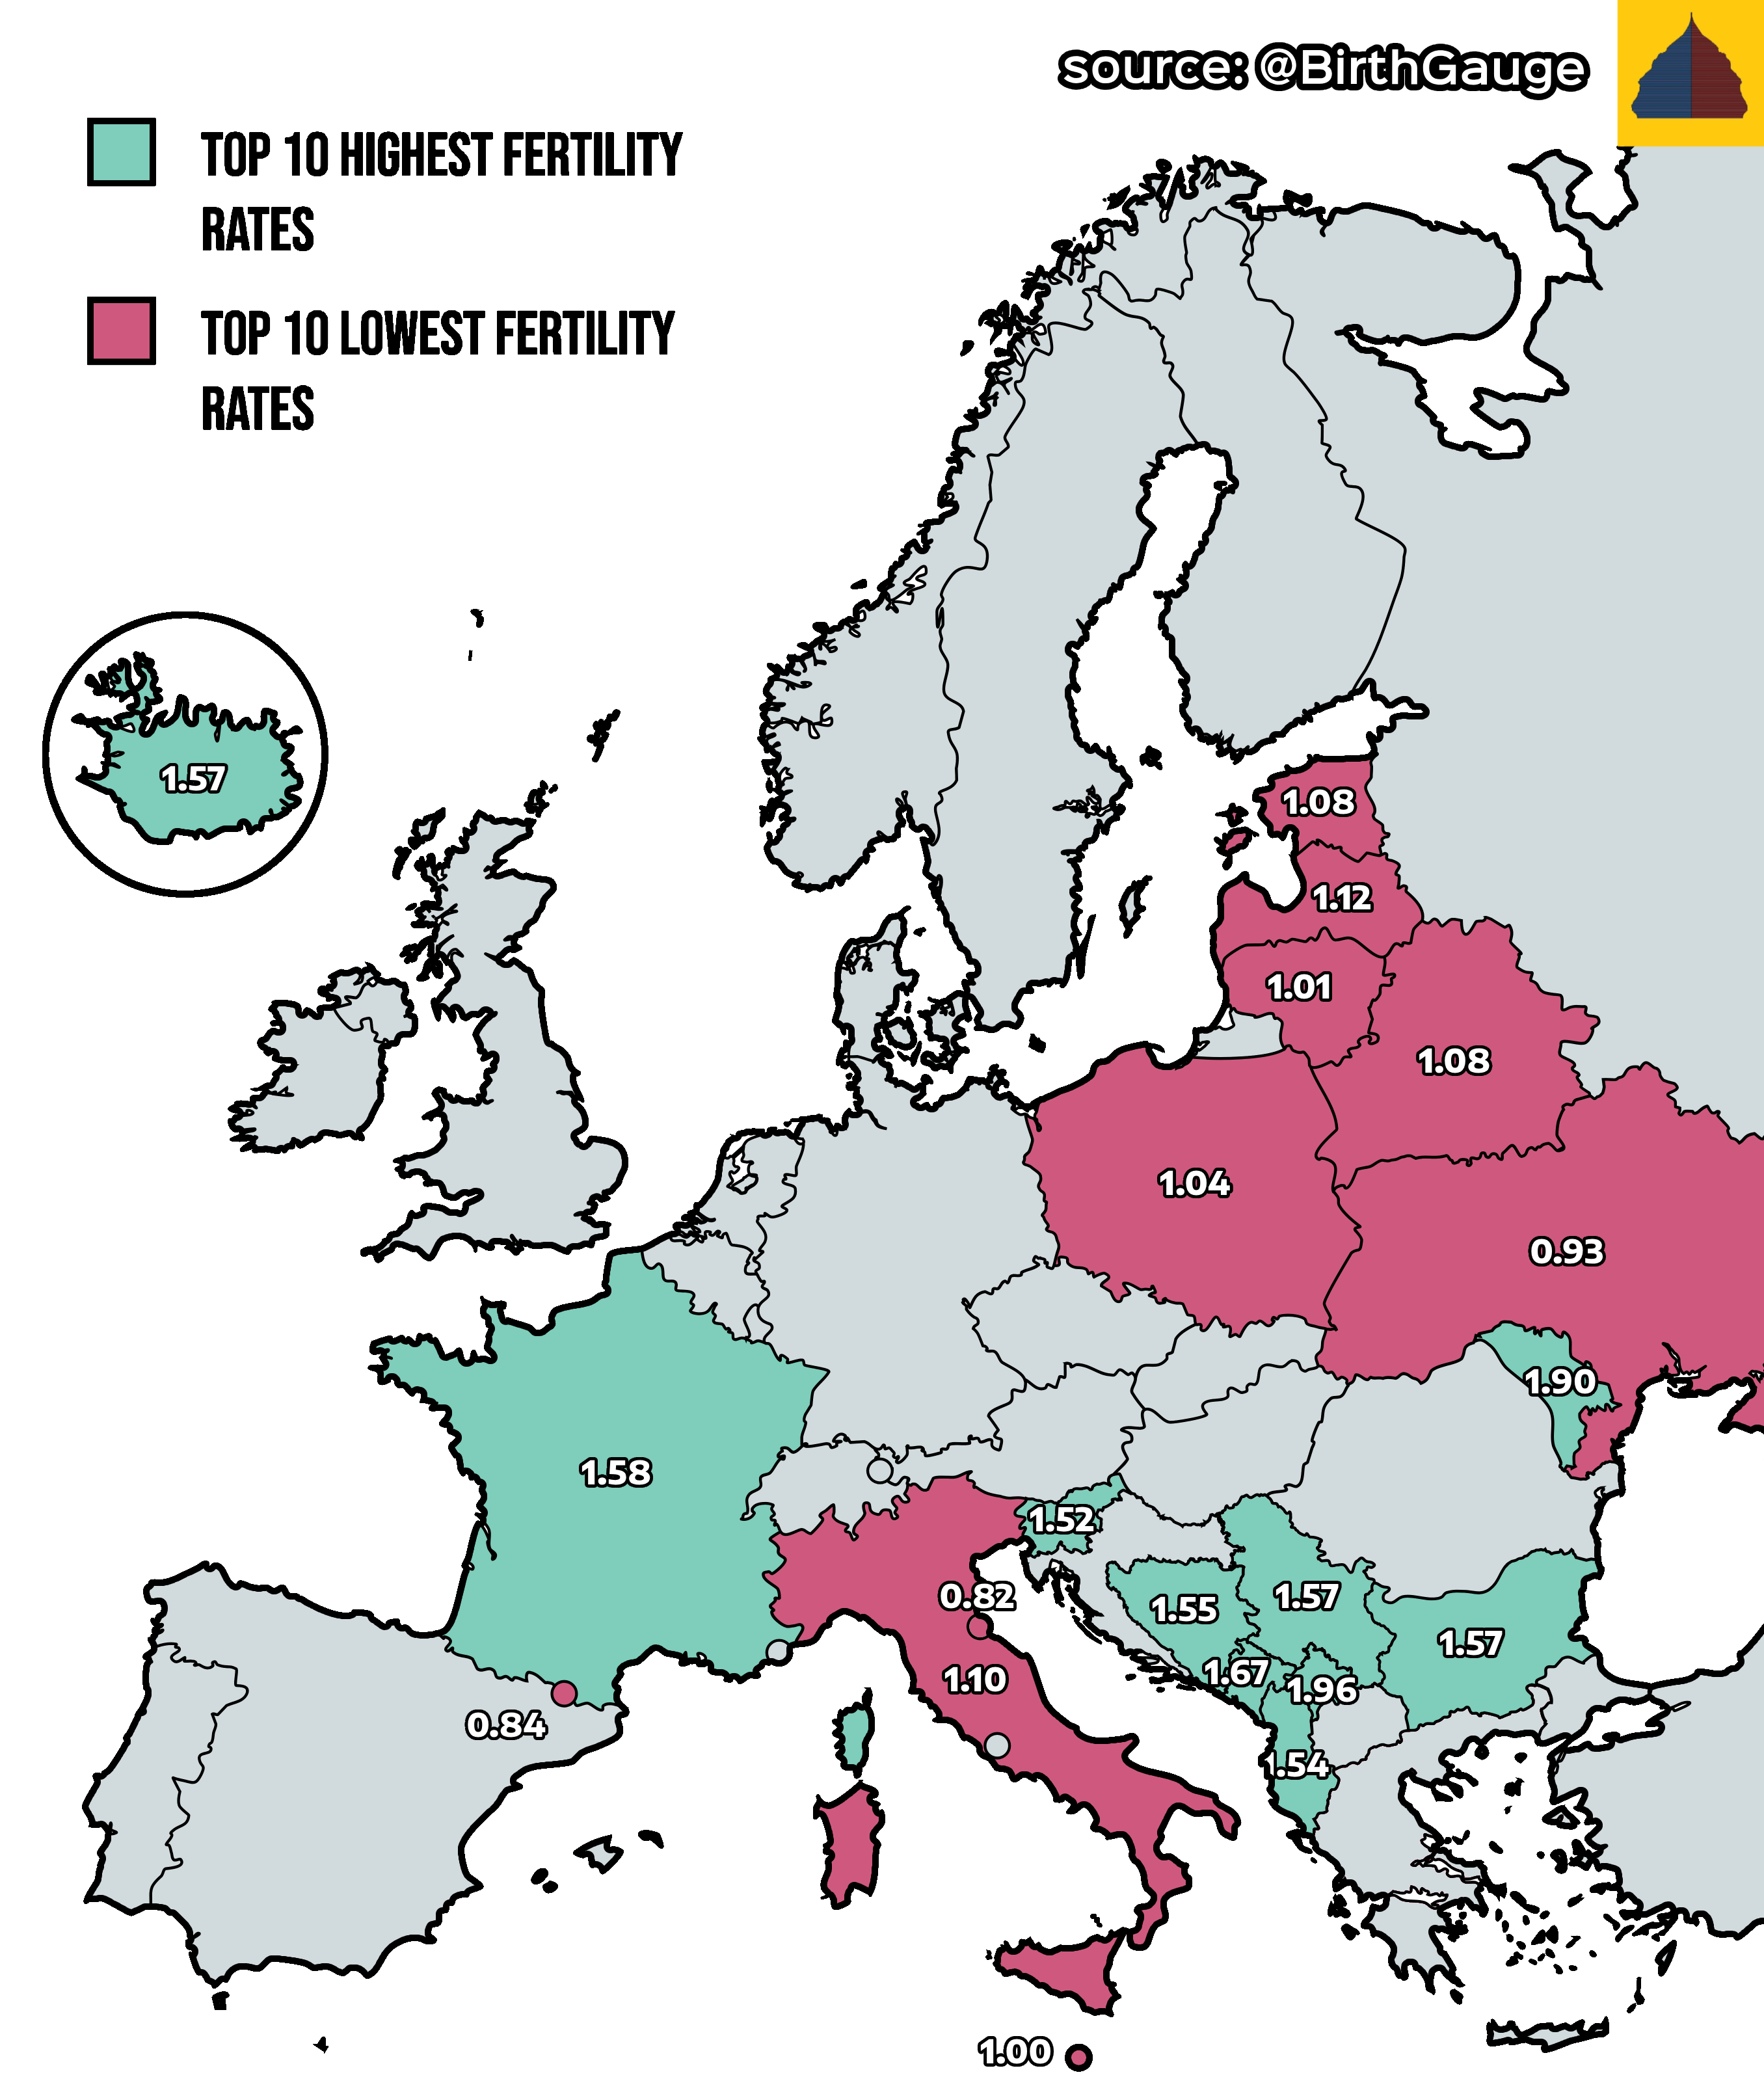
Europe’s Highest and Lowest Fertility Rates Map
The \...